. 2019 Apr 1;216(4):982-1000.
doi: 10.1084/jem.20180870. Epub 2019 Mar 14.

Secreted PD-L1 variants mediate resistance to PD-L1 blockade therapy in non-small cell lung cancer

Affiliations

Secreted PD-L1 variants mediate resistance to PD-L1 blockade therapy in non-small cell lung cancer

Bo Gong et al. J Exp Med. .

Abstract

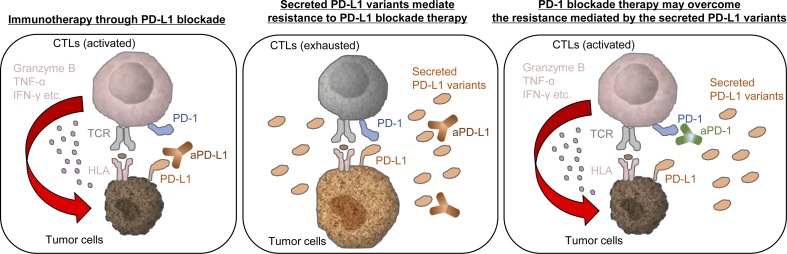
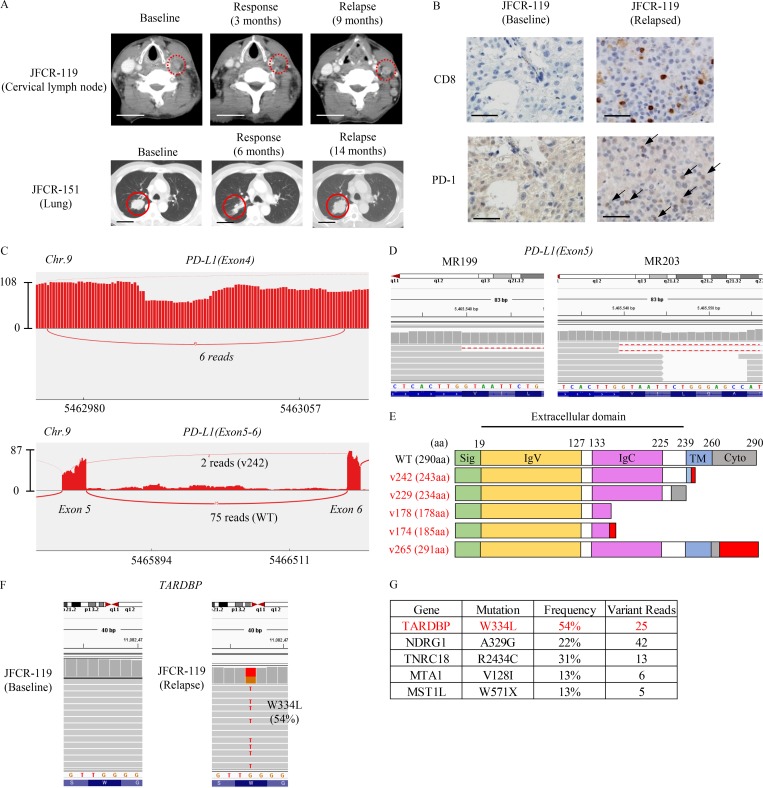
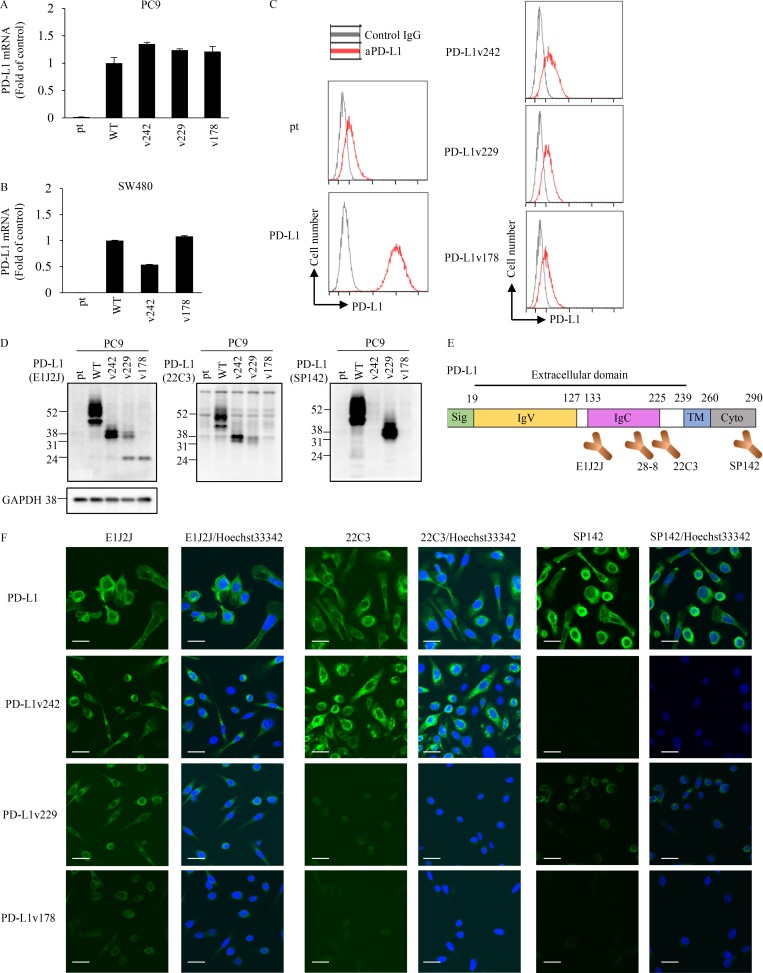
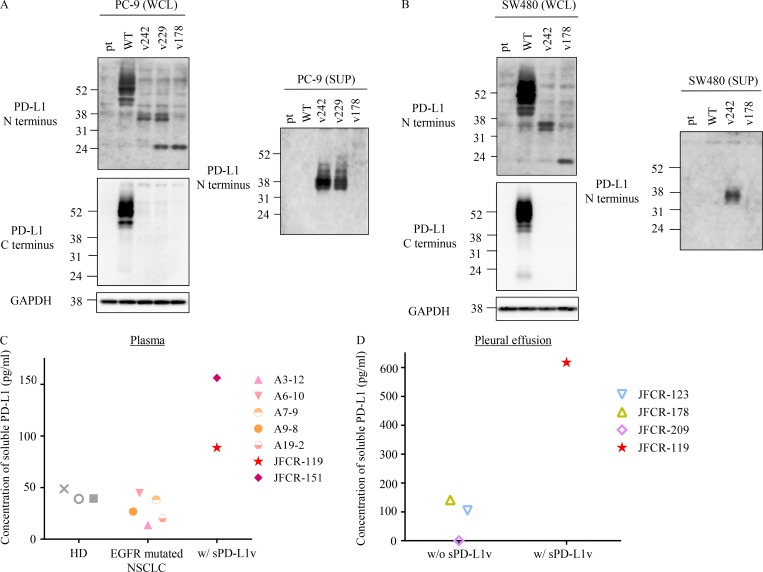
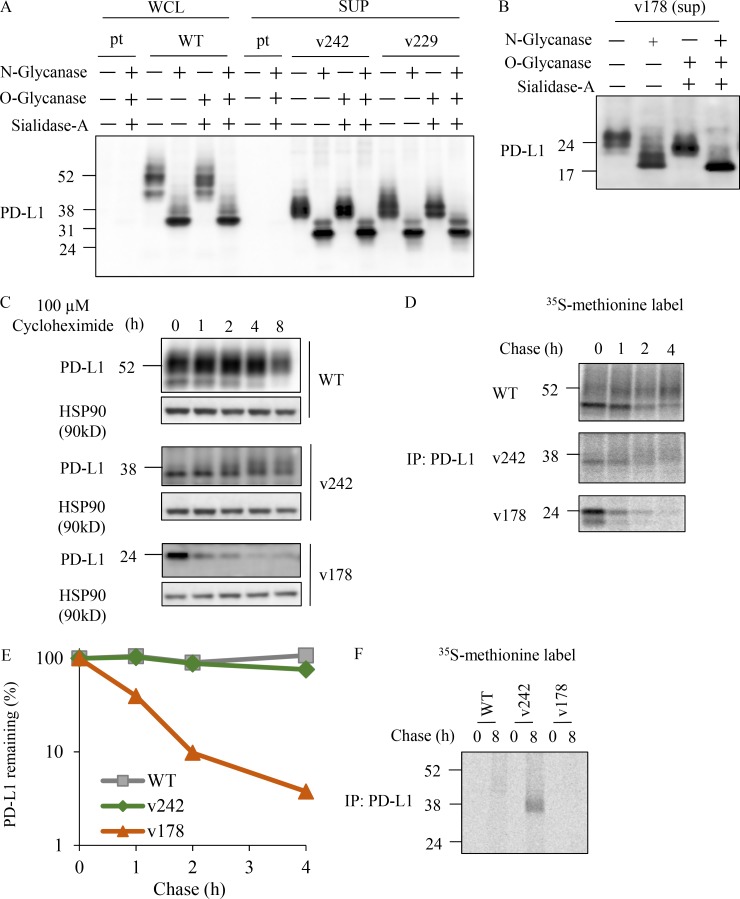
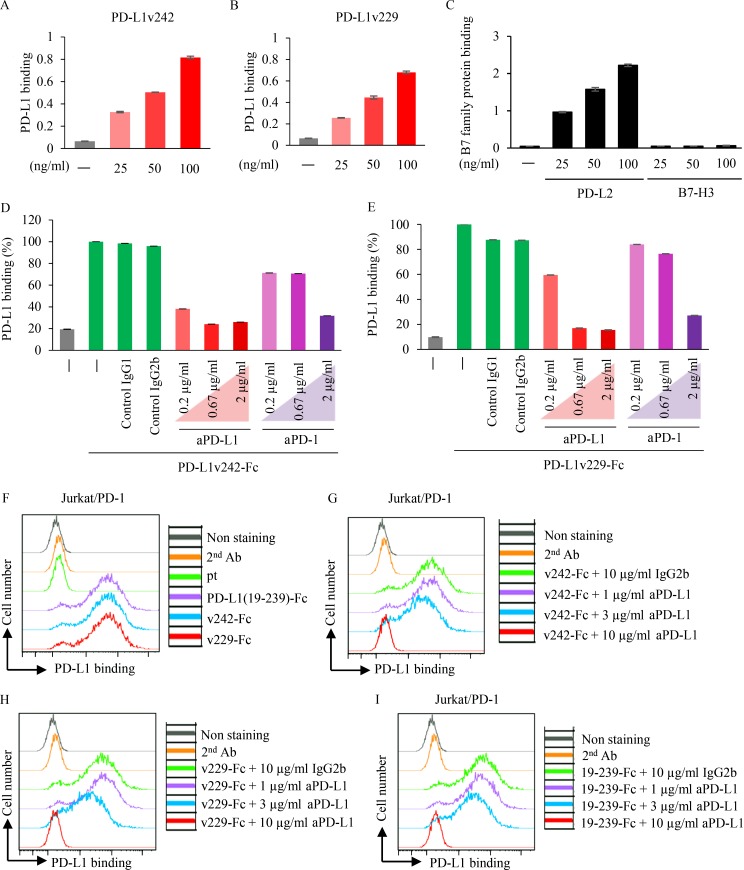
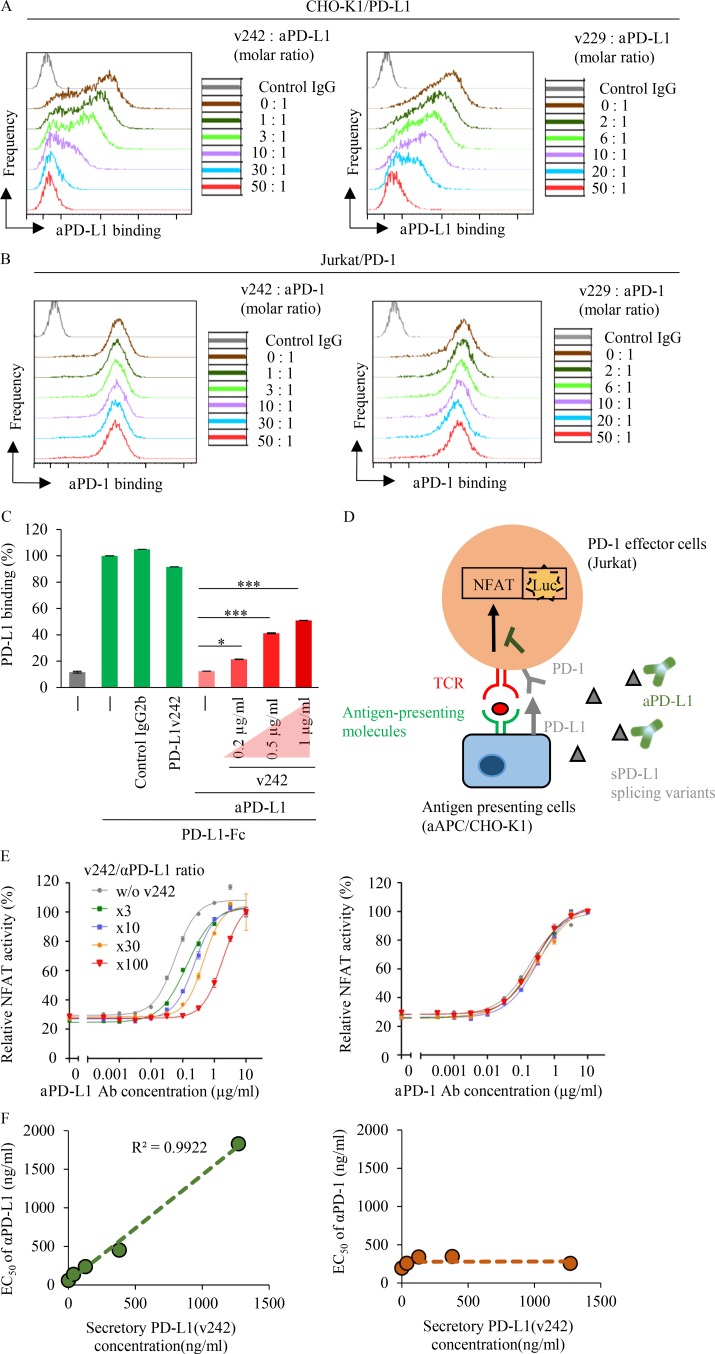
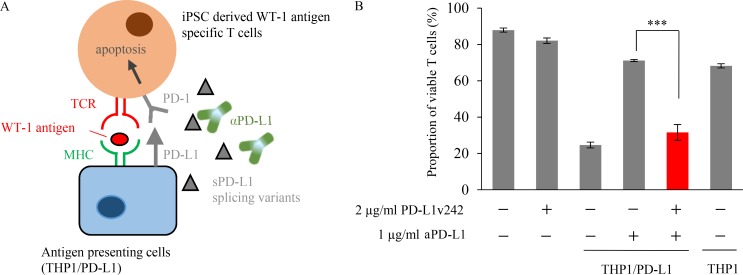
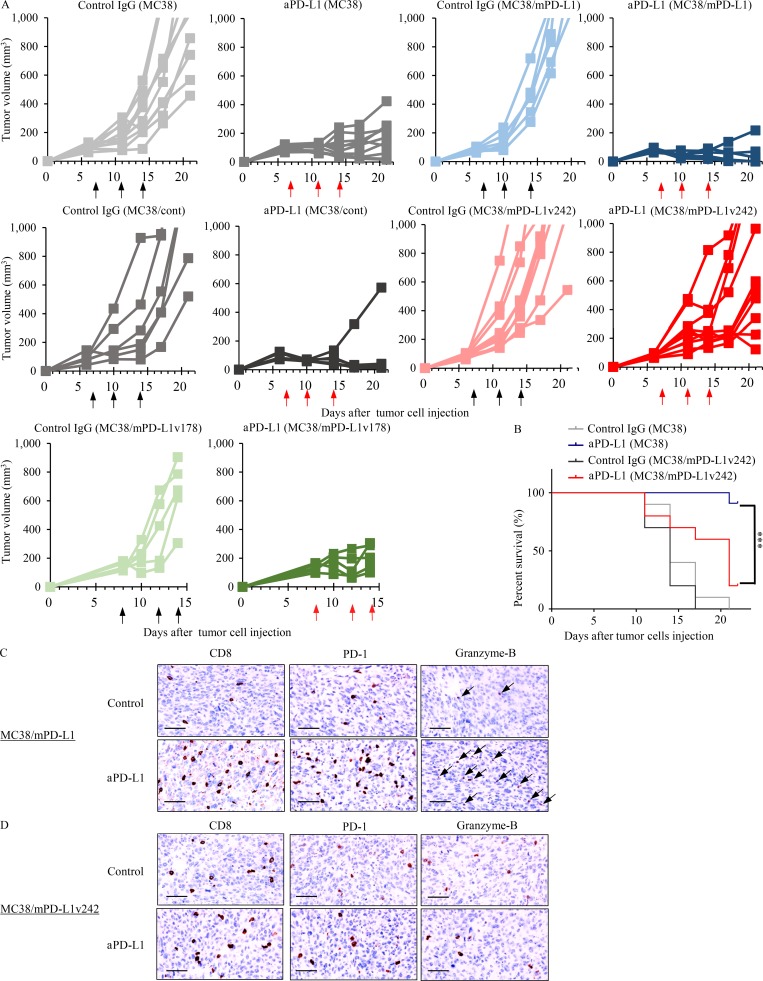
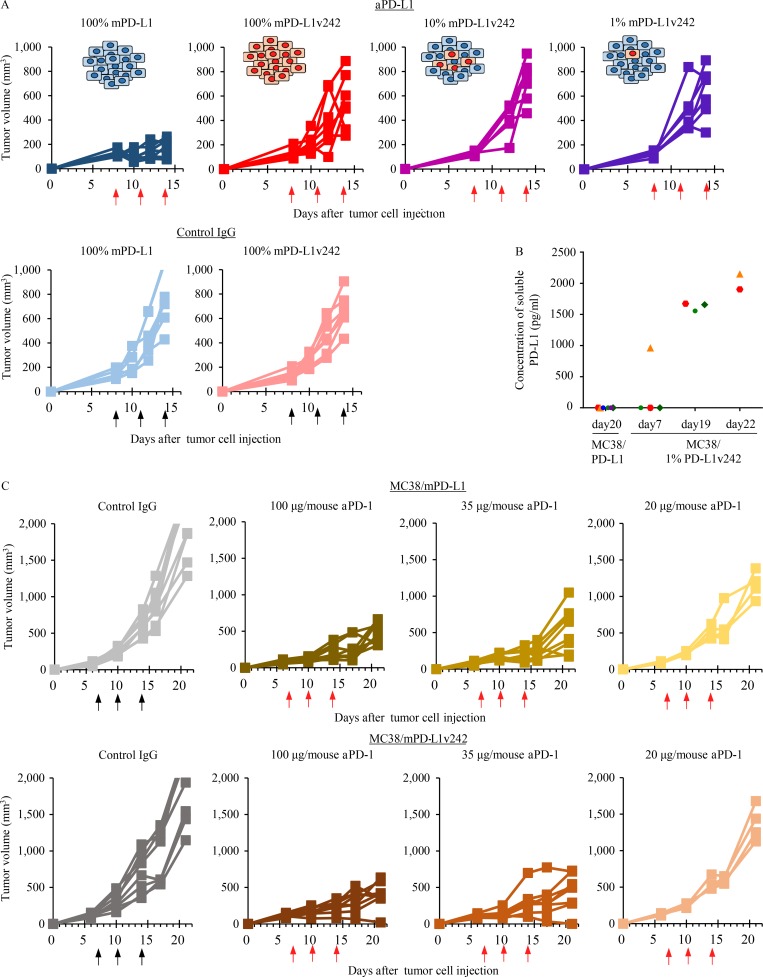
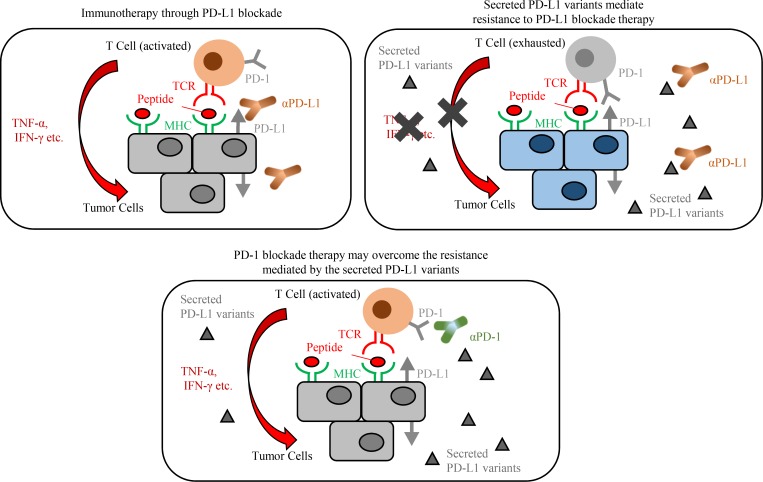
Immune checkpoint blockade against programmed cell death 1 (PD-1) and its ligand PD-L1 often induces durable tumor responses in various cancers, including non-small cell lung cancer (NSCLC). However, therapeutic resistance is increasingly observed, and the mechanisms underlying anti-PD-L1 (aPD-L1) antibody treatment have not been clarified yet. Here, we identified two unique secreted PD-L1 splicing variants, which lacked the transmembrane domain, from aPD-L1-resistant NSCLC patients. These secreted PD-L1 variants worked as "decoys" of aPD-L1 antibody in the HLA-matched coculture system of iPSC-derived CD8 T cells and cancer cells. Importantly, mixing only 1% MC38 cells with secreted PD-L1 variants and 99% of cells that expressed wild-type PD-L1 induced resistance to PD-L1 blockade in the MC38 syngeneic xenograft model. Moreover, anti-PD-1 (aPD-1) antibody treatment overcame the resistance mediated by the secreted PD-L1 variants. Collectively, our results elucidated a novel resistant mechanism of PD-L1 blockade antibody mediated by secreted PD-L1 variants.


Figures

None
Graphical abstract
Figure 1.
Figure 1.
Identification of PD-L1 C-terminal–deficient splicing variants in patients who were relapsed from PD-L1 blockade therapy. (A) Representative computed tomographic images of JFCR-119 and JFCR-151 at baseline and at the time of relapse. Bars, 5 cm. (B) Representative IHC staining of CD8 and PD-1 at baseline and in the relapsed tumor from JFCR-119. Bars, 10 µm. (C) Sashimi plot RNA-seq analysis of the PD-L1 spliced region. The figure shows representative data for PD-L1v178 (above) and PD-L1v242 (below) in MR203. (D) Integrative genomics viewer (IGV) data indicating PD-L1v242 in MR199 and MR203 are shown. (E) The PD-L1 splicing variants identified from JFCR-119 and JFCR-151. The domains are indicated as follows: signal peptide (Sig) on 1–18 aa as green; IgV domain on 19–127 aa as yellow; IgC domain on 133–225 aa as pink; transmembrane domain (TM) on 239–259 aa as blue; and cytoplasmic domain (Cyto) on 260–290 aa as gray. The red region demonstrates the additional amino acids from aberrant splicing. (F) IGV data of TARDBP on the mutated region in pretreatment and relapsed samples of JFCR-119. (G) Relapsed tumor-specific mutations in JFCR-119 analyzed by RNA-seq.
Figure 2.
Figure 2.
The recognition pattern of PD-L1 splicing variants by aPD-L1 antibodies. (A and B) PD-L1 mRNA levels in PD-L1 splicing variant overexpressing PC-9 (A) or SW480 (B) parental (pt) cells were quantified with real-time PCR. The results from three independent experiments are expressed as mean ± SD normalized by that of PC-9/PD-L1 or SW480/PD-L1, respectively. (C) Flow cytometric analysis of PD-L1 expression on cell surface in parental, WT, and PD-L1 variants expressing PC-9 cells. (D and F) PD-L1-WT and splicing variants with different aPD-L1 antibodies were detected by Western blotting (D) and immunofluorescence staining (F). Bars, 10 µm. (E) The epitopes of the aPD-L1 antibodies were roughly estimated by Western blotting and immunofluorescence staining. C and F were independently performed twice, yielding similar results. D was conducted once.
Figure 3.
Figure 3.
PD-L1 C-terminal–deficient splicing variants in the relapsed tumor were secreted. (A and B) WCL from PC-9 (A) and SW480 (B) cells which were overexpressed each PD-L1 variants as indicated were analyzed by Western blot. The culture supernatants (SUP) were analyzed following acetone precipitation. (C and D) Quantitative analysis of soluble PD-L1 in plasma (C) and pleural effusion (D) from healthy donors (HD), EGFR-mutated NSCLC patients, and patients with the detected PD-L1 splicing variants (JFCR-119 and JFCR-151). Each experiment was independently performed twice, yielding similar results.
Figure 4.
Figure 4.
PD-L1 C-terminal–deficient splicing variants from relapsed tumor were stable. (A and B) Glycosylation analysis of sPD-L1 variants. WCL of PC-9 parental cell (pt) and PC-9/PD-L1, or concentrated sPD-L1 variants obtained from culture supernatant (SUP) of PC-9/PD-L1v242, PC-9/PD-L1v229 (A), and PC-9/PD-L1v178 (B) were treated with N-glycanase, sialidase-A, or O-glycanase for 3 h at 37°C and then analyzed by Western blot. (C) Immunoprecipitated samples from WCL and culture supernatant with aPD-L1 antibody were analyzed by Western blot. HSP90 in WCL were used as the loading control. (D) 35S-labeled methionine cells were cultured in a radio-free medium for the indicated period. Immunoprecipitated (IP) samples from WCL and the culture supernatant were evaluated with SDS-PAGE and visualized with a phosphor imaging scanner. (E) The remaining PD-L1 was quantified with ImageJ software based on the results of (D). (F) Phosphor imaging of culture supernatant samples immunoprecipitated by aPD-L1 antibody. C–F were independently performed twice, yielding similar results. A and B were conducted once.
Figure 5.
Figure 5.
sPD-L1 splicing variants bind to PD-1. (A–C) The binding of PD-L1v242 (A), PD-L1v229 (B), PD-L2, and B7-H3 to PD-1 (C) were evaluated by ELISA (n = 3). Results are expressed as mean ± SD. (D and E) Purified Fc-tagged PD-L1v242 (D) and PD-L1v229 (E) preincubated with or without aPD-L1 or aPD-1 antibody for 30 min was incubated in PD-1 coated wells for 2 h at RT. The binding of PD-L1 variants to PD-1 was detected based on the absorbance at 450 nm (n = 3). Results are expressed as mean ± SD. (F–I) Flow cytometry analysis for evaluating sPD-L1 splicing variants binding to PD-1. Culture supernatant from CHO parental cell (pt) and those overexpressing PD-L1v242-Fc (F and G), PD-L1v229-Fc (F and H), and PD-L1(19–239)-Fc (F and I) was incubated with Jurkat/PD-1 cells in the condition described for 1 h. Fc-tagged PD-L1 variant binding to PD-1 was evaluated with flow cytometer. Each experiment was independently performed twice, yielding similar results. The data of nonstaining and secondary antibody (2nd Ab) as negative control in F–I were the same.
Figure 6.
Figure 6.
sPD-L1 splicing variants attenuate the neutralizing activity of aPD-L1 by trapping the antibody. (A and B) Flow cytometric analysis of aPD-L1 antibody binding to PD-L1 (A) and aPD-1 antibody binding to PD-1 (B) in the presence of indicated sPD-L1 variants molar ratio. (C) Fc-tagged PD-L1 and aPD-L1 antibodies (0.75 µg/ml) preincubated with or without PD-L1v242 as indicated were added to PD-1 precoated 96-well ELISA plates. The binding of Fc-tagged PD-L1 to PD-1 was detected based on absorbance at 450 nm; 0.2 µg/ml PD-L1v242 is equal to 0.75 µg/ml aPD-L1 antibody in molar ratio. n = 3. Results are expressed as mean ± SD. Paired two-tailed Student t test was used. *, P < 0.05; ***, P < 0.001. (D) Schematic diagram illustrating the NFAT-luc assay for evaluating TCR-mediated NFAT transduction. (E) The neutralizing activity (EC50) of aPD-L1 and aPD-1 antibodies was determined using NFAT-luc assay in the presence of various molar ratios of PD-L1v242 to the antibody (n = 3). Results are expressed as mean ± SD. (F) The correlation between PD-L1v242 and the EC50 of the antibody according to the Lineweaver–Burk plot was analyzed based on the results of (E), which suggested that the sPD-L1 splicing variants reduce the aPD-L1 inhibitory activity competitively. Each experiment was independently performed twice, yielding similar results.
Figure 7.
Figure 7.
sPD-L1 splicing variants contribute the resistance to PD-L1 blockade in WT-1 tumor antigen–specific iPSC-derived CD8 T cell model. (A) Schematic illustration of apoptosis assay for testing whether PD-L1v242 attenuates the blockade effect of aPD-L1 antibody. (B) iPSC-derived WT-1–specific T cells overexpressing PD-1 were cocultured with THP-1 cells overexpressing PD-L1 for 18 h in the presence of aPD-L1 antibody (1 µg/ml) or PD-L1v242 (2 µg/ml). The dead cell ratio was flow cytometrically measured using propidium iodide staining, and bars represent the proportion of live T cells in comparison with those before coculture. 2 µg/ml of PD-L1v242 was approximately eight times more than 1 µg/ml aPD-L1 antibody in molar ratio. The results are representative from three independent experiments and are shown as mean ± SD (n = 3). Paired two-tailed Student t test was used. ***, P < 0.001. The experiment was independently performed twice, yielding similar results.
Figure 8.
Figure 8.
sPD-L1 splicing variants mediate the resistance to PD-L1 blockade in MC38 syngeneic mouse model. (A) C57BL/6 mice bearing MC38/cont (n = 6), MC38/mPD-L1 (n = 6), MC38 (n = 10), MC38/mPD-L1v242 (n = 10), and MC38/mPD-L1v178 (n = 5) were intraperitoneally administrated 50 µg/mouse control IgG or 35 µg/mouse aPD-L1 antibody. The schedules for treatment are indicated by black arrows (control IgG) and red arrows (aPD-L1). Tumor volume is plotted individually. (B) Kaplan–Meier survival curves for mice bearing MC38 or MC38/mPD-L1v242. The survival curves were compared by applying the Gehan–Breslow–Wilcoxon test. ***, P < 0.001. (C and D) Representative IHC staining of mouse CD8, PD-1, and granzyme B was performed on day 21 for MC38/mPD-L1 (C) and MC38/mPD-L1v242 (D) xenograft tumors. Bars, 20 µm. Each experiment was independently performed twice, yielding similar results.
Figure 9.
Figure 9.
aPD-1 treatment overcame the resistance to PD-L1 blockade induced by sPD-L1 splicing variants in MC38 syngeneic mouse model. (A) C57BL/6 mice bearing MC38/mPD-L1 (n = 7), MC38/mPD-L1v242 (n = 7), 10% MC38/mPD-L1v242 + 90% MC38/mPD-L1 (n = 7), and 1% MC38/mPD-L1v242 + 99% MC38/mPD-L1 (n = 7) were intraperitoneally administered 35 µg/mouse control IgG or 35 µg/mouse aPD-L1 antibody. The schedules for treatment are indicated by black arrows for control IgG and red arrows for aPD-L1. The plot shows the tumor volumes for each mouse. (B) The plasma levels of soluble PD-L1 in mice bearing MC38/mPD-L1 and 1% MC38/mPD-L1v242 were sequentially evaluated by ELISA. To remove the exosome fraction, the plasma was ultracentrifuged at 100,000 g for 90 min. (C) C57BL/6 mice bearing MC38/mPD-L1 and MC38/mPD-L1v242 were intraperitoneally administrated either 100 µg/mouse control IgG (n = 8) or aPD-1 antibody at doses of 100 µg/mouse (n = 8), 35 µg/mouse (n = 8), or 20 µg/mouse (n = 4). The treatment days are indicated by black arrows for control IgG and red arrows for aPD-1. The plot shows the tumor volumes for each mouse. A was independently performed twice, yielding similar results. B and C were conducted once.
Figure 10.
Figure 10.
The proposed model for the sPD-L1 splicing variants associated with resistance to aPD-L1 antibody treatment.

References

    1. Arnold E.S., Ling S.C., Huelga S.C., Lagier-Tourenne C., Polymenidou M., Ditsworth D., Kordasiewicz H.B., McAlonis-Downes M., Platoshyn O., Parone P.A., et al. 2013. ALS-linked TDP-43 mutations produce aberrant RNA splicing and adult-onset motor neuron disease without aggregation or loss of nuclear TDP-43. Proc. Natl. Acad. Sci. USA. 110:E736–E745. 10.1073/pnas.1222809110 - DOI - PMC - PubMed
    1. Callahan M.K., Postow M.A., and Wolchok J.D.. 2016. Targeting T Cell Co-receptors for Cancer Therapy. Immunity. 44:1069–1078. 10.1016/j.immuni.2016.04.023 - DOI - PubMed
    1. Chen G., Huang A.C., Zhang W., Zhang G., Wu M., Xu W., Yu Z., Yang J., Wang B., Sun H., et al. 2018. Exosomal PD-L1 contributes to immunosuppression and is associated with anti-PD-1 response. Nature. 560:382–386. 10.1038/s41586-018-0392-8 - DOI - PMC - PubMed
    1. Crabtree G.R., and Olson E.N.. 2002. NFAT signaling: choreographing the social lives of cells. Cell. 109(2, Suppl):S67–S79. 10.1016/S0092-8674(02)00699-2 - DOI - PubMed
    1. Dobin A., Davis C.A., Schlesinger F., Drenkow J., Zaleski C., Jha S., Batut P., Chaisson M., and Gingeras T.R.. 2013. STAR: ultrafast universal RNA-seq aligner. Bioinformatics. 29:15–21. 10.1093/bioinformatics/bts635 - DOI - PMC - PubMed

Publication types

MeSH terms