Comparative Study
. 2019 Mar 14;9(1):4471.
doi: 10.1038/s41598-019-40339-6.

DNA DSB Repair Dynamics following Irradiation with Laser-Driven Protons at Ultra-High Dose Rates

Affiliations
Comparative Study

DNA DSB Repair Dynamics following Irradiation with Laser-Driven Protons at Ultra-High Dose Rates

F Hanton et al. Sci Rep. .

Abstract

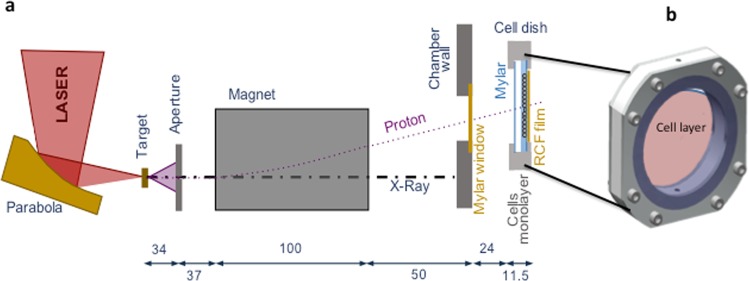
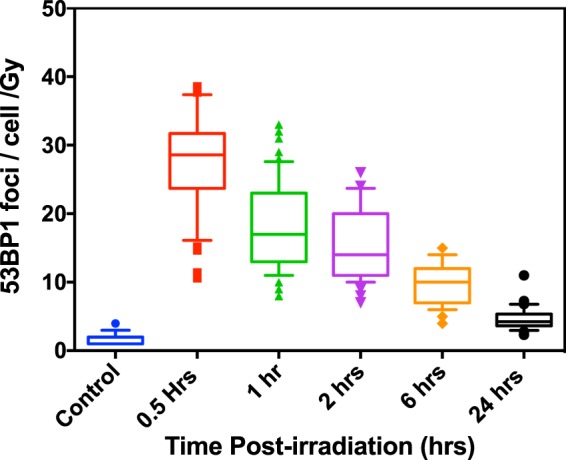
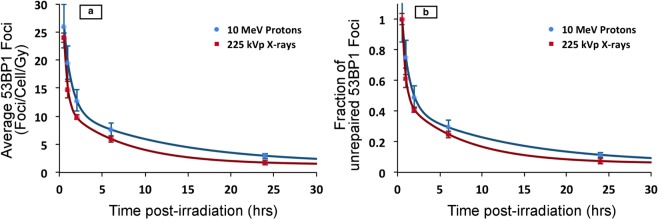
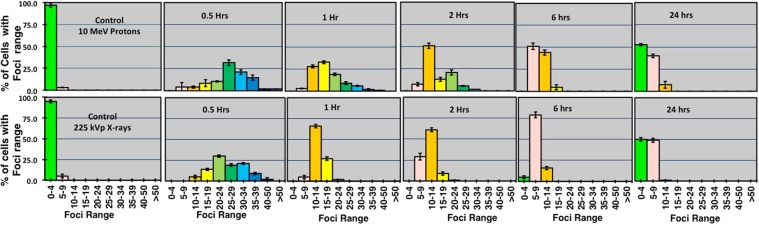
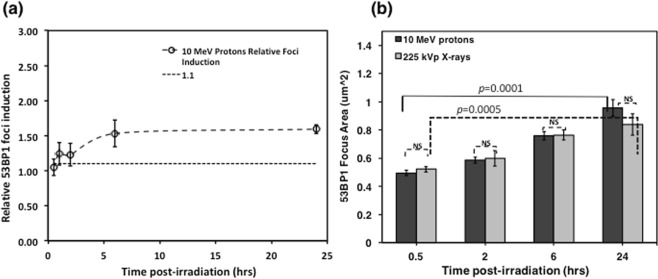
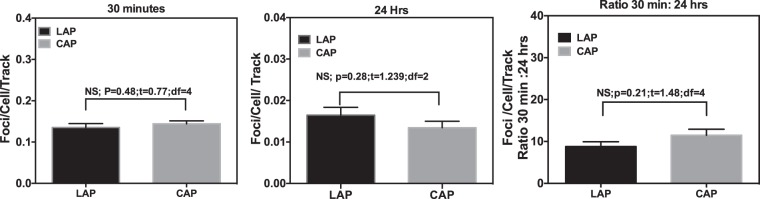
Protontherapy has emerged as more effective in the treatment of certain tumors than photon based therapies. However, significant capital and operational costs make protontherapy less accessible. This has stimulated interest in alternative proton delivery approaches, and in this context the use of laser-based technologies for the generation of ultra-high dose rate ion beams has been proposed as a prospective route. A better understanding of the radiobiological effects at ultra-high dose-rates is important for any future clinical adoption of this technology. In this study, we irradiated human skin fibroblasts-AG01522B cells with laser-accelerated protons at a dose rate of 109 Gy/s, generated using the Gemini laser system at the Rutherford Appleton Laboratory, UK. We studied DNA double strand break (DSB) repair kinetics using the p53 binding protein-1(53BP1) foci formation assay and observed a close similarity in the 53BP1 foci repair kinetics in the cells irradiated with 225 kVp X-rays and ultra- high dose rate protons for the initial time points. At the microdosimetric scale, foci per cell per track values showed a good correlation between the laser and cyclotron-accelerated protons indicating similarity in the DNA DSB induction and repair, independent of the time duration over which the dose was delivered.


Conflict of interest statement

The authors declare no competing interests.

Figures

Figure 1
Figure 1
Experimental set up for irradiation of the AG01522 cells with 10 MeV laser accelerated protons at the Gemini Laser facility of the Rutherford Appleton Laboratory, Didcot, Oxford. (a) Schematic of the Laser interaction chamber and cell dish arrangement during irradiations (the distance is given in centimeters). (b) Design of the dish where cells were grown as monolayers on 3 µm thin Mylar. Before irradiation the dish was mounted with another piece of mylar, to prevent the drying of monolayers and the gap between the two mylar pieces was filled with cell culture medium. During irradiation the medium was withdrawn with a motorized syringe system and refilled after irradiation of cells.
Figure 2
Figure 2
(a) Raw image showing the energy spectra of the ions obtained by means of Thomson Parabola Spectrometer and image plate detector. (b) Typical profile of the energy distribution of protons and fully ionized carbon ions. (c) Proton and carbon energy dispersion along the cell plane, with the origin of the x-axis at the top edge of the Gafchromic film. As shown in the figure, the carbon ions with low initial energy are filtered out for a distance of 13 mm, overlapping only with protons of energies higher than 15 MeV. The dark red quadrilateral on the protons curve represents the Region-of-Interest (ROI in the energy and distance) where the cells were selected for analysis. (d) The RCF film shows the typical dose distribution just behind the cells plane, and the white dashed rectangle identifies the spatial location of above-mentioned ROI on RCF.
Figure 3
Figure 3
Quantitative analysis of the variations in 53BP1 foci per cell per Gy in AG01522B cells after exposure to 10 MeV (LET-4.6 keV/μm) laser-accelerated protons shown as whisker box plots generated using Prism 6 software. The lower part of the box indicate first quartile, the dividing line shows the median and top line shows the third quartile of the 53BP1 foci per cell per Gy. The lower and upper ends of the whisker indicate 10th and 90th percentile also indicating the outliers below 10th percentile and above 90th percentile. The number of cells considered for each data point ranged from 50–300 in three independent replicates.
Figure 4
Figure 4
Comparative analysis of 53BP1 foci induced by 10 MeV(LET-4.6 keV/μm) laser-accelerated protons and 225 kVp X-rays. (a) Average 53BP1 foci calculated over time and expressed as foci per cell per Gy for both 10 MeV protons and 225 kVp X-rays. The data was fitted with a Two Phase exponential decay model, which is most commonly used for fitting the foci kinetics. For each data point cells counted ranged from 50–300 in at least 3 independent replicates. The error bars represent the standard error of the mean. (b) Repair kinetics of 53BP1 foci shown as percentage of the residual 53BP1 foci over time calculated by considering the average foci at 30 minutes as 100% and all the average foci per cell values were normalized with 30 minutes for each time point. Similar to figure a, the percentage of foci remaining at each time point was fitted with a two phase decay equation (Eq. 1) using the exponential non-linear regression curve fitting function of the Prism-6 software as shown in the results section.
Figure 5
Figure 5
Sub-population radio-sensitivity analysis as shown through the 53BP1 foci distribution per cell. The top row shows the distribution of foci for laser-accelerated 10 MeV (LET-4.6 keV/μm) protons induced foci and bottom row for 225 kVp X-rays induced foci. The Y-axis shows the percentage of cells with foci range and X-axis in each graph shows the range of foci. For each data point all the cells scored for the average foci calculations were binned in the foci range as shown on X-axis of each graph. The error bars represent the SD of the foci per cell recorded in each group of the foci range as shown on X-axis of each sub-graph.
Figure 6
Figure 6
(a) Relative foci Induction of 10 MeV (LET-4.6 keV/μm) laser-accelerated protons to 225 kVp X-rays over 24 hours obtained by dividing the values of protons induced foci with X-rays induced foci. The dashed line represents 1.1 value based on the RBE of protons. In this paper to avoid any confusions with cell killing RBE we use the term Relative foci induction (RFI). (b) The size comparisons of the foci are shown in this figure here dark grey bars indicate the size of protons induced foci and light grey bars indicate the X-rays induced foci. The error bars represent standard deviations and for each data point at least 100 foci were compared values indicating the levels of statistical significance in size of the foci between 30 minutes and 24 hours; NS – non- significant.
Figure 7
Figure 7
Comparative analysis of 53BP1 foci per cell per track induced by the laser-accelerated protons (LAP) and cyclotron-accelerated protons(CAP) at - (a) 30 minutes and (b) 24 hours and (c) the ratio of the foci per track per cell at 30 minutes to 24 hours. LET values were obtained using GEANT4 kit of Monte Carlo simulations at the various depths along the 60 MeV proton beam SOBP generated at the Douglas cyclotron of Clatterbridge Centre for Oncology, where the average LET was 4.61 keV/μm, as published by Chaudhary et al., IJROBP. Average foci values were divided by the number of particle tracks crossing the nuclear cross section area (with radius of cell assumed to be 6.5 μm) for each time point to get foci per cell per track values. For each data point cells scored ranged from 50–300 in two independent replicates (n = 3). Statistical Significance (P < 0.05) was evaluated using Two-Tailed Unpaired T -test in Prism 6 software. P and T values for each comparison is listed on top of each graph.

References

    1. Bulanov SV, Esirkepov T, Khoroshkov VS, Kuznetsov AV, Pegoraro F. Oncological hadrontherapy with laser ion accelerators. Phys. Lett. Sect. A Gen. At. Solid State Phys. 2002;299:240–247.
    1. Malka V, et al. Practicability of protontherapy using compact laser systems. Med. Phys. 2004;31:1587–1592. doi: 10.1118/1.1747751. - DOI - PubMed
    1. Ledingham KWD, Galster W, Sauerbrey R. Laser-driven proton oncology-a unique new cancer therapy? Br. J. Radiol. 2007;80:855–8. doi: 10.1259/bjr/29504942. - DOI - PubMed
    1. Ledingham KWD, Bolton PR, Shikazono N, Ma C-MC. Towards laser driven hadron cancer radiotherapy: a review of progress. Appl. Sci. 2014;4:402–443. doi: 10.3390/app4030402. - DOI
    1. Macchi A, Borghesi M, Passoni M. Ion acceleration by superintense laser-plasma interaction. Rev. Mod. Phys. 2013;85:751–793. doi: 10.1103/RevModPhys.85.751. - DOI

Publication types

Substances