. 2019 Mar 14;9(1):4591.
doi: 10.1038/s41598-019-40997-6.

Scattering Assisted Imaging

Affiliations

Scattering Assisted Imaging

Marco Leonetti et al. Sci Rep. .

Abstract

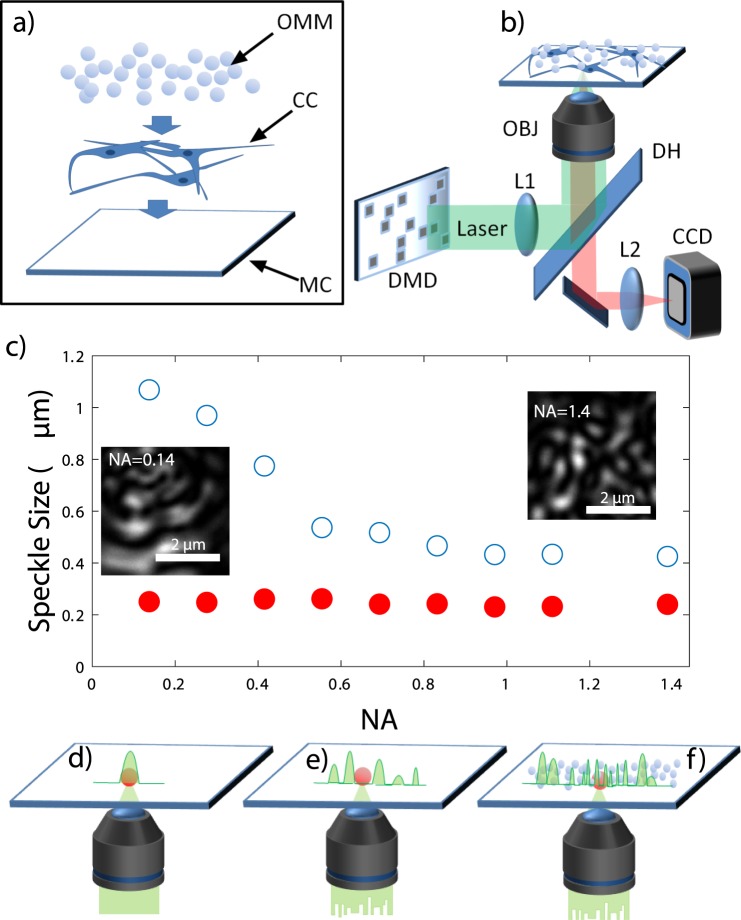
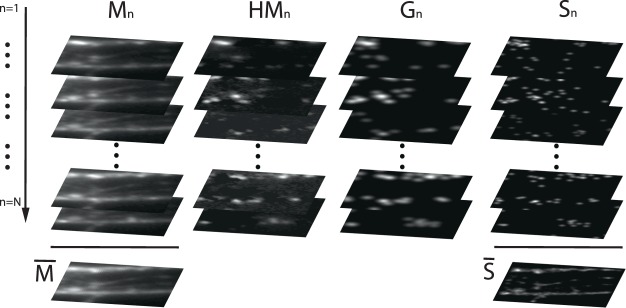
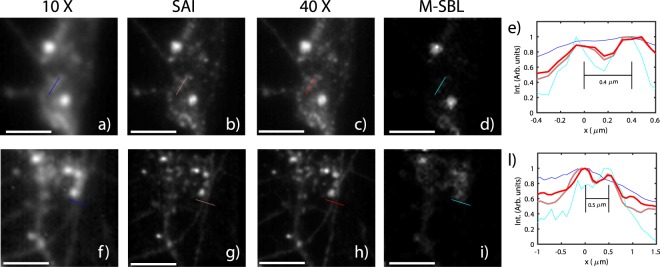
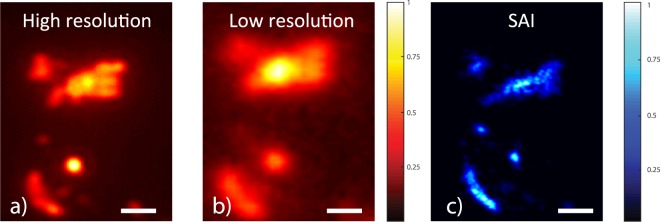
Standard imaging systems provide a spatial resolution that is ultimately dictated by the numerical aperture (NA) of the illumination and collection optics. In biological tissues, the resolution is strongly affected by scattering, which limits the penetration depth to a few tenths of microns. Here, we exploit the properties of speckle patterns embedded into a strongly scattering matrix to illuminate the sample at high spatial frequency content. Combining adaptive optics with a custom deconvolution algorithm, we obtain an increase in the transverse spatial resolution by a factor of 2.5 with respect to the natural diffraction limit. Our Scattering Assisted Imaging (SAI) provides an effective solution to increase the resolution when long working distance optics are needed, potentially paving the way to bulk imaging in turbid tissues.


Conflict of interest statement

The authors declare no competing interests.

Figures

Figure 1
Figure 1
(a) A sketch of the opaque mounting medium (OMM). CC: cell culture. MC: microscopy coverslip. (b) Experimental Setup. The wavefront of a laser beam (λ = 532 nm, laser waist 0.7 mm, divergence < than 0.5 mrad) is modulated by a digital micromirror device (DMD, 1024 × 768 micromirros, pixel size of 13 μm) to generate a speckled beam. The active area (50 × 50 micromirrors) of the DMD is imaged with a demagnification factor of 11 at the sample plane through a telescope composed by lens L1 (f = 200 mm) and the illumination/collection objective (OBJ). Fluorescent light from the sample is collected through a dichroic mirror (DH) and imaged on a CCD camera through a lens L2. (c) Measured speckle size as a function of the NA. Open circles are relative to a flat mirror sample. Full circles are relative to biological sample covered with the OMM. Panels (d–f) show three possible illuminations configurations. In a standard illumination (panel d), the focus spot size is defined by the illumination NA. In panel (e), the focal spot size is the same as (d) but the illumination is speckled due to the input scrambled wavefront. In (f), the speckle size is smaller than the objective PSF due to the presence of the OMM.
Figure 2
Figure 2
N fluorescence images (Mn) of a neuron culture stained with Tubulin (see methods) obtained with the illumination patterns In are shown in the first column on the left. Adding all contributions, we obtain the average frame M¯ (pile bottom). The high intensity part of the fluorescence frame is obtained by subtracting the average frame and considering the positive part of the result. HMn are reported in the second pile of frames. Applying our gradient descent algorithm, we obtained the Gn (shown in the third column from the left) by minimizing the cost function F. The frames shown in right column report the retrieved Sn. The high resolution image S¯ is obtained by averaging all the Sn.
Figure 3
Figure 3
Low resolution (NA = 0.25, nominal resolution R = 1.1 μm) fluorescence images obtained (a,f) obtained by averaging N = 600 fluorescent frames Mn. Images obtained with SAI (b,g) with N = 600. Representative images (g,h) obtained with a high numerical aperture objective (NA = 0.75, nominal resolution R = 360 μm). Representative images obtained with M-SBL reconstruction algorithms with the same N (d,i). Intensity profiles (e,l) along the indicated line profiles of the low fluorescence (blue), SAI (pink), M-SBL (cyan) and high NA (red) images. Scale bar is 3 μm in (a–d) and 6 μm in (f–i).
Figure 4
Figure 4
Images of amyloid plaques in a 250 μm brain slice obtained in a standard configuration with a high NA = 0.75 (a) and a low NA = 0.25 objective (b). (c) Reconstructed SAI image after deconvolution obtained with the low resolution objective lens. SAI resolution was measured to be 0.60 ± 0.04 μm against a theoretical resolution of 1.10 μm given by the objective. We note that despite a measured speckle size S of 350 nm, we retrieve a lower resolution due to the strong sample autofluorescence which is decreasing the effective signal to background ratio in the tissue. The bars are 2 μm

References

    1. Abbe E. Beiträge zur theorie des mikroskops und der mikroskopischen wahrnehmung. Arch. für mikroskopische Anat. 1873;9:413–418. doi: 10.1007/BF02956173. - DOI
    1. Rayleigh L. On the theory of optical images, with special reference to the microscope. J. Royal Microsc. Soc. 1903;23:474–482. doi: 10.1111/j.1365-2818.1903.tb04831.x. - DOI
    1. Sheng, P. Introduction to wave scattering, localization and mesoscopic phenomena, vol. 88 (Springer Science & Business Media, 2006).
    1. Bertolotti J, et al. Non-invasive imaging through opaque scattering layers. Nat. 2012;491:232. doi: 10.1038/nature11578. - DOI - PubMed
    1. Vellekoop IM, Lagendijk A, Mosk A. Exploiting disorder for perfect focusing. Nat. photonics. 2010;4:320–322. doi: 10.1038/nphoton.2010.3. - DOI

Publication types