. 2019 Mar 14;9(1):4572.
doi: 10.1038/s41598-019-41040-4.

Increased FUS levels in astrocytes leads to astrocyte and microglia activation and neuronal death

Affiliations

Increased FUS levels in astrocytes leads to astrocyte and microglia activation and neuronal death

Maria Antonietta Ajmone-Cat et al. Sci Rep. .

Abstract

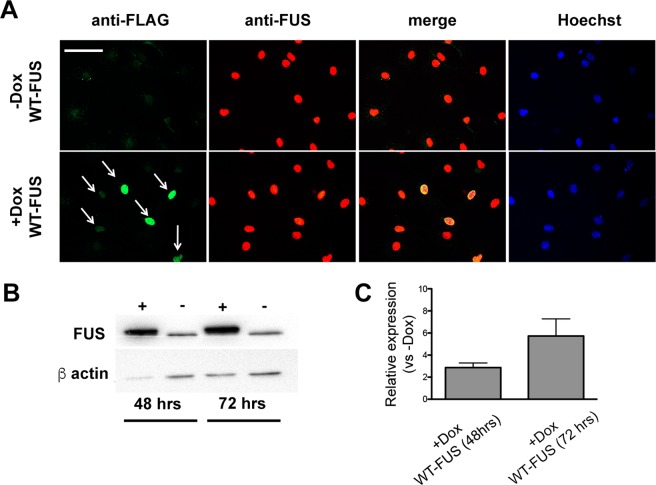
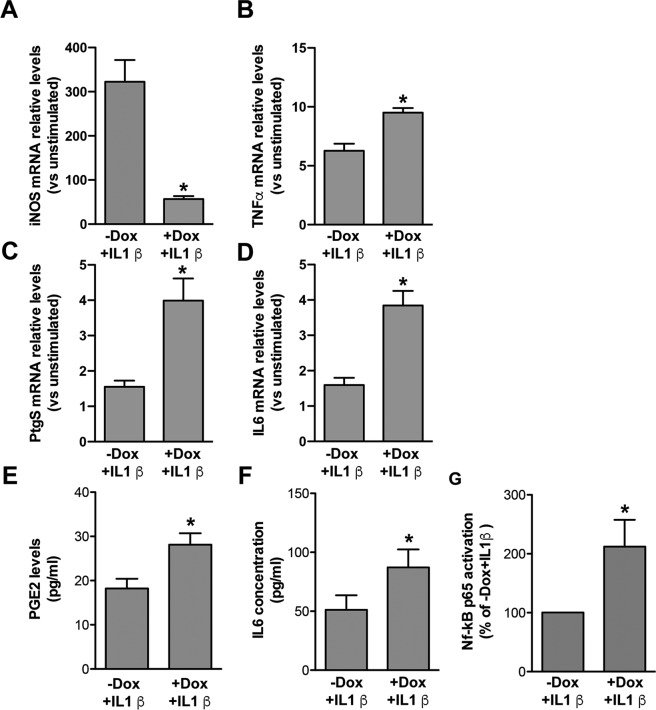
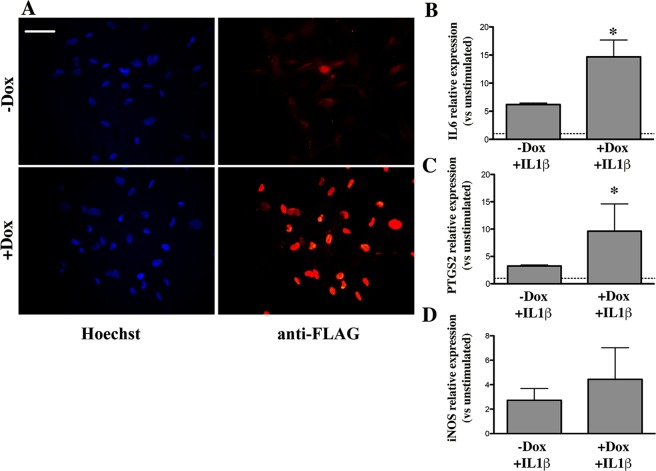
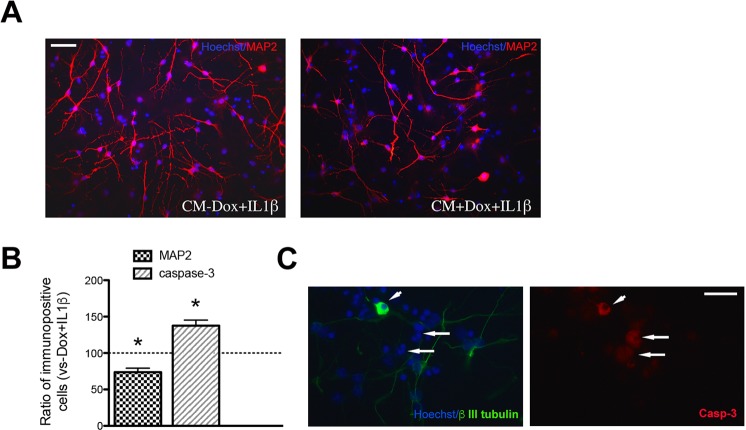
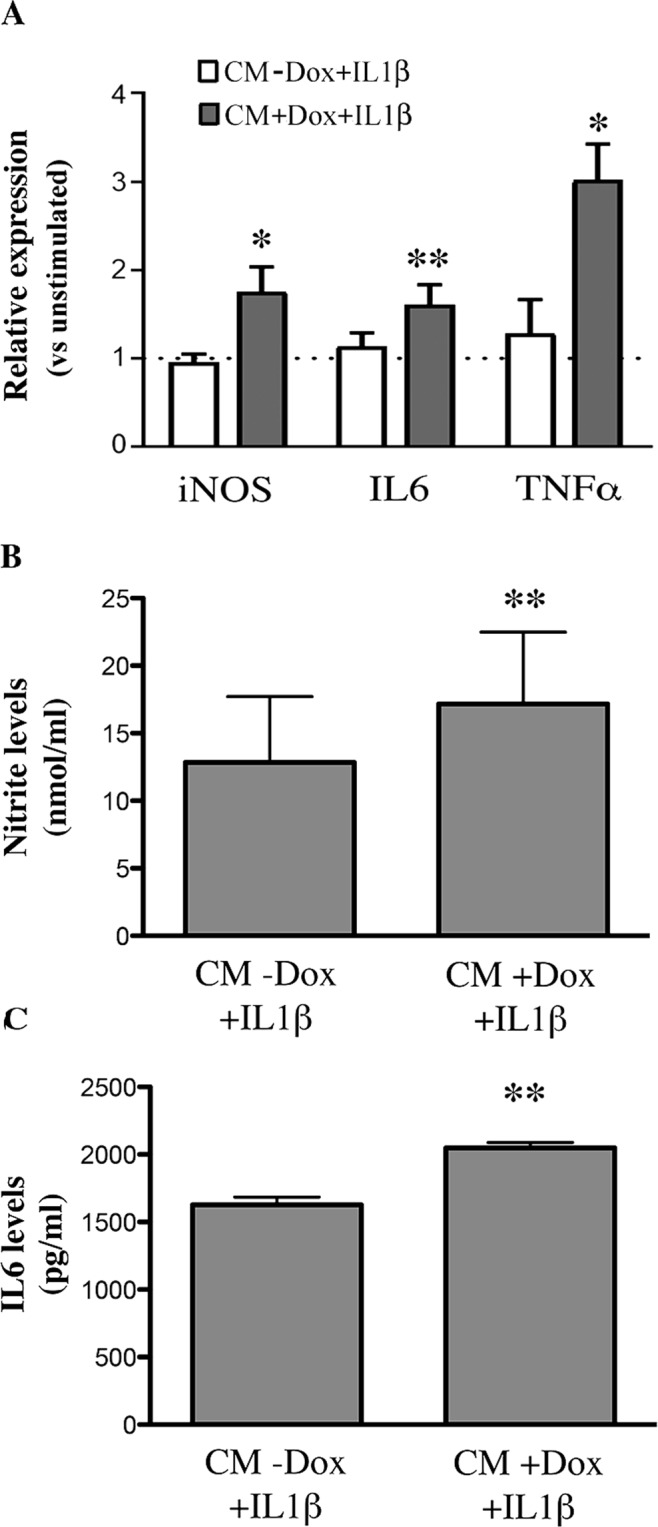
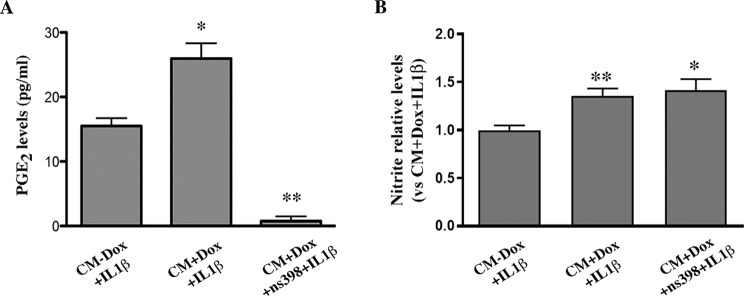
Mutations of Fused in sarcoma (FUS), a ribonucleoprotein involved in RNA metabolism, have been found associated with both familial and sporadic cases of amyotrophic lateral sclerosis (ALS). Notably, besides mutations in the coding sequence, also mutations into the 3' untranslated region, leading to increased levels of the wild-type protein, have been associated with neuronal death and ALS pathology, in ALS models and patients. The mechanistic link between altered FUS levels and ALS-related neurodegeneration is far to be elucidated, as well as the consequences of elevated FUS levels in the modulation of the inflammatory response sustained by glial cells, a well-recognized player in ALS progression. Here, we studied the effect of wild-type FUS overexpression on the responsiveness of mouse and human neural progenitor-derived astrocytes to a pro-inflammatory stimulus (IL1β) used to mimic an inflammatory environment. We found that astrocytes with increased FUS levels were more sensitive to IL1β, as shown by their enhanced expression of inflammatory genes, compared with control astrocytes. Moreover, astrocytes overexpressing FUS promoted neuronal cell death and pro-inflammatory microglia activation. We conclude that overexpression of wild-type FUS intrinsically affects astrocyte reactivity and drives their properties toward pro-inflammatory and neurotoxic functions, suggesting that a non-cell autonomous mechanism can support neurodegeneration in FUS-mutated animals and patients.


Conflict of interest statement

The authors declare no competing interests.

Figures

Figure 1
Figure 1
Expression of FUS in NP-derived astrocytes. mNPsc electroporated with plasmids allowing for the conditional expression of human WT-FUS were maintained for six days in the presence of astrocyte differentiation medium supplemented with or without doxycycline (Dox) and then fixed and stained. (A) Exogenous FUS, identified by an anti-FLAG antibody, was localized in the nucleus (WT-FUS) only in cells exposed to Dox. Similar staining profile was obtained by using an antibody recognizing both endogenous and the exogenous FUS (anti-FUS antibody). Scale bar 30 μm. (B,C) Representative blot and quantification of relative FUS levels at 48 and 72 hrs upon doxycycline stimulation. The bar graph shows a significant increase of FUS expression in induced cells (+Dox) compared to control cells (−Dox). The band observed in the lanes −Dox reflects endogenous FUS expression. Values are expressed as the mean of two independent experiments. FUS levels are normalized with respect to β-actin.
Figure 2
Figure 2
Regulation of inflammatory genes and related proteins/metabolites in IL1β-activated murine WT-FUS overexpressing astrocytes and relative controls, and determination of NF-kB p65 activation. (A–D) RT PCR analyses of iNOS (A), TNFα (Β), PTGS2 (C) and IL6 (D) mRNA expression upon IL1β stimulation in cultures treated or not with Dox, relative to unstimulated cells (−Dox − IL1β). Data show that TNFα (Β), PTGS2 (C) and IL6 (D) mRNA relative expression upon IL1β stimulation is higher, and that of iNOS (A) lower, in cells overexpressing WT-FUS (+Dox + IL1β), compared to non-overexpressing cells (−Dox + IL1β). Data are means ± SEM, n = 3–6, *P < 0.05 vs. −Dox + IL1β. (E,F) PGE2 and IL6 were quantified by EIA and ELISA assays, respectively, in the conditioned media collected from astrocyte-like cells differentiated in the presence or in the absence of Dox for 6 days and stimulated in the last 24 hrs with IL1β. In accordance with gene expression data, PGE2 and IL6 levels were higher in cells overexpressing WT-FUS (+Dox + IL1β) than in non-overexpressing cells (−Dox + IL1β). Data are means ± SEM, n = 3, *P < 0.05 and **P < 0.005 vs. −Dox + IL1β; (G) NF-kB p65 activation, assessed by NFkB p65 ELISA-based kit on whole cell lysates, was increased in astrocyte-like cells overexpressing WT-FUS and treated with IL1β for 45 min before collection (+Dox + IL1β). Data are expressed as the percentage of activation respect to control cells (−Dox + IL1β) and are means ± SEM, n = 5, *P < 0.05.
Figure 3
Figure 3
Expression of selected inflammatory genes in human NP-derived astrocytes. hNPsc were differentiated for six days with BMP-4, in the presence or in the absence of doxycycline (Dox) and stimulated in the last 24 hrs with IL1β. (A) Example of cultures processed for immunofluorescence and stained with an antibody directed versus the FLAG sequence of human WT-FUS (red) as a control of the efficient induction of transgene expression; in blue are Hoechst-stained nuclei. Scale bar 30 μm. (B–D) IL6, PTGS2 and iNOS mRNA relative levels were determined by RT-PCR in cells overexpressing FUS (+Dox + IL1β) or with normal levels of FUS (−Dox + IL1β). Data are expressed as fold change in gene expression, normalized to an endogenous gene (β-actin), and relative to cells that were not stimulated with IL1β (−Dox − IL1β), taken as 1. Data are means ± SEM, n = 3, *P < 0.05.
Figure 4
Figure 4
Effects of conditioned media obtained from mouse NP-derived astrocyte-like cells on neuronal cell number and cell death. Non transgenic mNPsc were pre-differentiated for 10 days and then exposed for additional five days to CMs obtained from astrocyte-like cells (CM + Dox + IL1β or CM − Dox + IL1β). (A) Representative microphotographic fields showing neuronal cells stained with an anti-MAP2 antibody. Scale bar 30 μm. (B) Neuronal and activated Caspase-3 positive cell quantification. The percentage of MAP2 positive neuronal cells was reduced in cultures treated with CM + Dox + IL1β compared with CM − Dox + IL1β treated cultures; data are means ± SEM, n = 3, *P < 0.005 (paired Student’s T test). Immunocytochemical detection of activated Caspase-3 showed that CM + Dox + IL1β increased cell death compared to CM − Dox + IL1β after three days of treatment. Quantification of Caspase-3 stained cells is given in the bar graph, and expressed with respect to CM − Dox + IL1β; data are means ± SEM, n = 3, *P < 0.0005. (C) Representative image showing cells immunostained for βIII tubulin (green) and Casp-3 (red). The arrowhead indicates a neuronal cell expressing activated Casp-3. Note also the presence of Casp-3 positive cells not expressing βIII tubulin (arrows). Scale bar 30 μm).
Figure 5
Figure 5
Upregulation of pro-inflammatory genes in microglia exposed to the CMs from transgenic mNPsc-derived astrocytes stimulated with IL1β. (A) RT-PCR analysis of the relative mRNA levels of iNOS, IL6 and TNFα, in microglial cultures incubated for 24 hrs with the CMs of astrocyte-like cells, overexpressing FUS and stimulated with 10 ng/ml IL1β (CM + Dox + IL1β) or the CMs from non-overexpressing cells (CM − Dox + IL1β). Data, analyzed by the 2−ΔΔCt method using HPRT as the normalizing gene, are expressed as fold change vs unstimulated microglia, and are the means ± SEM, n = 4; *P < 0.05, **P < 0.005 for CM + Dox + IL1β vs CM − Dox + IL1β; paired Student’s T test. (B,C) Nitrite and IL6 levels accumulated after 24 hrs in the medium of microglia treated with the CMs of astrocyte-like cells overexpressing or not FUS, and activated with IL1β as above (CM + Dox + IL1β and CM − Dox + IL1β). The CMs from FUS transgenic astrocytes induced higher release of both metabolites by microglia, consistently with the mRNA data. Data are the means ± SEM, n = 6; **P < 0.005.
Figure 6
Figure 6
PTGS2 inhibition by NS-398 in transgenic astrocyte-like cells does not alter their capability to stimulate microglial activation. (A) mNPsc-derived astrocytes overexpressing FUS and treated for 24 hrs with 10 ng/ml IL1β in the presence of the selective PTGS2 inhibitor NS-398 (10 μM), produced negligible amounts of PGE2, compared to non-inhibited cells, as assessed by EIA analysis. Data are means ± SEM, n = 3; *P < 0.05. (B) Nitrite levels in the medium of microglia exposed to CMs from FUS overexpressing cells treated with 10 ng/ml IL1β in the presence of NS-398 (CM + Dox + IL1β + NS-398) were comparable to the levels induced by the CMs from non-inhibited astrocytes (CM + Dox + IL1β). Data are expressed as the fold increase versus nitrite levels produced by microglia exposed to CMs from non transgenic astrocytes (CM − Dox + IL1β), and are means ± SEM, n = 3.

References

    1. Ederle H, Dormann D. TDP-43 and FUS en route from the nucleus to the cytoplasm. FEBS Lett. 2017;591:1489–1507. doi: 10.1002/1873-3468.12646. - DOI - PubMed
    1. Lagier-Tourenne C, et al. Divergent roles of ALS-linked proteins FUS/TLS and TDP-43 intersect in processing long pre-mRNAs. Nat Neurosci. 2012;15:1488–1497. doi: 10.1038/nn.3230. - DOI - PMC - PubMed
    1. Errichelli L, et al. FUS affects circular RNA expression in murine embryonic stem cell-derived motor neurons. Nat Commun. 2017;8:14741. doi: 10.1038/ncomms14741. - DOI - PMC - PubMed
    1. Kwiatkowski TJ, Jr., et al. Mutations in the FUS/TLS gene on chromosome 16 cause familial amyotrophic lateral sclerosis. Science. 2009;323:1205–1208. doi: 10.1126/science.1166066. - DOI - PubMed
    1. Renton AE, Chio A, Traynor BJ. State of play in amyotrophic lateral sclerosis genetics. Nat Neurosci. 2014;17:17–23. doi: 10.1038/nn.3584. - DOI - PMC - PubMed

Publication types