. 2019 Mar 14;9(1):4540.
doi: 10.1038/s41598-019-41169-2.

Transcriptomic and lipidomic analysis of an EPA-containing Nannochloropsis sp. PJ12 in response to nitrogen deprivation

Affiliations

Transcriptomic and lipidomic analysis of an EPA-containing Nannochloropsis sp. PJ12 in response to nitrogen deprivation

Jibei Liang et al. Sci Rep. .

Abstract

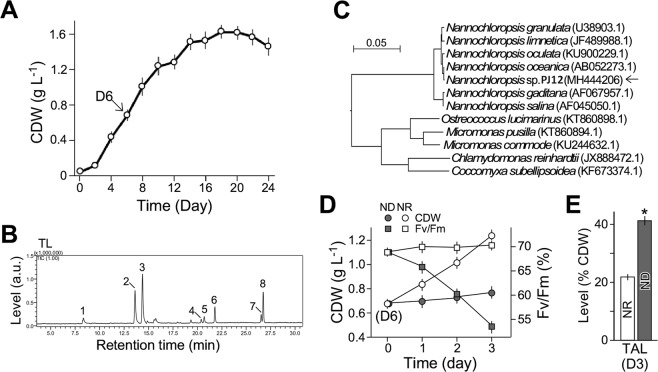
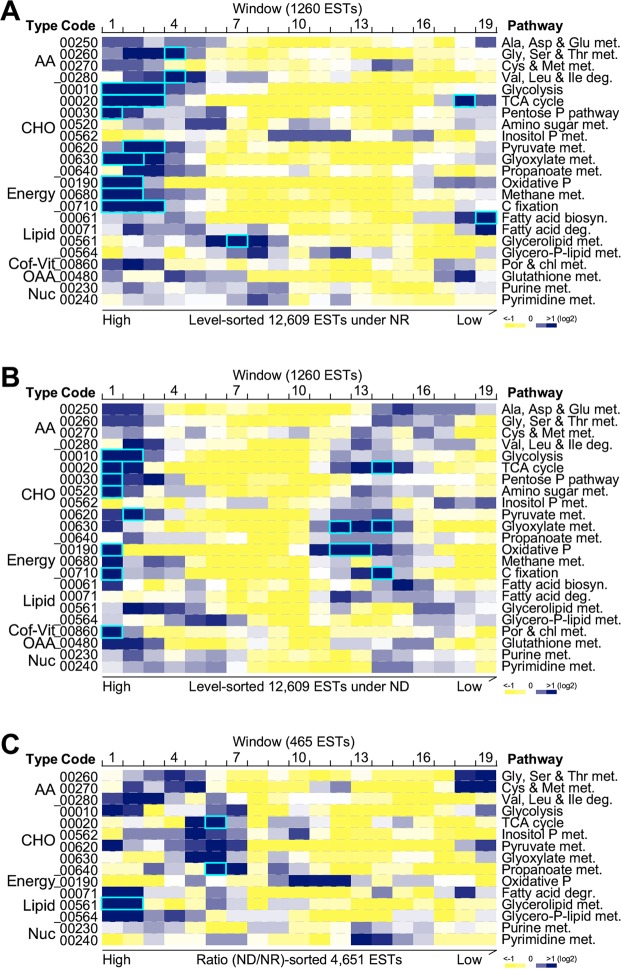
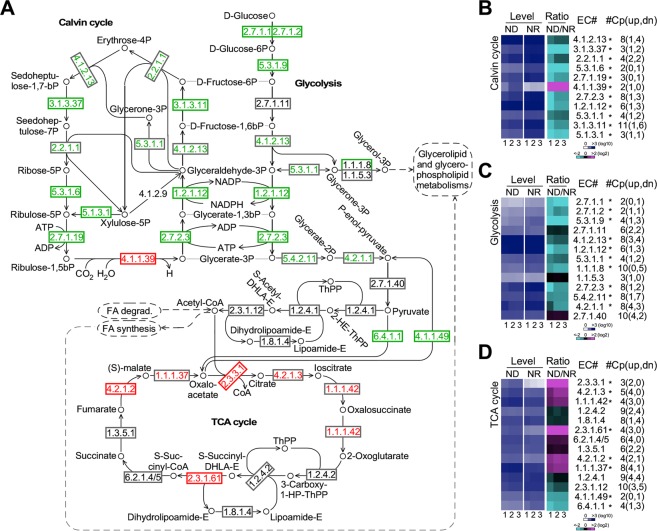
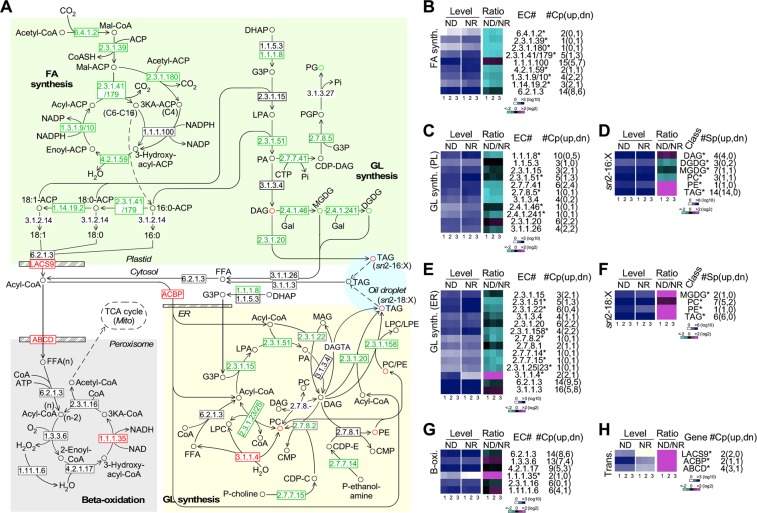
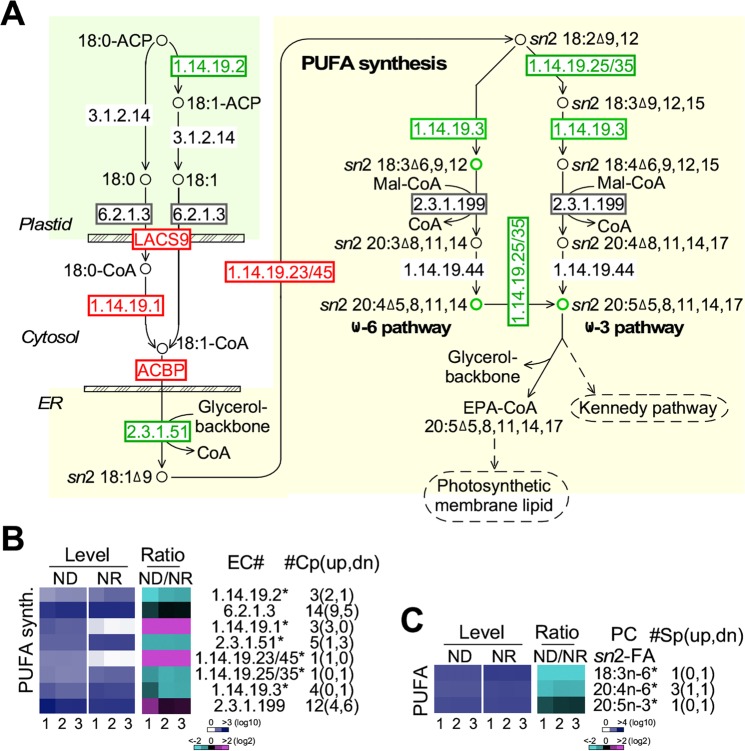
To understand genes involved in neutral lipid accumulation upon nitrogen deprivation (ND) in a novel isolate of Nannochloropsis sp. PJ12, we performed comparative transcriptomic and lipidomic analyses of cells under ND and NR (nitrogen replete) conditions. Transcriptomic profiling indicated that, while enzymes involved in TCA cycle in PJ12 under ND condition were upregulated compared to that under NR condition, those involved in Calvin cycle and glycolysis under ND condition were downregulated. Furthermore, we showed that enzymes involved in fatty acid synthesis and glycerolipid synthesis were downregulated but not β-oxidation. Lipidomic profiling indicated that, while the level of neutral lipids in ND cells was increased compared to that of NR cells, level of photosynthetic membrane-lipids DGDG and PG was decreased. Taken together, our analysis indicated that TAG accumulation is attributed to the modification of membrane lipids derived primarily from "prokaryotic" pathway and secondarily from "eukaryotic" pathway based on the 16:X or 18:X fatty acid at the sn2 position of the glycerol backbone. We propose that two-phase (NR-ND) growth is ideal for biomass and biofuel production because ND reduces cell growth rate due to the loss of photosynthetic membrane and decreased quantum yield.


Conflict of interest statement

The authors declare no competing interests.

Figures

Figure 1
Figure 1
Characterization of a novel isolate Nannochloropsis sp. PJ12. (A) Growth curve analysis. X- and Y-axes indicate time (day) and cell dry weight (CDW, g L−1), respectively. Cell samples at day 6 as indicated were used for medium shift analysis. Average and standard deviation based on three repeats are shown. (B) Analysis of total lipids as fatty acid methyl esters (FAME) in cells under NR condition. Numbered fatty acids are described in text. (C) DNA-sequence-based phylogenetic tree analysis of Nannochloropsis sp. PJ12. Arrow indicates the position of PJ12. (D) Cell growth and photosynthetic yield (Fv/Fm) after medium shift to fresh nitrogen-depleted (ND) and nitrogen-replete (NR) media (n = 3). (E) Level of total lipids based on gravimetric analysis. Asterisk indicates the significant differences between levels in ND and NR cells (n = 3).
Figure 2
Figure 2
Cell mass density, size, and acyl-lipid level in PJ12 cells under ND and NR conditions. (A) Cell mass density based on step-wise sucrose gradient analysis. (B) Transmission electron microscopic analysis of ND and NR cells. LD and Chl indicate lipid droplet and chloroplast, respectively. One micrometer scale is indicated. (C) Cell sizes under ND and NR conditions. (D) Levels of acyl-lipids as FAMEs from a unit of cell dry mass under ND and NR conditions (n = 3). (E) Thin-layer chromatographic (TLC) analysis of total lipids under ND and NR condition. Position of triacylglycerol (TAG) is indicated. (F) Analysis of acyl-lipids from TAG as FAME in cells under ND condition. Numbered fatty acids are identical to Fig. 1B.
Figure 3
Figure 3
Lipidomic profiling of PJ12 cells under ND and NR conditions. (A) Comparison between lipidomic profiles between ND and NR conditions. Heat-map shows the level (mole of molecules based on peak area divided by MC per million cells under ND and NR condition) and ratio (ND level/NR level) of individual lipid molecules. Ion mode (Mode) and lipid class (Class) are also shown. Level and ratio of individual molecules are shown in blue-white (from high to low in log 10 scale) and magenta-black-cyan (from increase to unchanged and to decrease in log 2 scale) color schemes, respectively. Repeated experiments and scale bars are shown at the bottom. Asterisk (*) indicates the significant difference of lipid levels between ND and NR conditions (level change > 1.5-fold, p-value < 0.05). (B) Comparison of lipid classes between ND and NR conditions. The display is identical to (A). Asterisk (*) indicates significantly difference between ND and NR (level change > 1.2-fold, p-value < 0.05). (C) Bar-plot shows the level of DGDG lipids under ND and NR conditions. Photosynthetic membrane lipids (DGDG and MGDG) denoted with alphabetic letter can be traced in neutral lipids (DAG and TAG). Bar-plots (D–I) show the level of MGDG, PG, DAG, TAG, PC, and PE lipids under ND and NR conditions, respectively.
Figure 4
Figure 4
Pathway-based functional analysis of transcriptional profiles under NR and ND conditions. (A) Enrichment of pathway-associated ESTs at various levels based on rank under NR condition. Heat-map showing the occurrence frequency of ESTs associated with various metabolic pathways indicated. Blue-white-yellow color key is indicated as the ratio of occurrence increased, unchanged, and decreased at the bottom. Function enriched windows are highlighted with cyan-colored rectangles. (B) Enrichment of pathway-associated ESTs at various levels based on rank under ND condition. The display is identical to (A). (C) Enrichment of pathway-associated ESTs at various ratio (ND/NR) based on rank. The display is identical to (A).
Figure 5
Figure 5
Differential transcriptions of enzymes involved in Calvin cycle, glycolysis, TCA cycle under ND and NR conditions. (A) Schematic pathways showing Calvin cycle, glycolysis, TCA cycle. EC number of enzymes and metabolites are indicated. Transcriptionally increased and decreased enzymes based on the sum of isoforms are indicated in red and green, respectively. Enzymes without significant change are indicated in black. Enzymes not found in this analysis are shown without box. (B) Transcription profiles of enzymes involved in Calvin cycle. Heat-maps indicate transcription levels of enzymes (sum of all copies of genes if exists) involved in Calvin cycle under ND and NR conditions (blue-white scheme) and ratio of ND/NR (magenta-black-cyan scheme). EC number (EC#) is shown. Asterisk (*) indicates the significant change (level change > 1.5-fold, p-value < 0.05) based on the sum of all isoform levels. Total copy number of genes (#Cp) and number of upregulated (up) and downregulated (dn) individual genes in parentheses are shown. Repeat experiments and color keys are indicated at the bottom. (C,D) Transcription profiles of enzymes involved in glycolysis and TCA cycle, respectively. The display is identical to (B).
Figure 6
Figure 6
Differential transcriptions of enzymes involved in fatty acid, photosynthetic membrane lipid, and triacylglycerol synthesis and beta-oxidation under ND and NR conditions. (A) Schematic pathways showing fatty acid (FA) synthesis, glycerolipid (GL) synthesis in the plastid (PL) and in the ER, beta-oxidation, and acyl-CoA transport. Metabolite whose level increased and decreased are shown in red and green, respectively. The display is identical to Fig. 3 (A). (B,C) Transcription profiles of enzymes involved in fatty acid (FA) synthesis and glycerolipid (GL) synthesis in the plastid (PL). The display is identical to Fig. 5B. (D) Profiles of “prokaryotic” pathway-synthesized lipids. Heat-maps indicate levels of lipid class containing C16:X at sn2 position of the glycerol backbone under ND and NR conditions (blue-white scheme) and ratio of ND/NR (magenta-black-cyan scheme). Lipid class (Class) is shown. Asterisk (*) indicates the significant level change (level change > 1.25-fold, p-value < 0.05) based on the sum of all lipid species in a lipid class. Total number of lipid species (#Sp) and number of upregulated (up) and downregulated (dn) individual species in parentheses are shown. Repeat experiments and color keys are indicated at the bottom. (E) Transcription profiles of enzymes involved in glycerolipid (GL) synthesis in the ER. The display is identical to 5B. (F) Profiles of “eukaryotic” pathway-synthesized lipids. The display is identical to (D). (G,H) Transcription profiles of enzymes involved in β-oxidation and acyl-CoA transport. The display is identical to Fig. 5B.
Figure 7
Figure 7
Differential transcriptions of enzymes involved in polyunsaturated fatty acid (PUFA) synthesis under ND and NR conditions. (A) Schematic pathways showing polyunsaturated fatty acid (FA) synthesis. The display is identical to Fig. 6A. (B) Transcription profiles of enzymes involved in polyunsaturated fatty acid (FA) synthesis. The display is identical to Fig. 5B. (C) Level changes of PUFA in PC at the sn2 position of the glycerol backbone. The display is identical to Fig. 6D.

References

    1. Fawley KP, Fawley MW. Observations on the Diversity and Ecology of Freshwater Nannochloropsis (Eustigmatophyceae), with Descriptions of New Taxa. Protist. 2007;158:325–336. doi: 10.1016/j.protis.2007.03.003. - DOI - PubMed
    1. Gouveia L, Oliveira AC. Microalgae as a raw material for biofuels production. J Ind Microbiol Biotechnol. 2009;36:269–274. doi: 10.1007/s10295-008-0495-6. - DOI - PubMed
    1. Rodolfi L, et al. Microalgae for oil: strain selection, induction of lipid synthesis and out door mass cultivation in a low-cost protobioreactor. Biotechnol Bioeng. 2009;102:100–112. doi: 10.1002/bit.22033. - DOI - PubMed
    1. Sukenik A, Carmeli Y, Berner T. Regulation of fatty acid composition by irradiance level in the Eustigmatophyte Nannochloropsis sp. Journal of Phycology. 1989;25:686–692. doi: 10.1111/j.0022-3646.1989.00686.x. - DOI
    1. Boussiba S, Vonshak A, Cohen Z, Avissar Y, Richmond A. Lipid and biomass production by the halotolerant microalga Nannochloropsis salina. Biomass. 1987;12:37–47. doi: 10.1016/0144-4565(87)90006-0. - DOI

Publication types