. 2019 Feb 27:13:77.
doi: 10.3389/fnins.2019.00077. eCollection 2019.

Age-Related Hearing Loss Is Accelerated by Repeated Short-Duration Loud Sound Stimulation

Affiliations

Age-Related Hearing Loss Is Accelerated by Repeated Short-Duration Loud Sound Stimulation

Juan Carlos Alvarado et al. Front Neurosci. .

Abstract

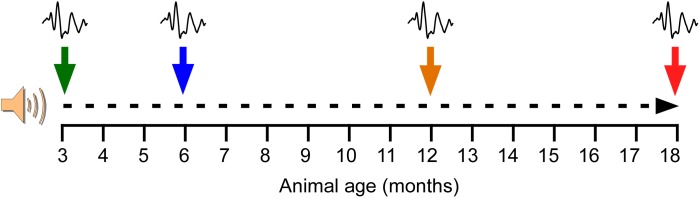
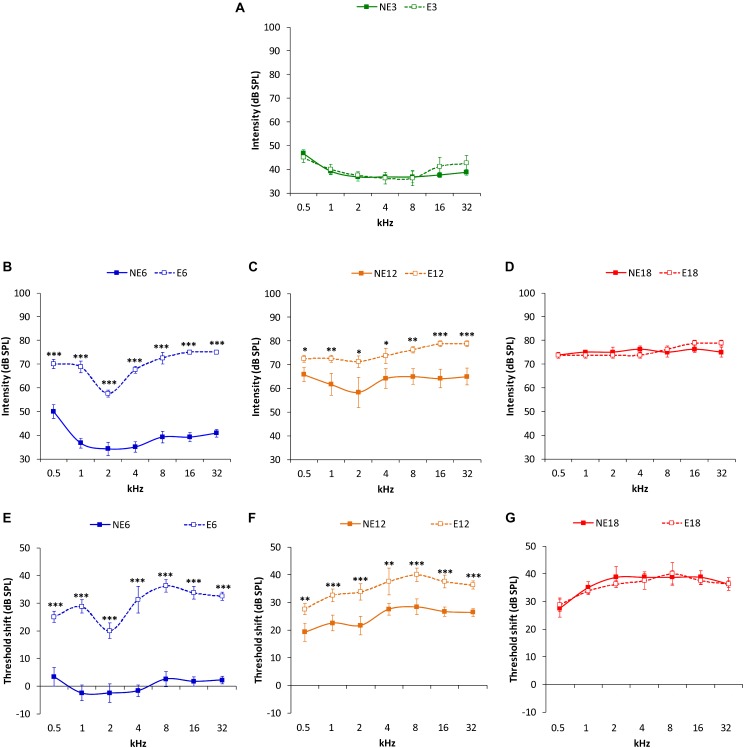
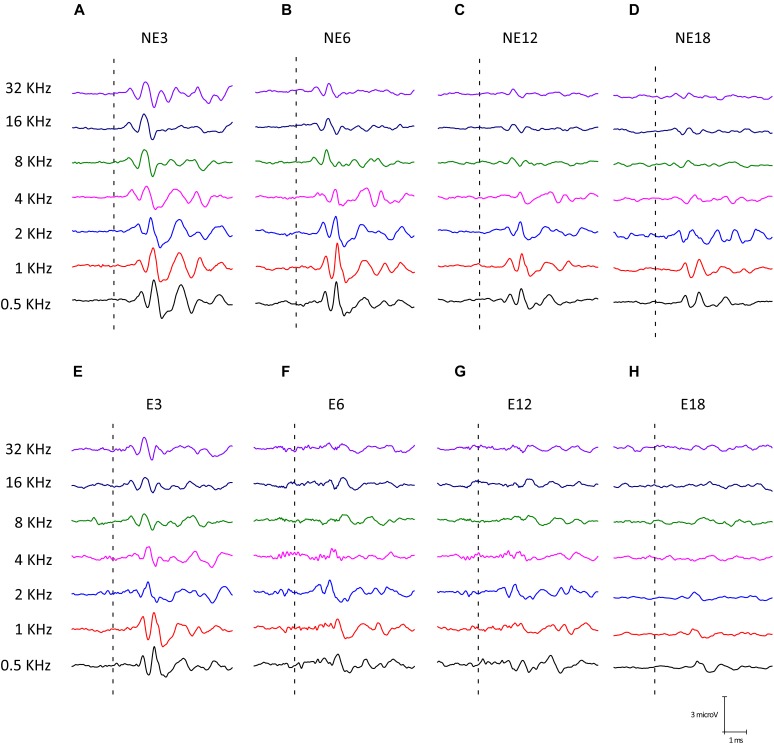
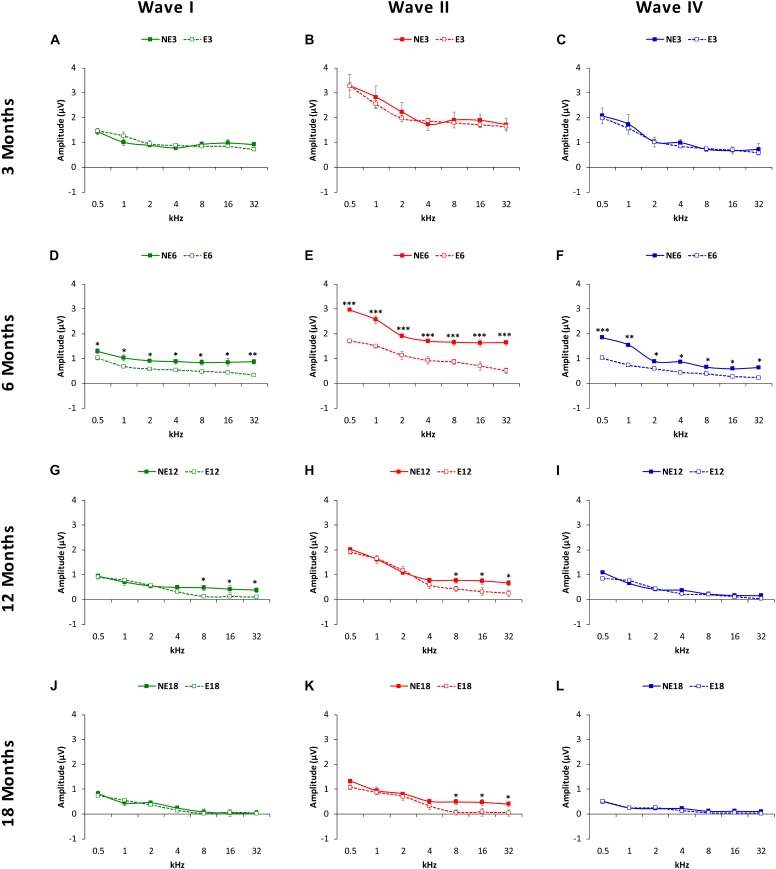
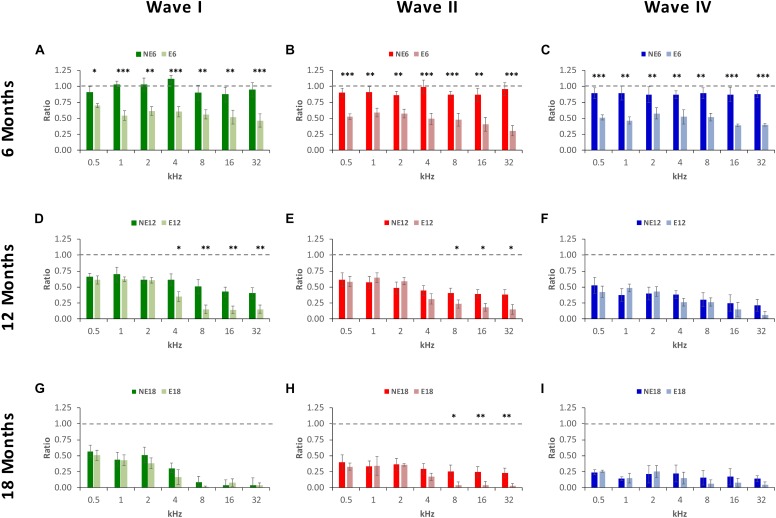
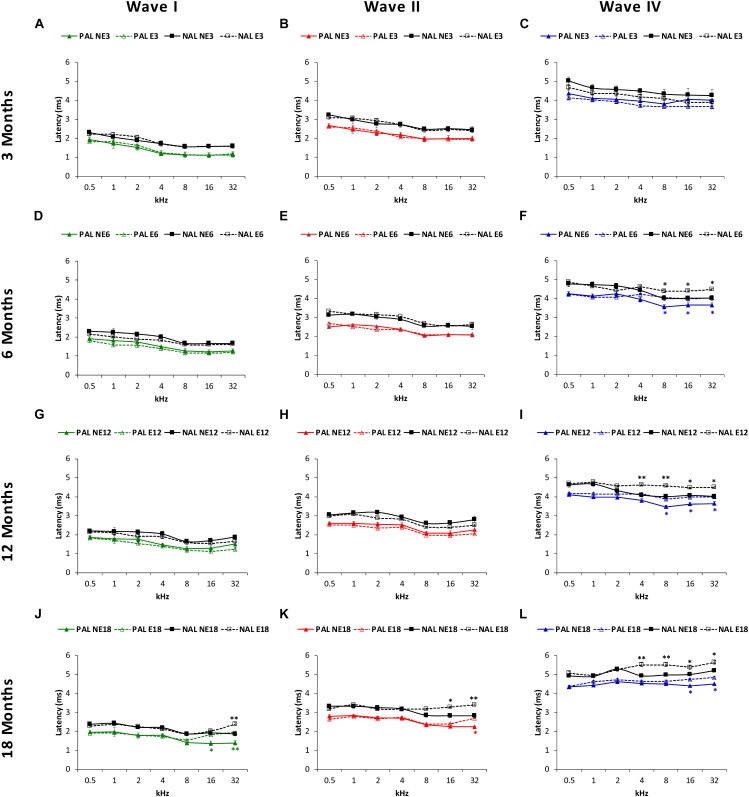
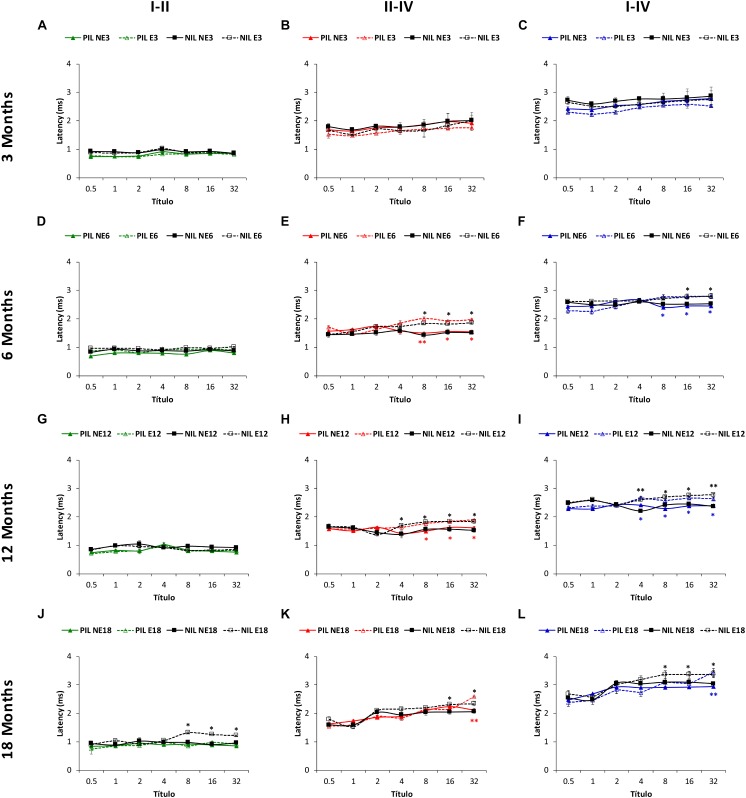
Both age-related hearing loss (ARHL) and noise-induced hearing loss (NIHL) may share pathophysiological mechanisms in that they are associated with excess free radical formation and cochlear blood flow reduction, leading to cochlear damage. Therefore, it is possible that short, but repeated exposures to relatively loud noise during extended time periods, like in leisure (i.e., musical devices and concerts) or occupational noise exposures, may add to cochlear aging mechanisms, having an impact on the onset and/or progression of ARHL. Consequently, the aim of the present study was to determine if repeated short-duration overexposure to a long-term noise could accelerate permanent auditory threshold shifts associated with auditory aging in an animal model of ARHL. Toward this goal, young adult, 3-month-old Wistar rats were divided into two groups: one exposed (E) and the other non-exposed (NE) to noise overstimulation. The stimulation protocol consisted of 1 h continuous white noise at 110 dB sound pressure level (SPL), 5 days a week, allowing 2 days for threshold recovery before initiating another stimulation round, until the animals reached an age of 18 months. Auditory brainstem response (ABR) recordings at 0.5, 1, 2, 4, 8, 16, and 32 kHz were performed at 3, 6, 12, and 18 months of age. The results demonstrate that in the E group there were significant increases in auditory thresholds at all tested frequencies starting already at 6 months of age, which extended at 12 and 18 months. However, in NE animals threshold shifts were not evident until 12 months, extending to 18 months of age. Threshold shifts observed in the E animals at 6 and 12 months were significantly larger than those observed in the NE group at the same ages. Threshold shifts at 6 and 12 months in E animals resembled those at 12 and 18 months in NE animals, respectively. This suggests that repeated noise overstimulation in short-duration episodes accelerates the time-course of hearing loss in this animal model of ARHL.

Keywords: auditory brainstem responses; evoked potentials; noise-induced hearing loss; presbycusis; sensorineural hearing loss.


Figures

FIGURE 1
FIGURE 1
Noise overstimulation protocol. Following the baseline ABR recordings prior to any noise exposure at the age of 3 months, the noise exposure sessions began. The noise overstimulation protocol consisted of a continuous white noise (110 dB SPL) for 1 h a day for 5 days, with 2 days of recovery before initiating the next stimulation round, until the animals reached 18 months. Additional ABR recordings were performed at 6, 12, and 18 months of age. At these time-points, the recordings in the exposed animals were performed after the 2 days of recovery and right before initiating the corresponding round of 5 days of noise overstimulation.
FIGURE 2
FIGURE 2
Line graphs illustrating auditory thresholds and threshold shifts at the different frequencies evaluated in NE and E rats at 3, 6, 12, and 18 months. In both NE3 and E3 animals, previous any noise exposure, the mean values of the auditory thresholds were similar (A). At 6 months, the auditory thresholds (B) and the threshold shifts (E) in E6 rats were significantly higher than those found in the NE6 rats. Although, auditory thresholds (C) and threshold shifts (F) were elevated in both NE12 and E12 groups, these values were still statistically significantly higher in the E12 rats when compared to NE12 animals. At 18 months of age, no significant differences were detected between noise exposed and non-exposed rats (D,G). p < 0.05, ∗∗p < 0.01, ∗∗∗p < 0.001.
FIGURE 3
FIGURE 3
Examples of ABR waveforms from NE (A–D) and E (E–H) rats at all ages and frequencies evaluated. The NE3 (A), NE6 (B), and E3 © animals, previous any noise exposure, showed typical waveform patterns which consisted of 4 to 5 evoked waves after stimulus onset. At 12 (C) and 18 (D) months of age, NE rats had an age-related decrease in wave amplitudes at all frequencies. However, in the exposed animals such a reduction was already apparent at 6 months (F) and it was more evident at 12 (G) and 18 (H) months of age for the higher frequencies when compared to NE rats.
FIGURE 4
FIGURE 4
Line graphs illustrating wave amplitudes (in μV), as a function of the frequencies evaluated in NE (solid lines) and E (dashed lines) animals at 3, 6, 8, and 18 months of age. At 3 months (A–C), previous any noise exposure, the mean values of waves I, II and IV (the largest in the ABRs) were similar in both groups, while in 6-month-old rats (D–F), the mean amplitudes of all waves in the exposed animals at all frequencies were significantly reduced when compared to non-exposed rats. At 12 months (G–I), while there was a decrease in the mean amplitudes of all waves in both exposed and non-exposed rats, waves I (G) and II (H) at the highest frequencies (H) in the E group were still smaller than those observed in NE animals. No differences were observed in wave IV (I). At 18 months, whereas no differences were observed between groups in the waves I (J) and IV (L), the mean values in wave II in the E group remained reduced at the highest frequencies (K). p < 0.05, ∗∗p < 0.01, ∗∗∗p < 0.001.
FIGURE 5
FIGURE 5
Bar graphs illustrating wave amplitude ratios in noise-exposed animals at 6, 12, and 18 months of age relative to the control condition. In 6-month-old exposed animals, (A–C), wave amplitude ratios for all waves and at all frequencies were significantly smaller when compared to the non-exposed rats. At 12 months, while ratios decreased in both NE and E groups, in E animals the mean values were still significantly reduced at the highest frequencies for waves I (D) and II (E), but not for wave IV (F). In the oldest animals (G–I), the mean values remained reduced in both groups and significant differences were observed only in wave II (H) at 8, 16, and 32 kHz. p < 0.05, ∗∗p < 0.01, ∗∗∗p < 0.001.
FIGURE 6
FIGURE 6
Line graphs depicting the absolute positive (colored lines) and negative (black lines) latency times (ms) of waves I, II, and IV, as a function of frequency in NE and E rats. At 3 months (A–C) in both NE and E animals, previous any noise exposure, the mean values for the absolute latencies in waves I, II, and IV were similar to those previously reported. At 6 and 12 months in the exposed rats these values were significantly longer at the highest frequencies for wave IV (F,I), but not for wave I (D,G) or II (E,H). In 18-month-old rats, a significant lengthening of latency times was detected in the exposed animals for waves I (J), II (K), and IV (L) also at the highest frequencies. PAL, Positive Absolute Latencies; NAL, Negative Absolute Latencies, p < 0.05, ∗∗p < 0.01.
FIGURE 7
FIGURE 7
Line graphs illustrating the interpeak positive (colored lines) and negative (black lines) latency times (ms) plotted as a function of frequency in non-exposed and exposed rats. In the 3-month-old group, previous any noise exposure, there were no differences between E and NE groups in any of the interpeak positive latencies evaluated (A–C). However, there was a significant effect of sound stimulation and age on the interpeak positive latency times at 6 (D–F), 12 (G–I), and 18 (J–L) months. Accordingly, in the I-II interpeak positive latency times whereas no differences were observed between NE and E rats, longer negative latencies in the exposed animals were detected at the highest frequencies in 18-month-old (D–J) animals. In the II-IV (E,H,K) and I-IV (F,I,L) interpeak latencies, longer times were detected in the exposed animals at the highest frequencies at 6, 12, and 18 months when compared to non-exposed rats. PIL, Positive Interpeak Latencies; NAL, Negative Interpeak Latencies, p < 0.05, ∗∗p < 0.01.

References

    1. Alvarado J. C., Fuentes-Santamaría V., Gabaldón-Ull M. C., Blanco J. L., Juiz J. M. (2014). Wistar rats: a forgotten model of age-related hearing loss. Front. Aging Neurosci. 6:29. 10.3389/fnagi.2014.00029 - DOI - PMC - PubMed
    1. Alvarado J. C., Fuentes-Santamaría V., Gabaldón-Ull M. C., Jareño-Flores T., Miller J. M., Juiz J. M. (2016). Noise-induced “Toughening” effect in wistar rats: enhanced auditory brainstem responses are related to calretinin and nitric oxide synthase upregulation. Front. Neuroanat. 10:19 10.3389/fnana.2016.00019 - DOI - PMC - PubMed
    1. Alvarado J. C., Fuentes-Santamaría V., Gabaldón-Ull M. C., Juiz J. M. (2018). An oral combination of vitamins A, C, E, and Mg++ improves auditory thresholds in age-related hearing loss. Front. Neurosci. 12:527. 10.3389/fnins.2018.00527 - DOI - PMC - PubMed
    1. Alvarado J. C., Fuentes-Santamaría V., Jareño-Flores T., Blanco J. L., Juiz J. M. (2012). Normal variations in the morphology of auditory brainstem response (ABR) waveforms: a study in wistar rats. Neurosci. Res. 73 302–311. 10.1016/j.neures.2012.05.001 - DOI - PubMed
    1. Alvarado J. C., Fuentes-Santamaría V., Melgar-Rojas P., Valero M. L., Gabaldón-Ull M. C., Miller J. M., et al. (2015). Synergistic effects of free radical scavengers and cochlear vasodilators: a new otoprotective strategy for age-related hearing loss. Front. Aging Neurosci. 7:86. 10.3389/fnagi.2015.00086 - DOI - PMC - PubMed