. 2019 Feb 26:10:153.
doi: 10.3389/fphys.2019.00153. eCollection 2019.

Ischemic Duration and Frequency Determines AKI-to-CKD Progression Monitored by Dynamic Changes of Tubular Biomarkers in IRI Mice

Affiliations

Ischemic Duration and Frequency Determines AKI-to-CKD Progression Monitored by Dynamic Changes of Tubular Biomarkers in IRI Mice

Yang Dong et al. Front Physiol. .

Abstract

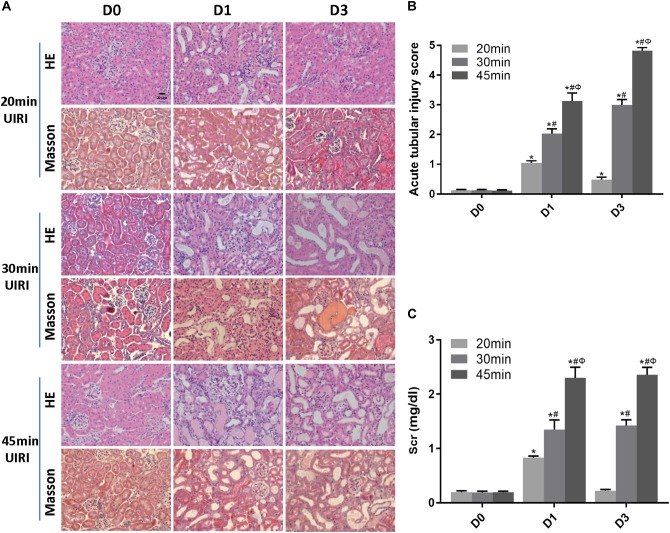
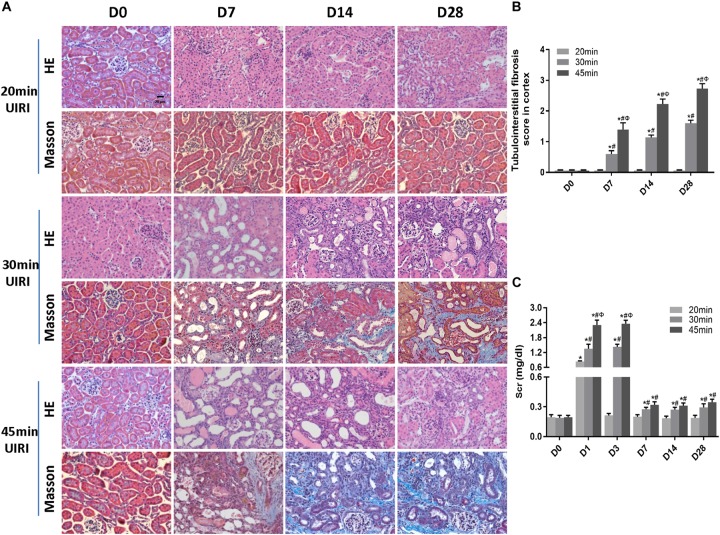
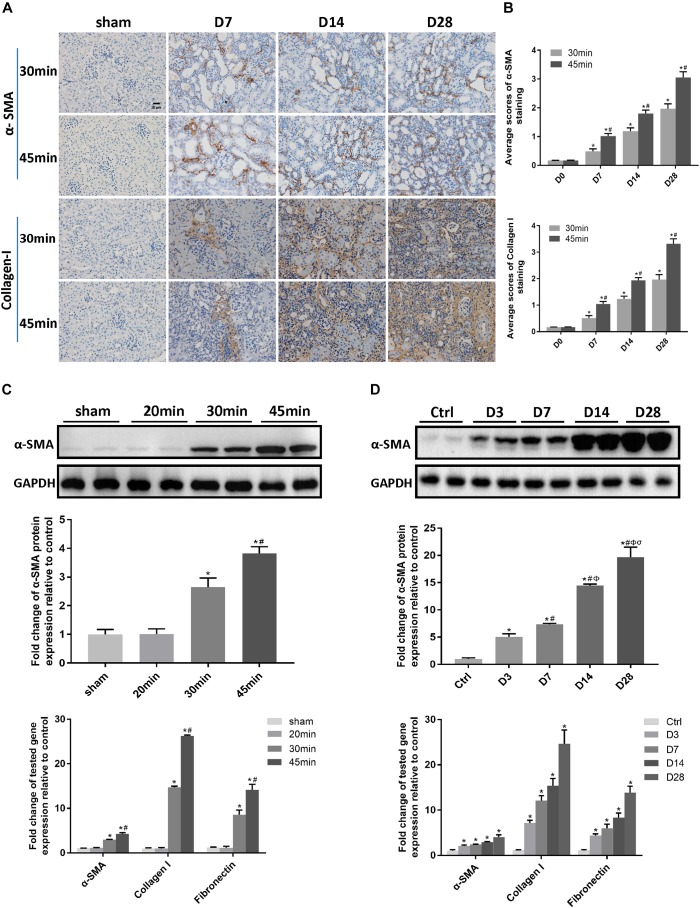
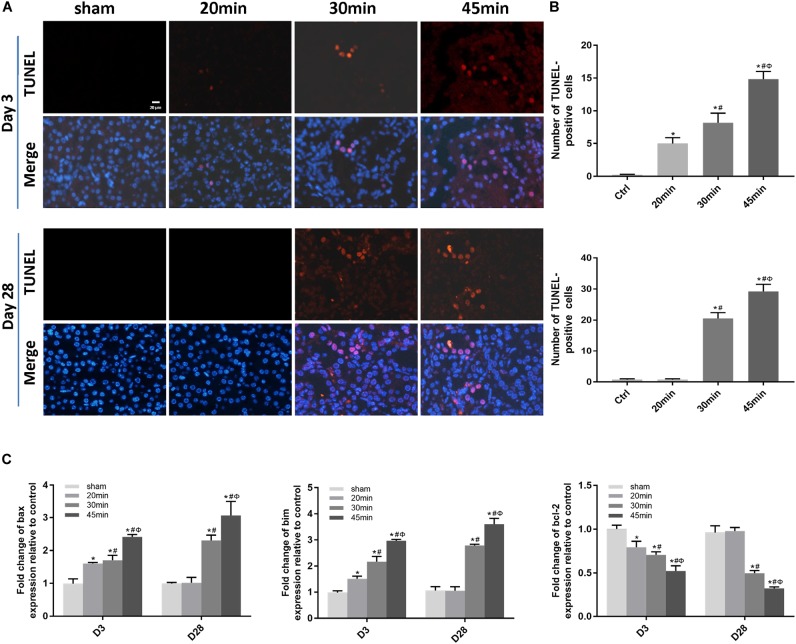
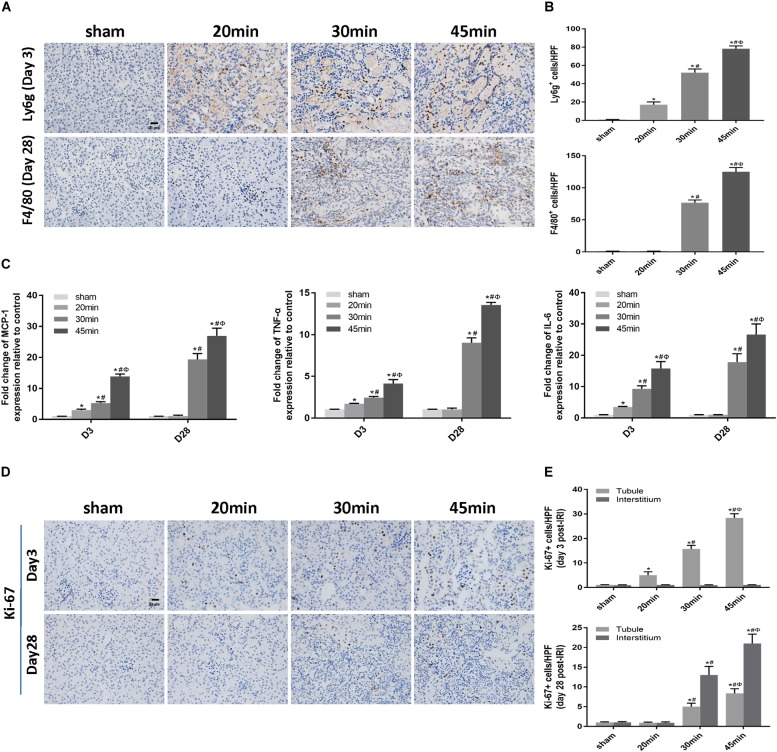
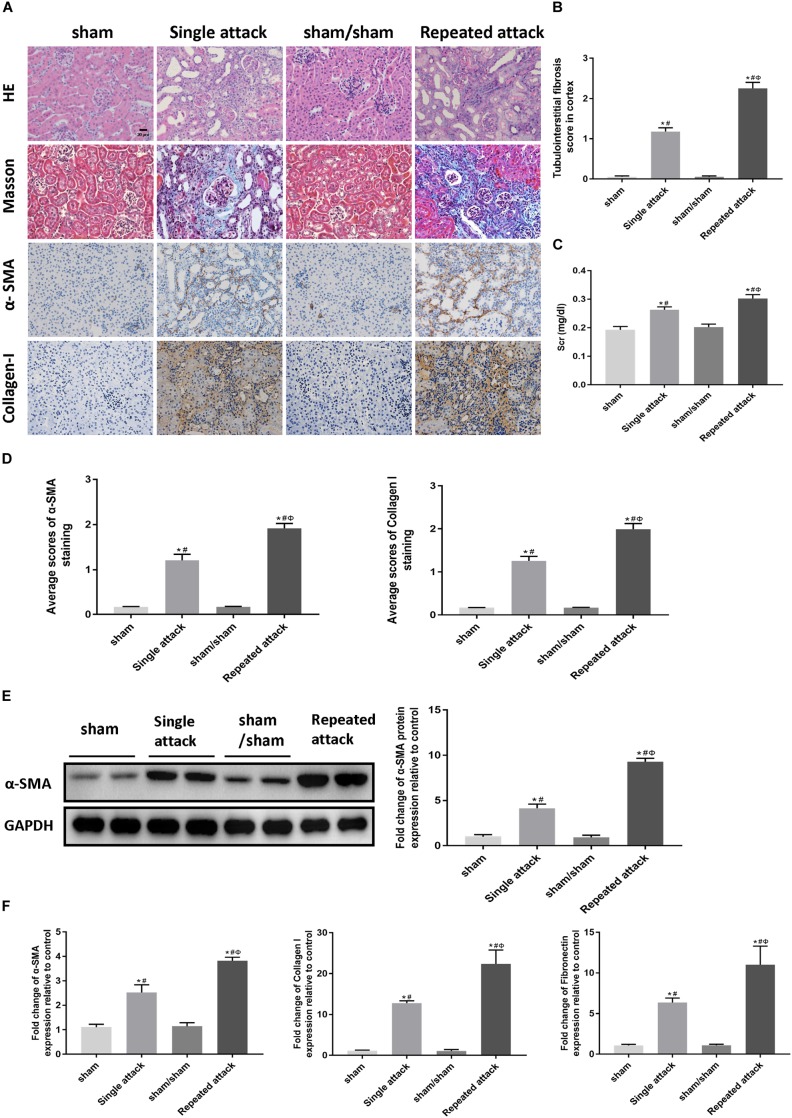
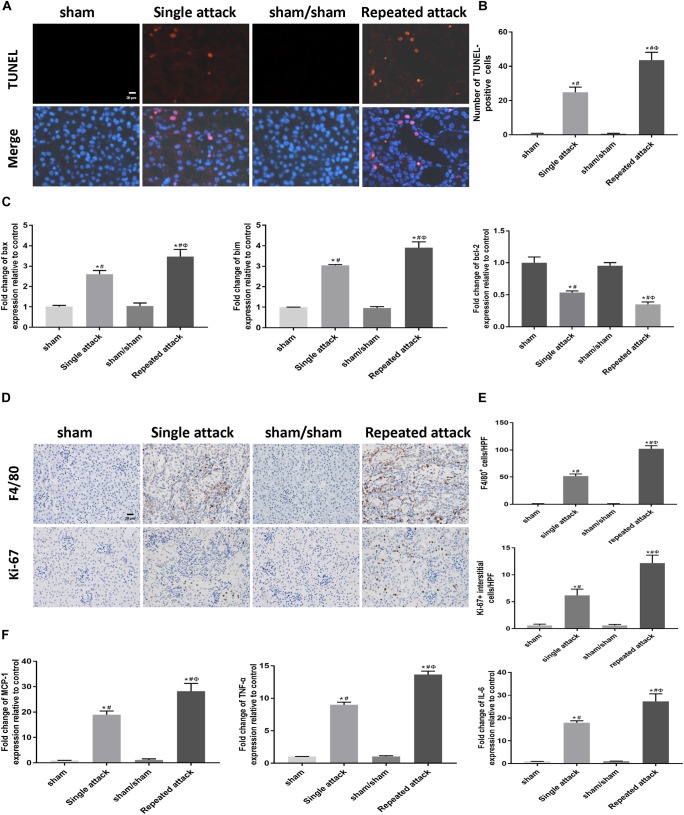
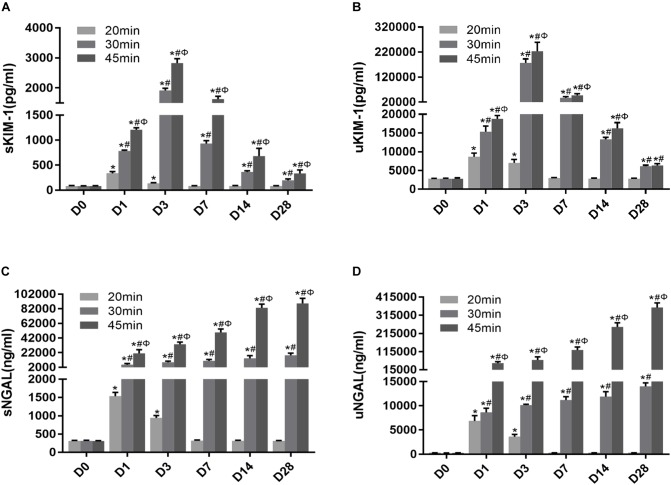
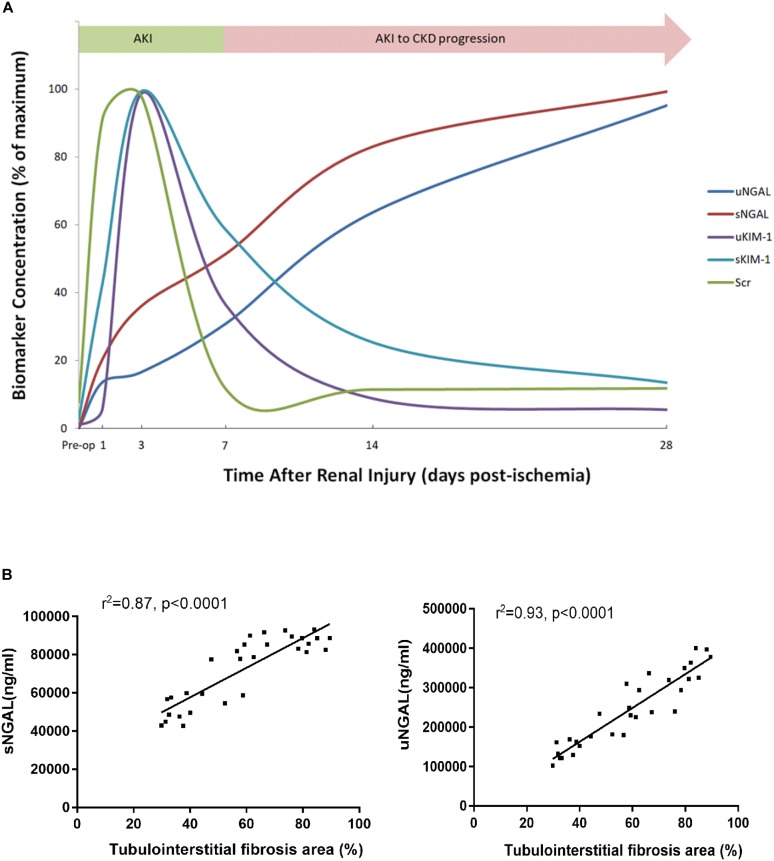
Ischemia reperfusion injury (IRI) is one of the most common causes of acute kidney injury (AKI). However, the pathogenesis and biomarkers predicting the progression of IRI-induced AKI to chronic kidney disease (CKD) remain unclear. A side-by-side comparison between different IRI animal models with variable ischemic duration and episodes was performed. The dynamic changes of KIM-1 and NGAL continuously from AKI to CKD phases were studied as well. Short-term duration of ischemia induced mild renal tubule-interstitial injury which was completely reversed at acute phase of kidney injury, while long-term duration of ischemia caused severe tubular damage, cell apoptosis and inflammatory infiltration at early disease stage, leading to permanent chronic kidney fibrosis at the late stage. Repeated attacks of moderate IRI accelerated the progression of AKI to CKD. Different from serum and urine levels of KIM-1 that increased at acute phase of IRI then declined gradually in chronic phase, NGAL increased continuously during AKI-to-CKD transition. Severity and frequency of ischemia injury determines the progression and outcome of ischemia-induced AKI. Inflammation, apoptosis and fibrogenesis likely participate in the progression of AKI to CKD. Both KIM-1 and NGAL enable noninvasive and early detection of AKI, but NGAL is associated better with the process of AKI-to-CKD progression.

Keywords: KIM-1; NGAL; acute kidney injury; chronic kidney disease; ischemia-reperfusion injury.


Figures

FIGURE 1
FIGURE 1
Relationship between ischemia duration and severity of acute tubule-interstitial injury. (A) HE and Masson staining of kidneys during the acute phase of kidney injury (original magnification × 400; Scale bar, 20 μm). (B) Acute tubular injury score of mouse kidneys during the acute phase of kidney injury. (C) Changes in Scr levels in mice during the acute phase of kidney injury. Data are presented as the means ± SEM of four experiments. n = 6; P < 0.05 vs. the control group. #P < 0.05 vs. the 20 min-ischemia group. ΦP < 0.05 vs. the 30 min-ischemia group.
FIGURE 2
FIGURE 2
A long ischemia duration induced AKI-to-CKD transition in IRI mice. (A) HE and Masson staining of kidneys during the chronic phase of kidney injury (original magnification × 400; Scale bar, 20 μm). (B) Tubulointerstitial fibrosis scores of mouse kidneys during the chronic phase of kidney injury. (C) Changes in Scr levels in mice in 28 days post ischemia. Data are presented as the means ± SEM of four experiments. n = 6; P < 0.05 vs. the control group. #P < 0.05 vs. the 20 min-ischemia group. ΦP < 0.05 vs. the 30 min-ischemia group.
FIGURE 3
FIGURE 3
A long ischemia duration induced kidney fibrosis in IRI mice. (A) Immunohistochemical staining of α-SMA and collagen I in kidneys, with representative pictures shown (original magnification × 400; Scale bar, 20μm). (B) Semiquantitative data of α-SMA and collagen I staining in different groups of mice. P < 0.05 vs. the control group. #P < 0.05 vs. the 30-min ischemia group. (C) Protein and mRNA expression of fibrosis markers in the kidney tissue lysates of mice subjected to different durations of ischemia at day 28 post-operation. P < 0.05 vs. the sham control group. #P < 0.05 vs. the 30-min ischemia group. (D) Protein and mRNA expression of fibrosis markers in the kidney tissue lysates of mice subjected to 45 min-IRI at different time points post ischemia. P < 0.05 vs. the baseline control group. #P < 0.05 vs. Day 3. ΦP < 0.05 vs. Day 7. σP < 0.05 vs. Day 14. All data above are presented as the means ± SEM of four experiments. n = 6.
FIGURE 4
FIGURE 4
Elevated apoptosis was associated with IRI-induced AKI severity and the AKI-to-CKD progression. (A) TUNEL staining to measure the apoptosis of renal tubular epithelial cells in each mouse group at days 3 and 28 post ischemia (original magnification × 400; Scale bar, 20 μm). (B) Quantitative analysis of the number of apoptotic cells in each group. (C) Expression of proapoptotic genes (Bax and Bim) and the antiapoptotic gene bcl-2 was measured by real-time PCR. Data are presented as the means ± SEM of four experiments. n = 6; P < 0.05 vs. the control group. #P < 0.05 vs. the 20-min ischemia group. ΦP < 0.05 vs. the 30 min-ischemia group.
FIGURE 5
FIGURE 5
Elevated inflammation was associated with IRI-induced AKI severity and the AKI-to-CKD transition. (A) Immunohistochemical staining of Ly6g (a neutrophil marker) at day 3 and F4/80 (a macrophage marker) at day 28 post ischemia in kidneys subjected to different durations of ischemia (original magnification × 400; Scale bar, 20 μm). (B) Semiquantitative data of Ly6g and F4/80 staining in different groups of mice. (C) Expression of inflammatory mediators (MCP1, TNF-α, and IL-6) was measured by real-time PCR. (D) Immunohistochemical staining of Ki-67 (a marker of proliferation) at day 3 and day 28 post ischemia in kidneys subjected to different durations of ischemia (original magnification × 400; Scale bar, 20 μm). (E) Semiquantitative data of Ki-67 staining in different groups of mice. T, tubule; I, interstitium. Data are presented as the means ± SEM of four experiments. n = 6; P < 0.05 vs. the control group. #P < 0.05 vs. the 20 min-ischemia group. ΦP < 0.05 vs. the 30 min-ischemia group.
FIGURE 6
FIGURE 6
Repeated episodes of moderate IRI accelerated kidney injury in mice. (A) HE and Masson’s trichrome staining as well as immunohistochemical staining of α-SMA and collagen I in kidneys at day 14 after the first renal ischemia attack are shown (original magnification × 400; Scale bar, 20 μm). (B) Tubulointerstitial fibrosis score of mouse kidneys at day 14 after the first renal ischemia attack. (C) Changes in Scr levels in mice at day 14. (D) Semiquantitative data of α-SMA and collagen I staining in different groups of mice. (E) Western blot analysis of α-SMA in the kidney tissue lysates of mice in each group. The densitometry analyses of Western blot are shown. (F) Effect of the frequency of ischemia attack on the mRNA expression of fibrosis markers in kidney tissue lysates. Data are presented as the means ± SEM of four experiments. n = 6; P < 0.05 vs. the sham control group. #P < 0.05 vs. the sham/sham group. ΦP < 0.05 vs. the single-attack group.
FIGURE 7
FIGURE 7
Increased apoptosis and inflammation were associated with the acceleration of the AKI-to-CKD transition in mice exposed to repeated IRI attacks. (A) TUNEL staining to measure the apoptosis of renal tubular epithelial cells in kidneys at day 14 after the first renal ischemia attack (original magnification × 400; Scale bar, 20 μm). (B) Quantitative analysis of the number of apoptotic cells in each group. (C) Expression of proapoptotic genes (bax and bim) and the antiapoptotic gene bcl-2 were measured by real-time PCR. (D) Immunohistochemical staining of F4/80 (a macrophage marker) and Ki-67 (a marker of proliferation) at day 14 after the first renal ischemia attack (original magnification × 400; Scale bar, 20 μm). (E) Semiquantitative data of F4/80 and Ki-67 staining in different groups of mice. (F) Expression of inflammatory mediators (MCP1, TNF-α, and IL-6) was measured by real-time PCR. Data are presented as the means ± SEM of four experiments. n = 6; P < 0.05 vs. the sham control group. #P < 0.05 vs. the sham/sham group. ΦP < 0.05 vs. the single-attack group.
FIGURE 8
FIGURE 8
Novel AKI biomarkers KIM-1 and NGAL enabled the noninvasive and early detection of AKI. (A–D) Tubular injury biomarker changes in mice subjected to different durations of ischemia at 28 days post ischemia: (A) serum KIM-1, (B) urinary KIM-1, (C) serum NGAL, (D) urinary NGAL. Data are presented as the means ± SEM of four experiments. n = 6; P < 0.05 vs. the control group. #P < 0.05 vs. the 20-min ischemia group. ΦP < 0.05 vs. the 30-min ischemia group.
FIGURE 9
FIGURE 9
NGAL was better associated with AKI-to-CKD progression. (A) The time course of changes in Scr levels and biomarker concentration after 45 min of UIRI. To create this plot, the level at the time point with the highest mean value was set to 100%, and the levels at all other time points were converted to a percentage of this maximum. (B) Correlations were analyzed between sNGAL and the extent of tubulointerstitial fibrosis (r = 0.87, P < 0.0001) and uNGAL and the extent of tubulointerstitial fibrosis (r = 0.93, P < 0.0001). sNGAL: serum NGAL, uNGAL: urinary NGAL.

References

    1. AvciÇiçek E., Rota S., Dursun B., Kavalci E. (2016). Evaluation of serum NGAL and hepcidin levels in chronic kidney disease patients. Ren. Fail. 38 35–39. 10.3109/0886022X.2015.1107823 - DOI - PubMed
    1. Basile D. P., Anderson M. D., Sutton T. A. (2012). Pathophysiology of acute kidney injury. Compr. Physiol. 2 1303–1353. 10.1002/cphy.c110041 - DOI - PMC - PubMed
    1. Bhavsar N. A., Köttgen A., Coresh J., Astor B. C. (2012). Neutrophil gelatinase-associated lipocalin (NGAL) and kidney injury molecule 1 (KIM-1) as predictors of incident CKD stage 3: the atherosclerosis risk in communities (ARIC) study. Am. J. Kidney Dis. 60 233–240. 10.1053/j.ajkd.2012.02.336 - DOI - PMC - PubMed
    1. Bijkerk R., de Bruin R. G., van Solingen C., van Gils J. M., Duijs J. M., van der Veer E. P., et al. (2016). Silencing of microRNA-132 reduces renal fibrosis by selectively inhibiting myofibroblast proliferation. Kidney Int. 89 1268–1280. 10.1016/j.kint.2016.01.029 - DOI - PubMed
    1. Bolignano D., Bolignano D., Lacquaniti A., Coppolino G., Campo S., Arena A., et al. (2008). Neutrophil gelatinase-associated lipocalin reflects the severity of renal impairment in subjects affected by chronic kidney disease. Kidney Blood Press. Res. 31 255–258. 10.1159/000143726 - DOI - PubMed