. 2019 Feb 27:10:304.
doi: 10.3389/fimmu.2019.00304. eCollection 2019.

Rapid Downregulation of DAB2 by Toll-Like Receptor Activation Contributes to a Pro-Inflammatory Switch in Activated Dendritic Cells

Affiliations

Rapid Downregulation of DAB2 by Toll-Like Receptor Activation Contributes to a Pro-Inflammatory Switch in Activated Dendritic Cells

Vanessa Figliuolo da Paz et al. Front Immunol. .

Abstract

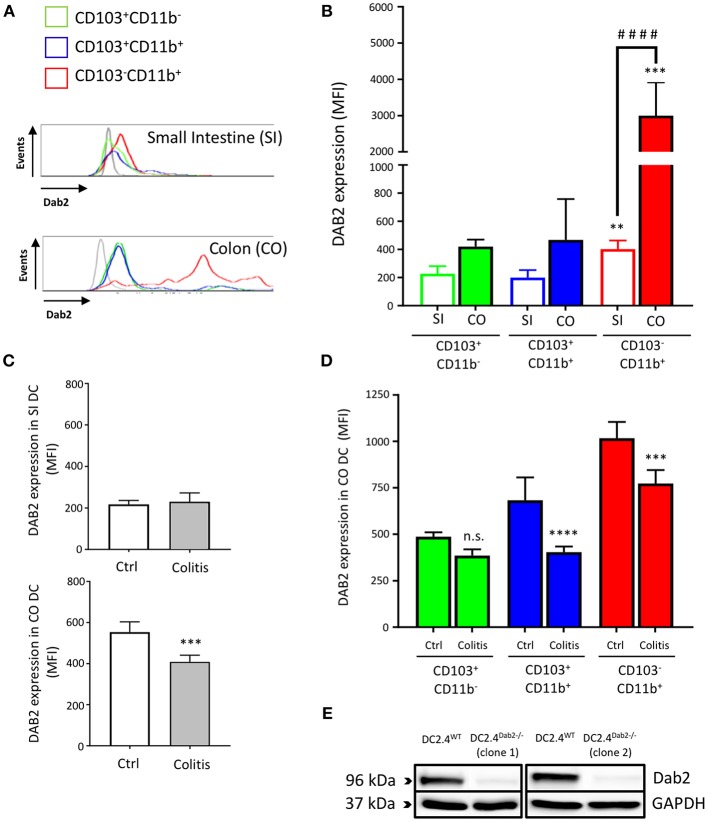
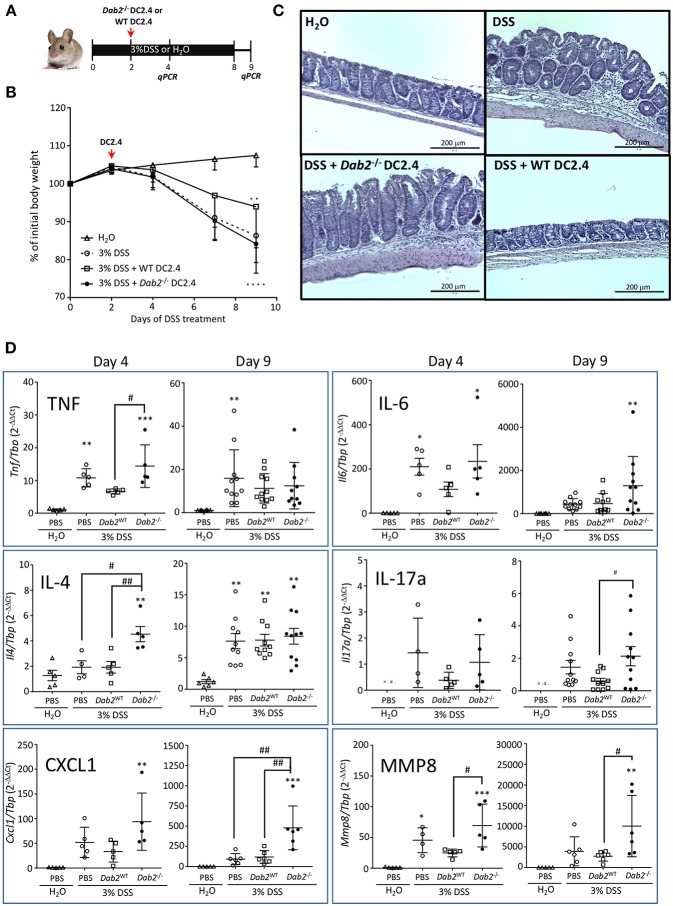
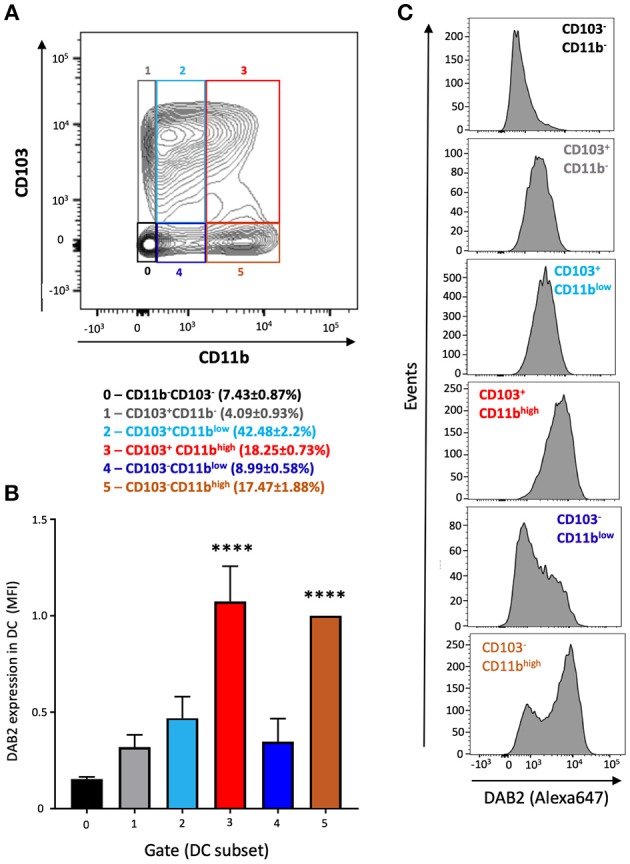
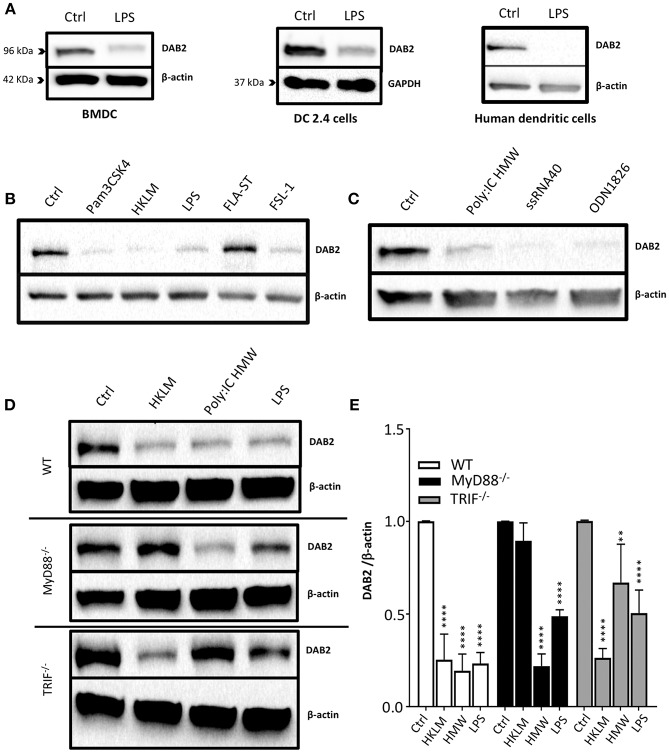
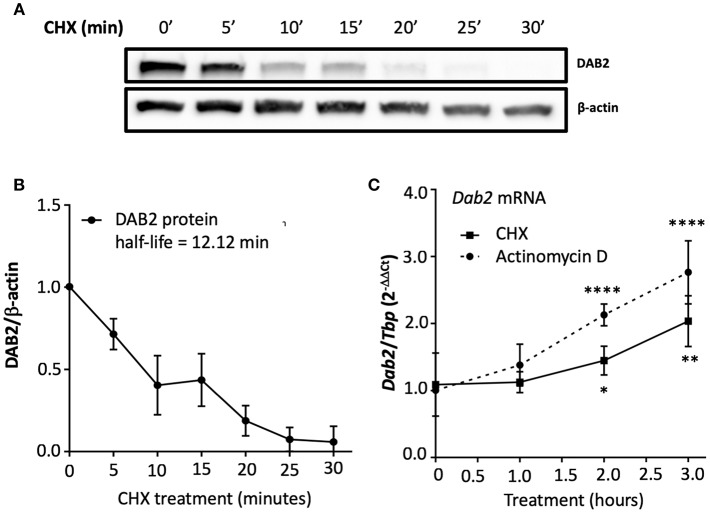
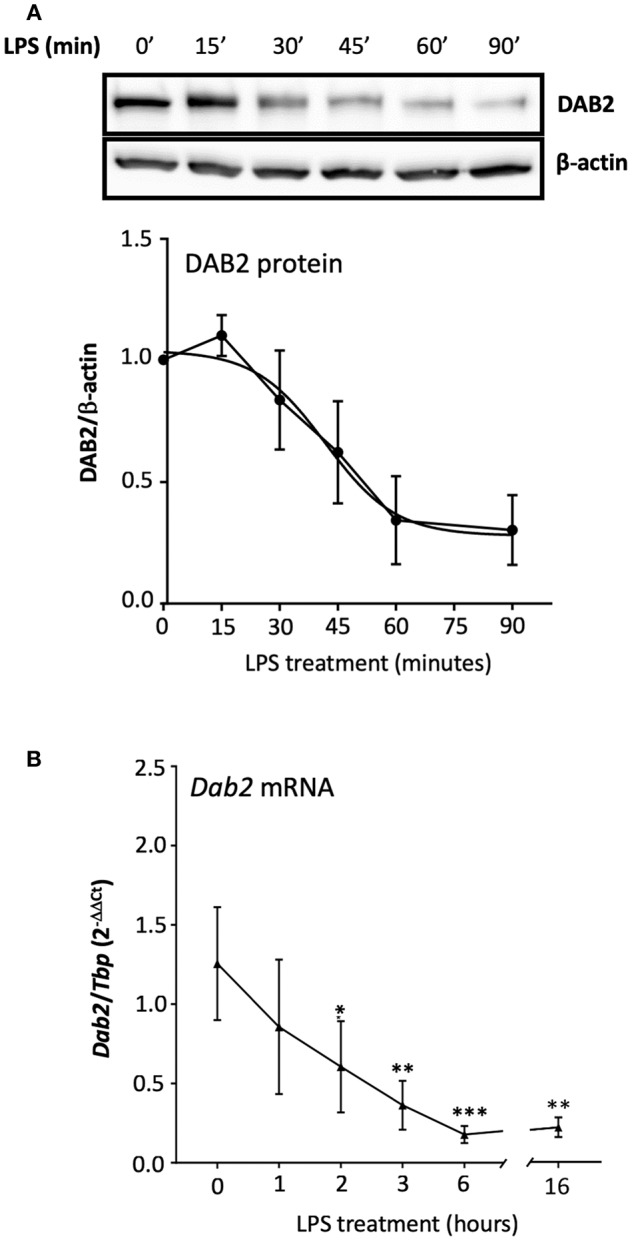
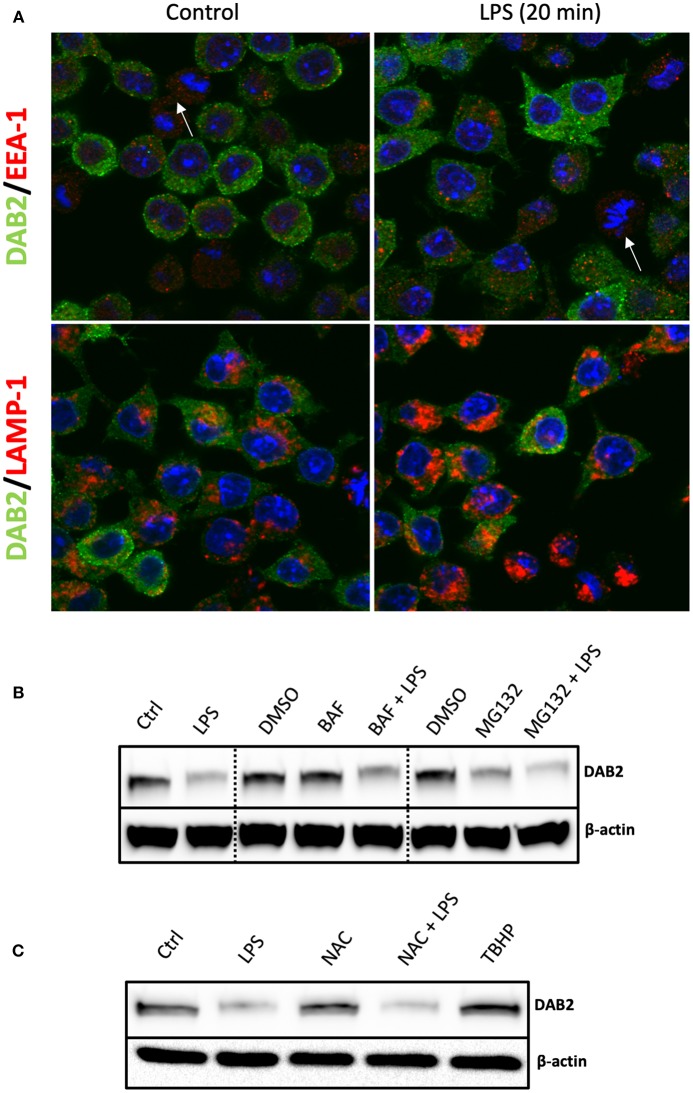
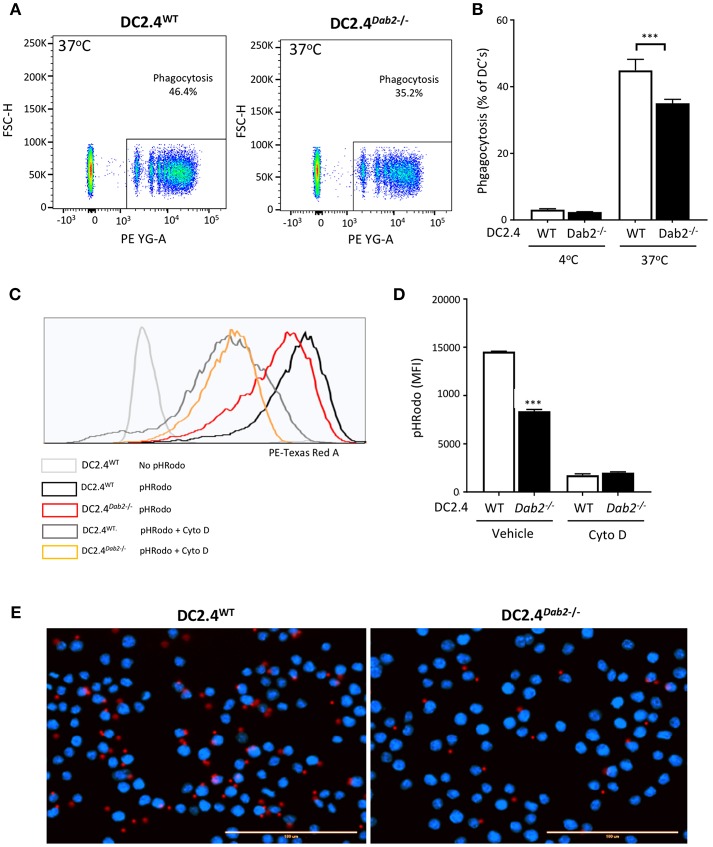
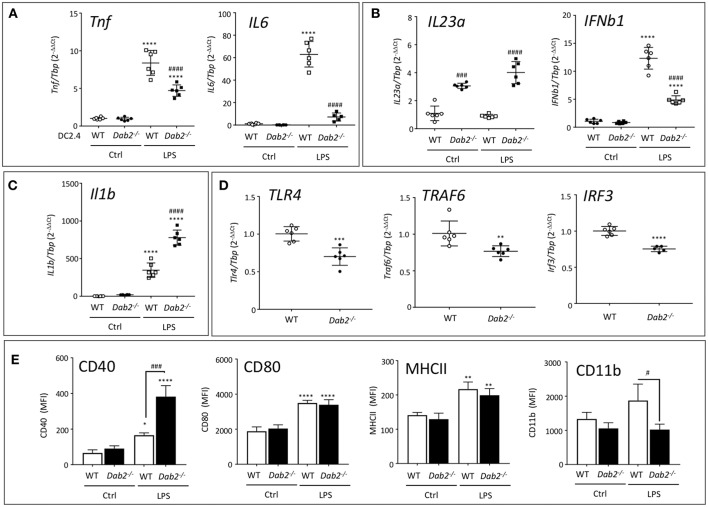
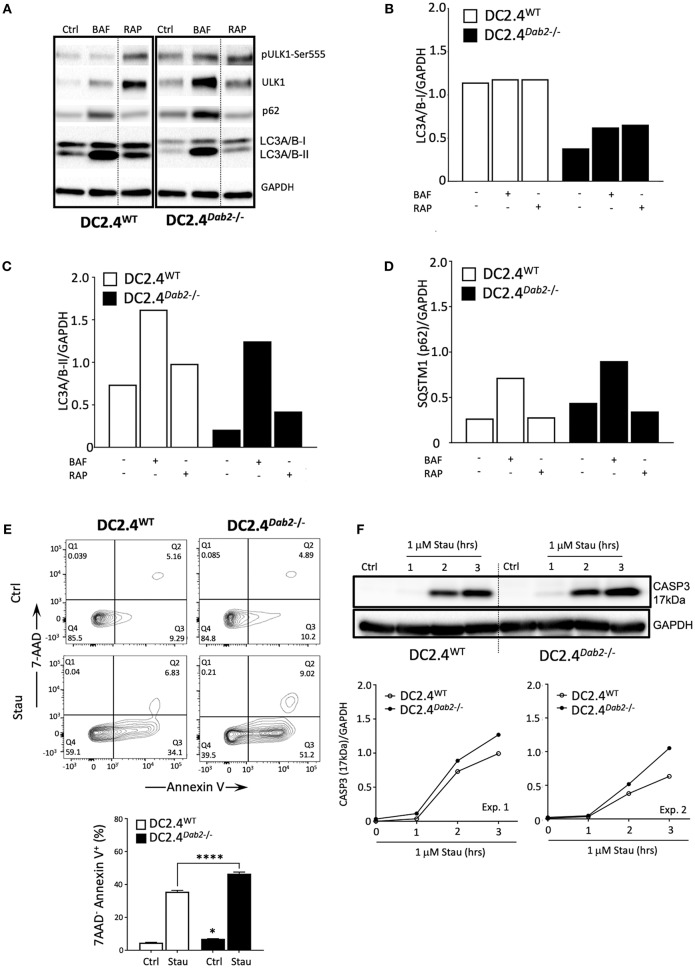
Dendritic cells (DCs) are pivotal in regulating tolerogenic as well as immunogenic responses against microorganisms by directing both the innate and adaptive immune response. In health, phenotypically different DC subsets found in the gut mucosa are maintained in their tolerogenic state but switch to a pro-inflammatory phenotype during infection or chronic autoinflammatory conditions such as inflammatory bowel disease (IBD). The mechanisms that promote the switch among the mucosal DCs from a tolerogenic to an immunogenic, pro-inflammatory phenotype are incompletely understood. We hypothesized that disabled homolog 2 (DAB2), recently described as a negative regulator of DC immunogenicity during their development, is regulated during intestinal inflammation and modulates mucosal DC function. We show that DAB2 is highly expressed in colonic CD11b+CD103- DCs, a subset known for its capacity to induce inflammatory Th1/Th17 responses in the colon, and is downregulated predominantly in this DC subset during adoptive T cell transfer colitis. Administration of Dab2-deficient DCs (DC2.4 Dab2-/- cells) modulated the course of DSS colitis in wild-type mice, enhanced mucosal expression of Tnfa, Il6, and Il17a, and promoted neutrophil recruitment. In bone-marrow derived dendritic cells (BMDC), DAB2 expression correlated with CD11b levels and DAB2 was rapidly and profoundly inhibited by TLR ligands in a TRIF- and MyD88-dependent manner. The negative modulation of DAB2 was biphasic, initiated with a quick drop in DAB2 protein, followed by a sustained reduction in Dab2 mRNA. DAB2 downregulation promoted a more functional and activated DC phenotype, reduced phagocytosis, and increased CD40 expression after TLR activation. Furthermore, Dab2 knockout in DCs inhibited autophagy and promoted apoptotic cell death. Collectively, our results highlight the immunoregulatory role for DAB2 in the intestinal dendritic cells and suggest that DAB2 downregulation after microbial exposure promotes their switch to an inflammatory phenotype.

Keywords: Dab2; colon; dendritic cells; immunoregulation; inflammation; small intestine.


Figures

Figure 1
Figure 1
Dab2 is highly expressed in colonic lamina propria CD103CD11b+ DCs and downregulated during murine colitis. (A,B) Flow cytometric analysis of DAB2 expression in small intestinal (SI) and colonic (CO) mucosal DCs of healthy WT C57BL/6J mice; **p < 0.01 and ***p < 0.005 when compared to other; ####p < 0.001 when comparing the indicated groups DC subsets from the same tissue. (C,D) Flow cytometric analysis of DAB2 expression in the SI and CO DC in Rag2−/− mice after T cell transfer (Colitis) or injection with PBS (Ctrl) (***p < 0.005 and ****p < 0.001 Colitis vs. Ctrl); n.s., not significant. DCs were analyzed by flow cytometry after staining with viability dye eFluor 506, anti-F480, CD11c, CD11b, CD103, and anti-DAB2 mAbs. DC are depicted as live F480CD11c+ and stratified by CD11b and CD103 expression. Data represent DAB2 expression as mean fluorescence intensity (MFI) of two independent experiments combined (n = 5 mice/experiment). (E) Western blotting analysis of DAB2 expression (96 kDa) in WT (DC2.4WT) and Dab2−/− (clones 1 and 2; DC2.4Dab2/) DC2.4 cells after transfection with Dab2 CRISPR-CAS9 and clonal selection.
Figure 2
Figure 2
Pro-inflammatory effect of Dab2-deficient DCs during DSS colitis. (A) C57BL/6J mice received 3% DSS in their drinking water or regular water for 8 days. On day 2, mice were intraperitoneally injected with 8.5 × 10⁵ DC 2.4 WT or Dab2−/− cells. Mice were switched to regular water on day 8. Two cohorts of mice were euthanized on days 4 or 9 after DSS treatment. (B) Relative body weight change; n = 8–11 **p < 0.01 and ****p < 0.001 DSS vs. H2O in mice treated with DC2.4WT and DC2.4Dab2−/− cells, respectively. (C) Representative H&E staining of the distal colons from each experimental group (day 9). Bar = 200 μm. (D) Colonic gene expression of selected inflammatory mediators in control and DSS-treated mice by qRT-PCR on days 4 and 9 after DSS treatment. n = 5–11 (*p < 0.05, **p < 0.01 and ***p < 0.005 when compared to untreated mice or #p < 0.05 and ##p < 0.01 in pairs indicated by brackets.
Figure 3
Figure 3
DAB2 is expressed in bone marrow derived dendritic cells from C57L/6J mice and correlates with CD11b expression. Bone-marrow derived dendritic cells (BMDCs) were differentiated from C57BL/6J mice with a combination of 200 ng/mL FLT3L for 9 days and 20 ng/mL GM-CSF for the last 2 days and analyzed by flow cytometry after staining with viability dye eFluor 506, anti-F480, B220, CD11c, CD11b, CD103, and anti-DAB2 mAbs. Conventional DC are depicted as live F480B220CD11c+ and stratified by CD11b and CD103 expression. (A) Relative abundance of BMDC phenotypes based on the expression of CD11b (neg, low, or high) and CD103 (neg, pos) (gates 0–5). (B) DAB2 expression in BMDCs is expressed as mean fluorescence intensity (MFI) in each gate. (C) Representative histograms of DAB2 expression in the populations gates as in (A). Data represent mean values of three independent experiments combined (n = 3 mice/experiment ****p < 0.001 when compared to the gates/populations 0, 1, 2, and 4).
Figure 4
Figure 4
DAB2 is downregulated in human and murine dendritic cells after Toll-like receptor activation through MyD88 and TRIF pathways. (A) Bone-marrow derived dendritic cells (BMDC) differentiated from C57BL/6J mice, DC2.4 cells, and human monocytes-derived dendritic cells were incubated with 100 ng/mL LPS, and DAB2 expression was quantified using western blotting. (B) DAB2 expression in BMDCs treated with agonist for extracellular TLR or (C) agonist for intracellular TLR. (D,E) DAB2 expression after treatment with HKLM, HMW, or LPS in BMDC differentiated from WT, MyD88−/−, and or TRIF−/− C57BL/6 mice. Bar graphs represent mean values of three independent experiments combined (n = 3 mice, **p < 0.01, ****p < 0.001 treatment vs. Ctrl within the same genetic background).
Figure 5
Figure 5
DAB2 expressed in dendritic cells has an unstable protein but a stable transcript. (A,B) BMDCs were incubated with 5 μg/mL cycloheximide (CHX) for up to 30 min and DAB2 expression was evaluated by western blotting. (C) Time course analysis of Dab2 mRNA after treatment with 10 μg/mL actinomycin D or 5 μg/mL CHX (experiment was limited to 3 h to avoid toxicity and cell death). Dab2 and Tbp gene expression was quantified using qRT-PCR. *p < 0.05, **p < 0.01, ****p < 0.001 effect of the treatment when compared to time 0. Data represent mean values from at least two independent experiments combined (n = 3 mice/experiment).
Figure 6
Figure 6
TLR4 activation represses both DAB2 protein and gene expression with different dynamics.(A) BMDCs were incubated with 100 ng/mL LPS for up to 90 min and DAB2 protein expression was evaluated by Western blotting. (B) Dab2 mRNA expression was evaluated after incubation with 100 ng/mL LPS for up to 16 h. Dab2 and Tbp (as an internal control) gene expression was quantified using qRT-PCR. *p < 0.05, **p < 0.01, ***p < 0.005 effect of LPS compared to time 0. Data represent mean values of at least two independent experiments combined (n = 3 mice each).
Figure 7
Figure 7
DAB2 protein downregulation after TLR activation does not require proteasome or lysosomal degradation. (A) DAB2 (green) and EEA-1 or LAMP-1 (red) were immunolabeled in DC2.4 cells exposed to control medium or to 100 ng/mL LPS for 20 min and images were acquired using confocal microscopy. Arrows indicate cells undergoing mitosis. There was no co-localization of DAB2 with early endosomal (EEA-1) or lysosomal (LAMP-1) positive compartments. (B) DAB2 expression was assessed by western blotting in cells pre-treated with 2 μM MG132, 100 nM Bafilocymin A1 or DMSO (vehicle) in culture media for 30 min before 1 h treatment with 100 ng/mL LPS. (C) DAB2 expression was assessed by Western blotting in control cells, cells treated for 1 h with LPS, treated with 2 mM n-acetyl-cysteine (NAC) for 1 h, cells pre-treated 15 min with NAC before 1 h LPS treatment, or cells treated with 55 μM tert-butyl-hydroperoxide (TBHP) for 1 h. Data represents results from least three independent experiments.
Figure 8
Figure 8
DAB2 regulates DC phagocytosis. (A,B) Internalization of IgG-coated latex beads cells was evaluated after incubation of DC2.4WT or DC2.4Dab2/ cells at a ratio of 25 beads/cell for 1 h at 37°C. The percentage of DCs that internalized red beads was analyzed by flow cytometry. Data represent mean values of n = 3, ***p < 0.005 DC2.4WT vs. DC2.4Dab2/ cells. (C,D) Histogram showing mean fluorescence intensity (MFI) obtained from DC2.4WT vs. DC2.4Dab2/ cells incubated with pHrodo Red E. coli BioParticles for 1 h in the presence of vehicle or 1 μM cytochalasin D (D) ***p < 0.005 DC2.4WT vs. DC2.4Dab2/ cells. (E) Representative epifluorescent images of DC2.4WT vs. DC2.4Dab2/ cells after 1 h of phagocytosis of the BioParticles at 37°C. Nuclei are depicted in blue (DAPI) and beads in red. Bar = 100 μm. Data representative of at least three independent experiments.
Figure 9
Figure 9
DAB2 expression modulates DC response to TLR activation. mRNA expression of (A) Tnf and Il6, (B) Il23a and Ifnβ1, (C) Il1β, and (D) Tlr4, Traf6, and Irf3 6 h after exposure of DC2.4WT or DC2.4Dab2/ cells to 100 ng/mL LPS, evaluated by qRT-PCR with Tbp used as an internal control. (E) Expression of cell surface DC activation markers CD40, CD80, MHCII, and CD11b in DC2.4WT vs. DC2.4Dab2/ cells treated with vehicle (Ctrl) or 100 ng/mL LPS for 24 h was evaluated by flow cytometry and expressed as mean fluorescence intensity (MFI). Data represent mean values of n = 3–6. (*p < 0.05, **p < 0.01, ***p < 0.05 and ****p < 0.001 Ctrl vs. LPS for DC2.4WT or DC2.4Dab2/ cells. #p < 0.05 and ###p < 0.005, ####p < 0.001 when DC2.4WT vs. DC2.4Dab2/ cells in the same treatment groups).
Figure 10
Figure 10
DAB2 modulates autophagy and protects dendritic cells from apoptosis. (A) DC2.4WT and DC2.4Dab2/ cells were left untreated or treated either with 100 nM bafilomycin A1 (BAF) or 200 nM rapamycin (RAP) for 6 h and the expression of autophagy markers, p-UKL-1, UKL-1, p62, LC3A/B I-II, was evaluated by Western blotting. (B) Summary of relative changes in LC3A/B-I expression. (C) Summary of relative changes in LC3A/B-II expression. (D) Summary of relative changes in SQSTM1/p62 expression. (E) Cell death in DC2.4WT and DC2.4Dab2/ cells treated with vehicle or 1 μM staurosporine for 3 h was accessed by flow cytometry to identify AnnexinV+7-AAD apoptotic cells (*p < 0.05 Ctrl DC2.4WT vs. Ctrl DC2.4Dab2/ cells; ****p < 0.001 Stau DC2.4WT vs. Stau DC2.4Dab2/ cells). (F) Caspase-3 activation after incubation with 1 μM staurosporine for 1, 2, and 3 h was accessed using Western blot. The samples compared were separated in the same gel. Due to inter-experimental variation in the time-course of caspase 3 activation, two out of three independent experiments performed are depicted.

Similar articles

Cited by

References

    1. Iwasaki A, Medzhitov R. Control of adaptive immunity by the innate immune system. Nat Immunol. (2015) 16:343–53. 10.1038/ni.3123 - DOI - PMC - PubMed
    1. West AP, Koblansky AA, Ghosh S. Recognition and signaling by toll-like receptors. Annu Rev Cell Dev Biol. (2006) 22:409–37. 10.1146/annurev.cellbio.21.122303.115827 - DOI - PubMed
    1. Hemmi H, Akira S. TLR signalling and the function of dendritic cells. Chem Immunol Allergy (2005) 86:120–35. 10.1159/000086657 - DOI - PubMed
    1. Zanoni I, Granucci F. Regulation of antigen uptake, migration, and lifespan of dendritic cell by Toll-like receptors. J Mol Med. (2010) 88:873–80. 10.1007/s00109-010-0638-x - DOI - PubMed
    1. Agrawal S, Agrawal A, Doughty B, Gerwitz A, Blenis J, Van Dyke T, et al. . Cutting edge: different Toll-like receptor agonists instruct dendritic cells to induce distinct Th responses via differential modulation of extracellular signal-regulated kinase-mitogen-activated protein kinase and c-Fos. J Immunol. (2003) 171:4984–9. 10.4049/jimmunol.171.10.4984 - DOI - PubMed

Publication types

Substances