. 2019 Feb 27:10:317.
doi: 10.3389/fimmu.2019.00317. eCollection 2019.

Low-Dose Total Body Irradiation Can Enhance Systemic Immune Related Response Induced by Hypo-Fractionated Radiation

Affiliations

Low-Dose Total Body Irradiation Can Enhance Systemic Immune Related Response Induced by Hypo-Fractionated Radiation

Jing Liu et al. Front Immunol. .

Erratum in

Abstract

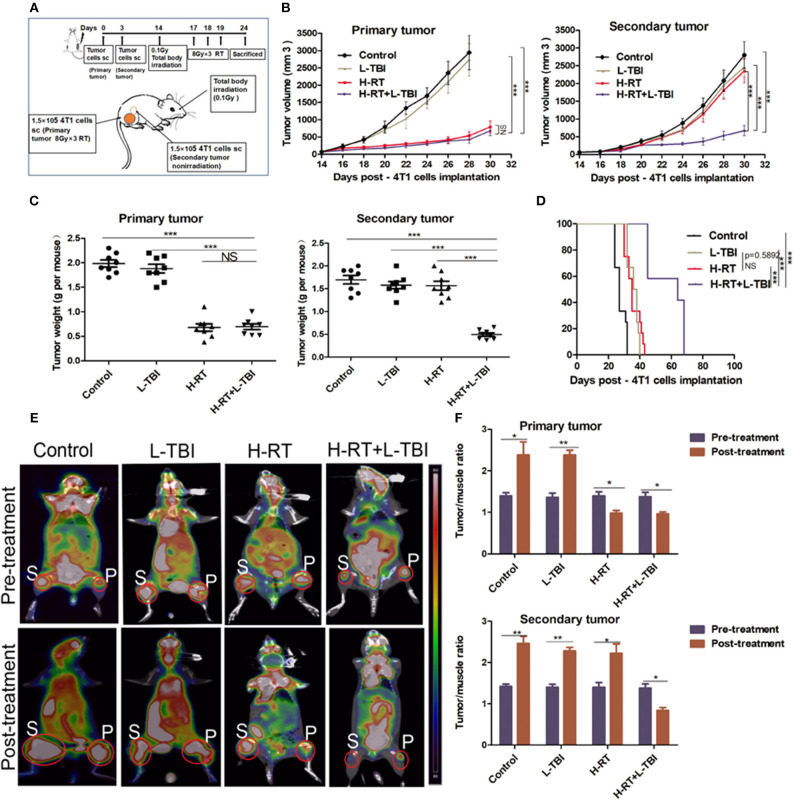
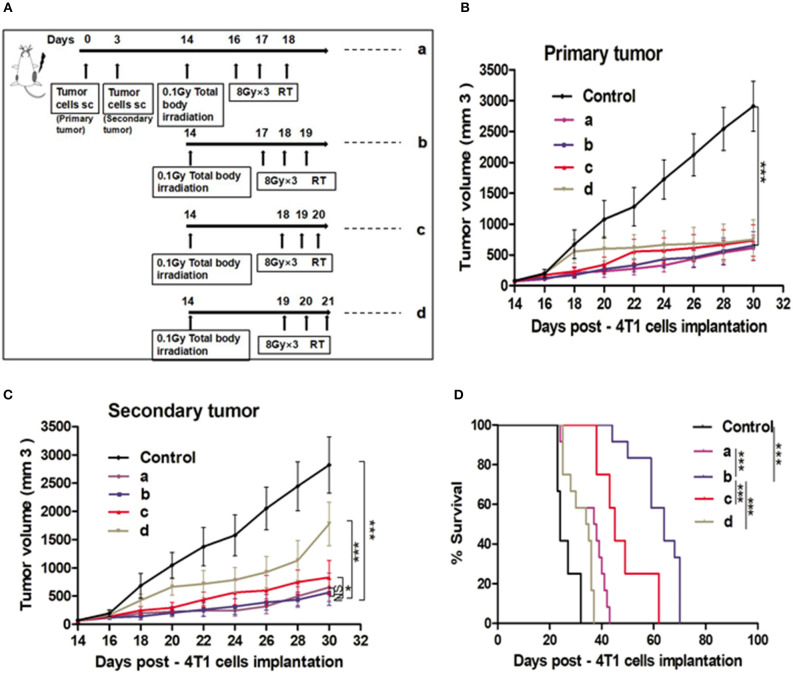
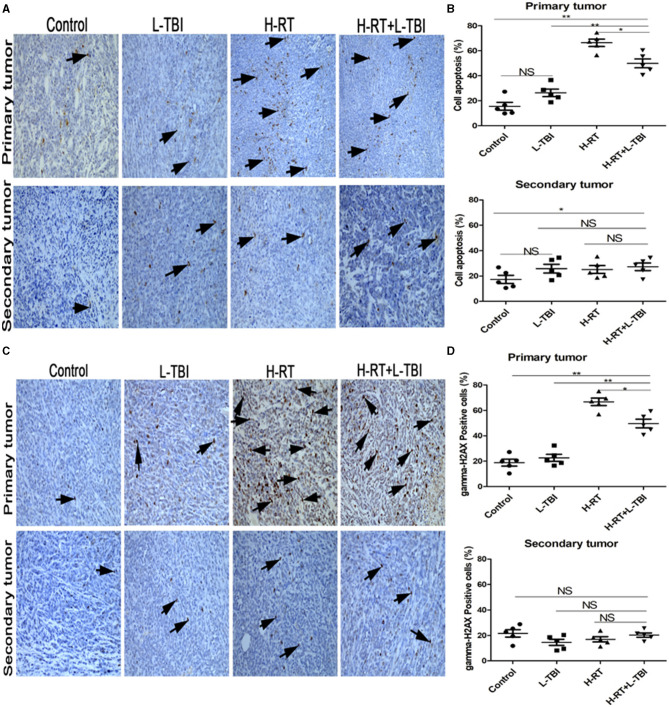
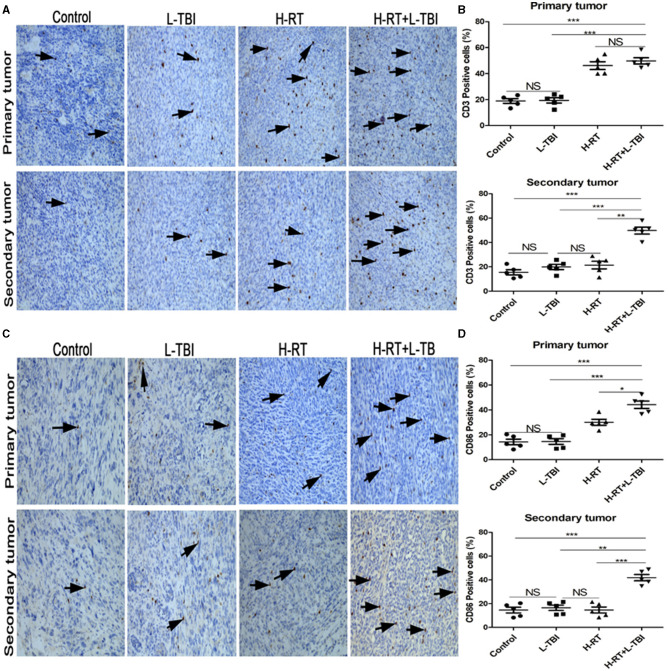
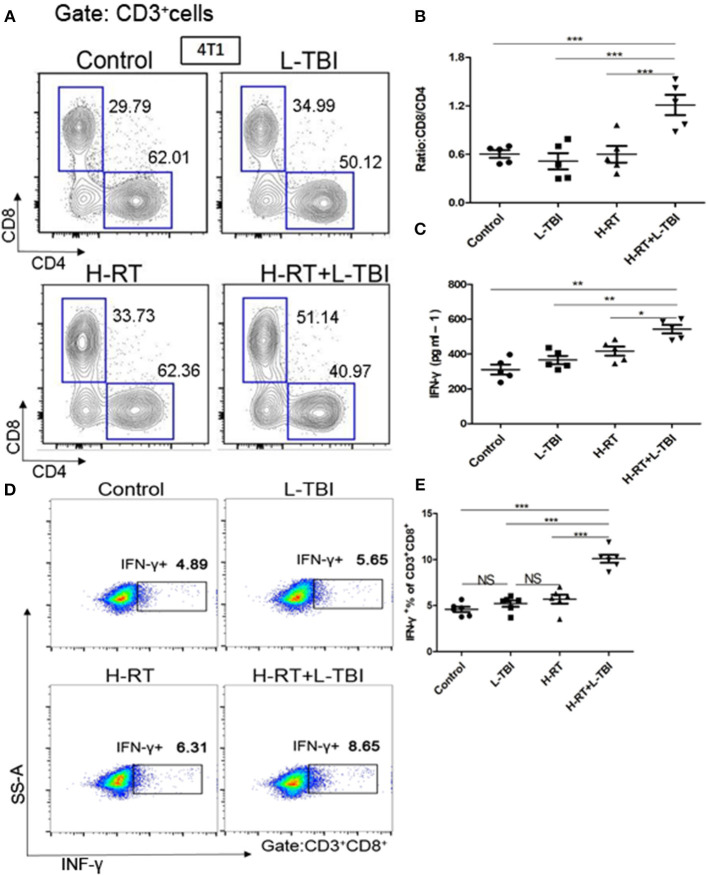
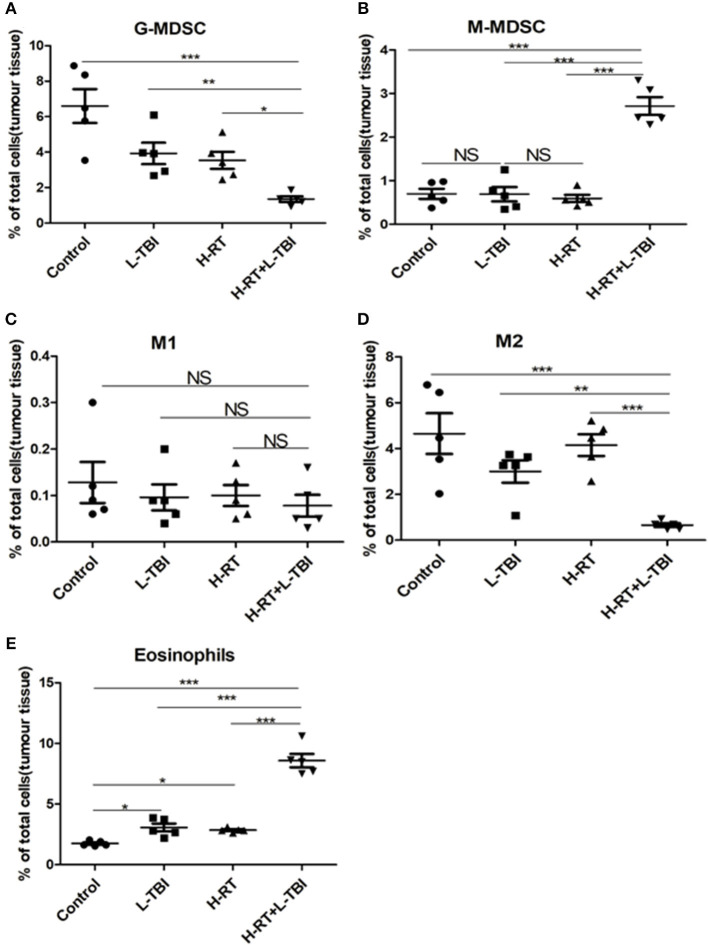
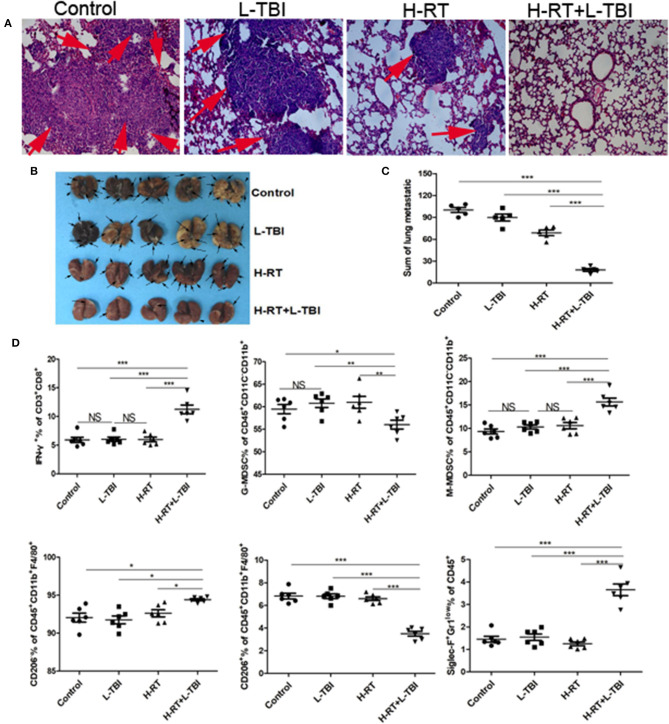
A systemic immune related response (SIME) of radiotherapy has been occasionally observed on metastatic tumors, but the clinical outcomes remain poor. Novel treatment approaches are therefore needed to improve SIME ratio. We used a combination of hypo-fractionated radiation therapy (H-RT) with low-dose total body irradiation (L-TBI) in a syngeneic mouse model of breast and colon carcinoma. The combination therapy of H-RT and L-TBI potentially enhanced SIME by infiltration of CD8+ T cell and altering the immunosuppressive microenvironment in non-irradiated subcutaneous tumor lesions. The frequency of IFN-γ, as a tumor-specific CD8+ T cells producing, significantly inhibited the secondary tumor growth of breast and colon. Our findings suggest that L-TBI could serve as a potential therapeutic agent for metastatic breast and colon cancer and, together with H-RT, their therapeutic potential is enhanced significantly.

Keywords: hypo-fractionated radiation therapy; immune enhancement; immunosuppressive microenvironment; low-dose total body irradiation; systemic immune related response.


Figures

Figure 1
Figure 1
H-RT on 4T1-derived subcutaneous tumor combined with L-TBI. (A) Experimental groups were treated as represented in the timeline. Immunocompetent mice were injected s.c. with syngeneic 4T1 cells (1 × 10⁵) into the right (primary tumor) and left (secondary tumor) flank, respectively. H-RT was administered locally to the primary tumor from day 17 to 19, and L-TBI was administered on day 14. Primary and secondary tumor volumes were measured. On day 24, mice were sacrificed and tumors weighed. (B) Tumor growth of primary tumors (right panel) and secondary tumor (left panel) in mice treated with control (black line), H-RT (yellow line), L-TBI (red line), and combination of the H-RT and L-TBI (blue line). Data are the mean ± SE of 12 mice/group. (C) Primary tumor weight (right panel) and secondary tumor weight (left panel) on day 24 (n = 8 mice/group). (D) Overall survival of the tumor bearing mice of different treatment groups (n = 12 mice/group). (E) Representative pre- and post-treatment 18F-FDG PET images of tumor-bearing mice in control, and treatments groups (L-TBI, H-RT, H-RT+L-TBI; n = 5 mice/group). (F) Tumor/muscle ratio of primary (right panel) and secondary (left panel) tumor in the pre-treatment (on day 13) and post-treatment (on day 24) period (n = 5 mice/group). The experiment has been repeated in similar result (*P < 0.05, **P < 0.01, *** P < 0.001 and NS = not significant).
Figure 2
Figure 2
Effect of different time intervals of the H-RT and L-TBI combination therapy in 4T1 tumor-bearing mice. (A) Treatment timeline of the 4T1 mammary carcinoma BALB/C mouse model. Tumor growth of primary tumors (B) and secondary tumors (C) in different experimental groups. (D) Overall survival curves of the treatment groups. Immunocompetent mice were injected s.c. with syngeneic 4T1 cells (1 × 10⁵) into the right (primary tumor) and left (secondary tumor), respectively. The 12 mice/group irradiated with H-RT (8 Gy x 3) at 48 h (a), 72 h (b), 96 h (c), and 120 h (d) after L-TBI. Primary and secondary tumor volumes were measured. Data are expressed as mean ± SE (*P < 0.05, ***P < 0.001, and NS = not significant).
Figure 3
Figure 3
Effect of combination H-RT and L-TBI therapy on apoptosis in 4T1 tumor-bearing tissues. (A) Comparison of representative TUNEL IHC-stained in different treatment groups. (B) Percentage of TUNEL positive cells in the primary and secondary tumor. (C) Representative gamma-H2AX IHC staining image in different treatment groups. (D) Percentage of gamma-H2AX positive cells in the primary and secondary tumor. The arrows point to the TUNEL and gamma-H2AX positive cells in the tumor tissue (original magnification × 200). Data are expressed as mean ± SE of 5 mice/group. (*P < 0.05, ** P < 0.01, and NS = not significant).
Figure 4
Figure 4
Comparison of CD3+ and CD86+ lymphocytes in different treatment groups. (A) Representative images of CD3 IHC in tumor tissues of different treatment groups. (B) Percentage of CD3 positive cells in the primary and secondary tumor. (C) Representative IHC images of CD86 infiltration in the tumor tissue of different treatment groups. (D) Percentage of CD86 positive cells in the primary and secondary tumor. The arrows point the CD3 and Cd86 positive cells in tumor tissues from mice that received different treatments (original magnification × 200). Data are expressed as mean ± SE of 5 mice/group. (*P < 0.05, **P < 0.01, ***P < 0.001, and NS = not significant).
Figure 5
Figure 5
Expression of CD8+/CD4+ T cells in mice treated with H-RT and L-TBI radiotherapy. (A) The frequencies of CD8+ and CD4+ cells induced in the secondary tumor of each group (n = 5 mice/group). (B) Ratio of CD8+/CD4+ cells in the secondary tumor of each group (n = 5 mice/group). (C) ELISA results of the INF-γ levels (pg/ml) in various groups (n = 5 mice/group). (D) Representative dot plots of CD3+CD8+INF-γ+ cells in the secondary tumor tissue of control, L-TBI, H-RT, and H-RT+L-TBI group (n = 6 mice/group). (E) Comparison plot of CD3+CD8+INF-γ+ cells in the secondary tumor tissue of different various groups (n = 6 mice/group). The cells were gated on living lymphocytes and then on CD8+ and CD4+ cells and the percentages of CD3+CD8+INF-γ+ T-cells were determined by flow cytometry analysis. Data are representative charts or the percentages of individual subjects. The lines indicate median values for each group. (*P < 0.05, **P < 0.01, ***P < 0.001, NS = not significant).
Figure 6
Figure 6
Immunosuppressive microenvironment effects of H-RT and L-TBI combination therapy on 4T1 tumor-bearing mice. The percentage of the G-MDSCs (defined as CD45+CD11cCD11b+Ly6G+Ly6clow) (A), M-MDSCs (defined as CD45+CD11cCD11b+Ly6GLy6chi) (B), M1 (defined as CD45+CD11b+F4/80+ CD206) (C), M2 (defined as CD45+CD11b+ F4/80+CD206+) (D), and Eosinophils (defined as Siglec-F+Gr1low) (E) were analyzed by flow cytometry analysis. Data are representative charts or the percentages of individual subjects. Data are expressed as mean ± SE of 5 mice/group. The statistical significance of differences was determined by ANOVA. (*P < 0.05, **P < 0.01, ***P < 0.001, and NS = not significant).
Figure 7
Figure 7
Anti-metastatic effect of the H-RT and L-TBI combination therapy. (A) Comparison of representative H&E-stained in lung tissue sections at 24 days after 4T1 cells implantation (original magnification × 100). The arrows point to the metastatic infiltration. (B) Representative macroscopic images of the lungs in different groups. The arrows point to the metastatic nodules in the lung (n = 5 mice/group). (C) Comparison of the lung metastatic nodules between control, L-TBI, H-RT, and H-RT+L-TBI group (n = 5 mice/group). (D) Frequency of IFN-γ+ CD8+ T cells (CD3+CD8+IFN-γ+), G-MDSC (CD45+CD11cCD11b+Ly6G+Ly6clow), M-MDSC (CD45+CD11cCD11b+Ly6GLy6chi), M1 (CD45+CD11b+F4/80+CD206), M2 (CD45+CD11b+F4/80+CD206+), and Eosinophils (CD45+Siglec-F+Gr1low) in mice spleens (n = 6 mice/group). Data are representative charts or the percentages of individual subjects. Data are expressed as mean ± SE. In general, combined therapy of H-RT+L-TBI significantly reduced the number and diameter of lung metastatic nodules (P < 0.001). (*P < 0.05, **P < 0.01, ***P < 0.001, NS = not significant).
Figure 8
Figure 8
Combination therapy of CT26 tumor with H-RT and L-TBI. (A) CT26-derived tumors model and treatment timeline. Immunocompetent mice were injected s.c. with syngeneic CT26 cells (2.5 × 10⁴) into the right (primary tumor) and left (secondary tumor) flank, respectively. Only the primary tumor received H-RT (n = 12 mice/group). CT26 tumor growth curves of primary irradiated tumors (B) and secondary non-irradiated tumors (C) between different groups (n = 8 mice/group). (D) Overall survival curves of investigation groups (n = 8 mice/group). (*P < 0.05, **P < 0.01, ***P < 0.001, and NS = not significant).

Similar articles

Cited by

References

    1. Lock M, Muinuddin A, Kocha WI, Dinniwell R, Rodrigues G, D'souza D. Abscopal effects: case report and emerging opportunities. Cureus (2015) 7:e344–54. 10.7759/cureus.344 - DOI - PMC - PubMed
    1. Soukup K, Wang X. Radiation meets immunotherapy-a perfect match in the era of combination therapy? Int J Radiat Biol. (2014) 91:299–305. 10.3109/09553002.2014.995383 - DOI - PMC - PubMed
    1. Vatner RE, Cooper BT, Vanpouille-Box C, Demaria S, Formenti SC. Combinations of immunotherapy and radiation in cancer therapy. Front Oncol. (2014) 4:325. 10.3389/fonc.2014.00325 - DOI - PMC - PubMed
    1. Reynders K, Illidge T, Siva S, Chang JY, De Ruysscher D. The abscopal effect of local radiotherapy: using immunotherapy to make a rare event clinically relevant. Cancer Treat Rev. (2015) 41:503–10. 10.1016/j.ctrv.2015.03.01 - DOI - PMC - PubMed
    1. Demaria S, Kawashima N, Yang AM, Devitt ML, Babb JS, Allison JP, et al. . Immune-mediated inhibition of metastases after treatment with local radiation and CTLA-4 blockade in a mouse model of breast cancer. Clin Cancer Res. (2005) 11:728–34. - PubMed

Publication types

MeSH terms

Substances