

Immune Activations and Viral Tissue Compartmentalization During Progressive HIV-1 Infection of Humanized Mice
- PMID: 30873181
- PMCID: PMC6403174
- DOI: 10.3389/fimmu.2019.00340
Immune Activations and Viral Tissue Compartmentalization During Progressive HIV-1 Infection of Humanized Mice
Abstract
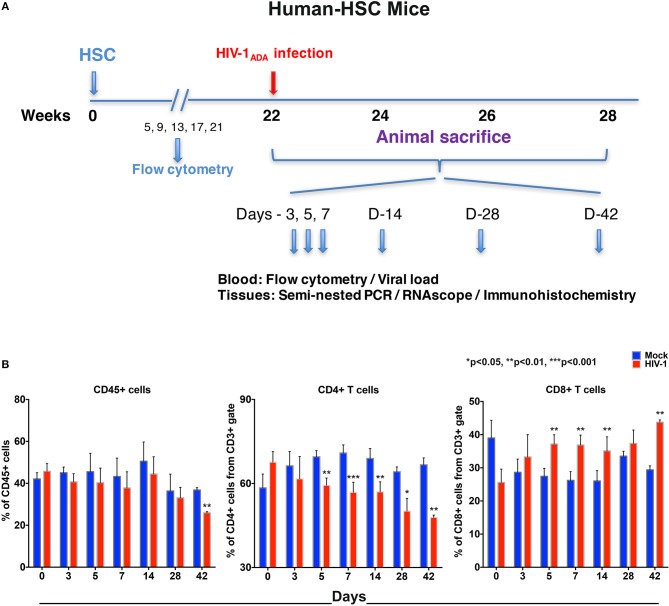
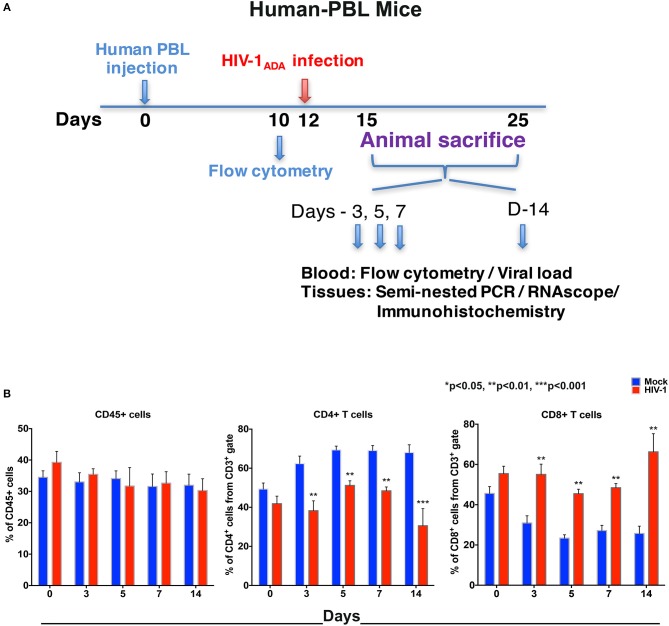
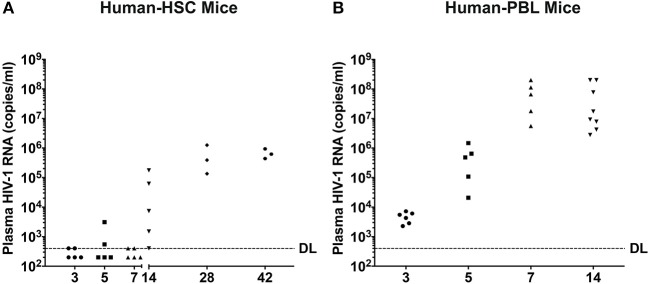
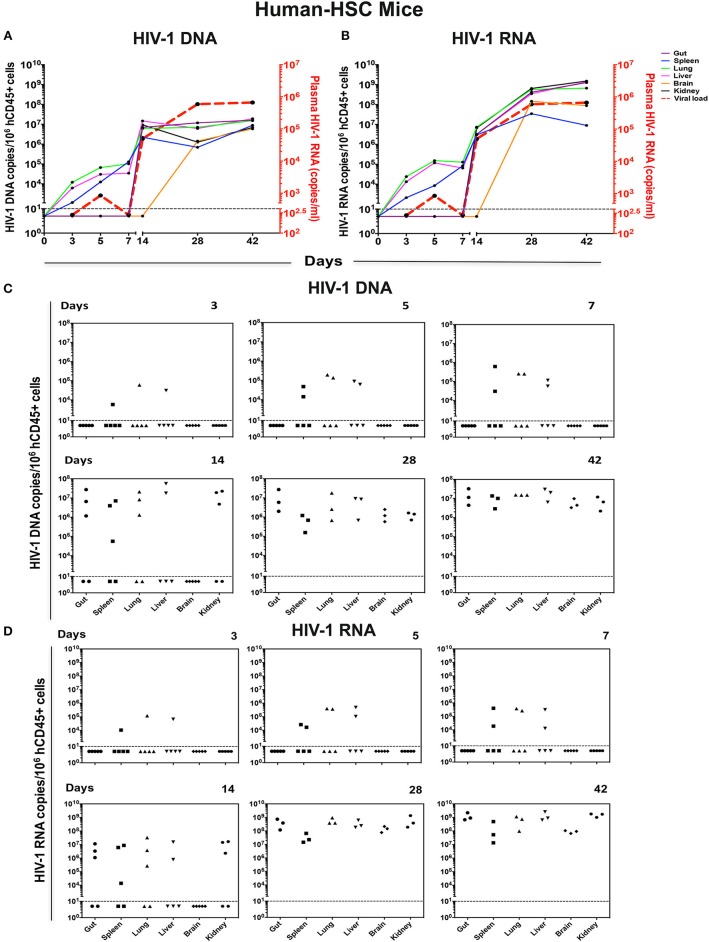
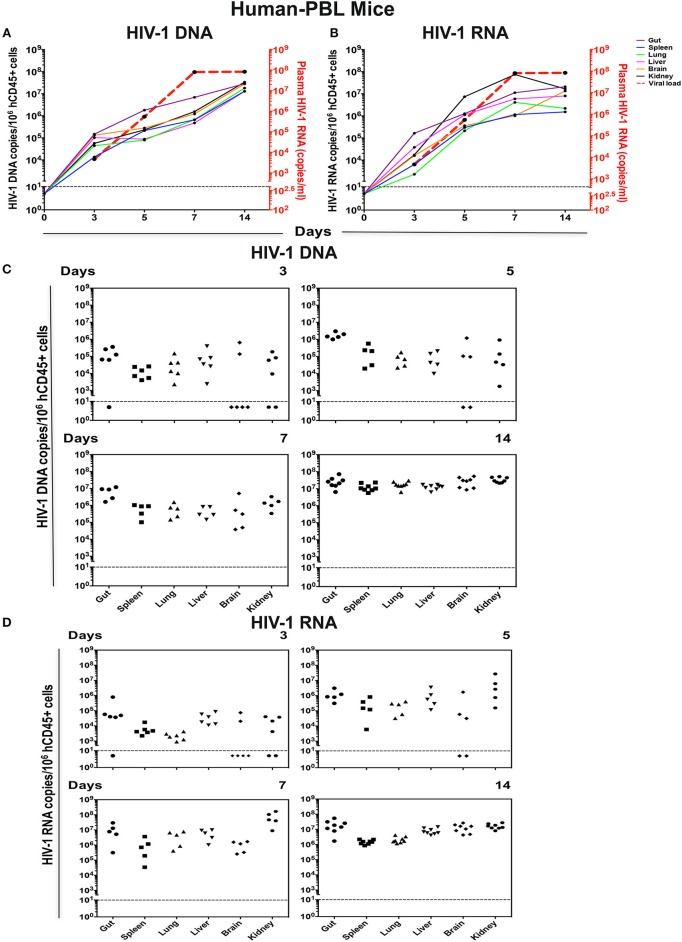
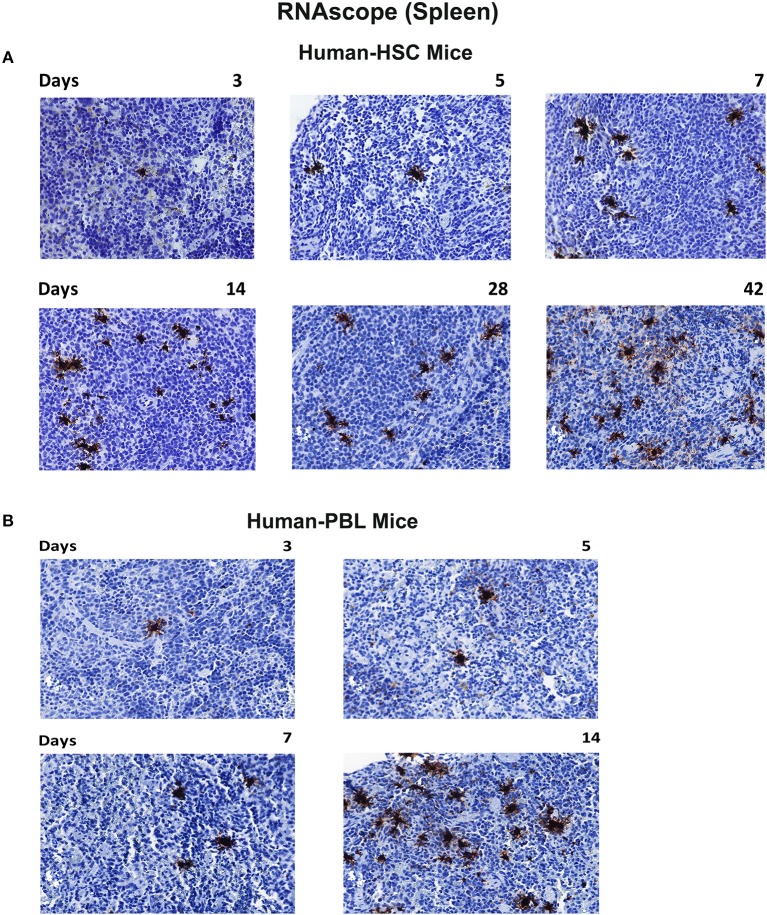
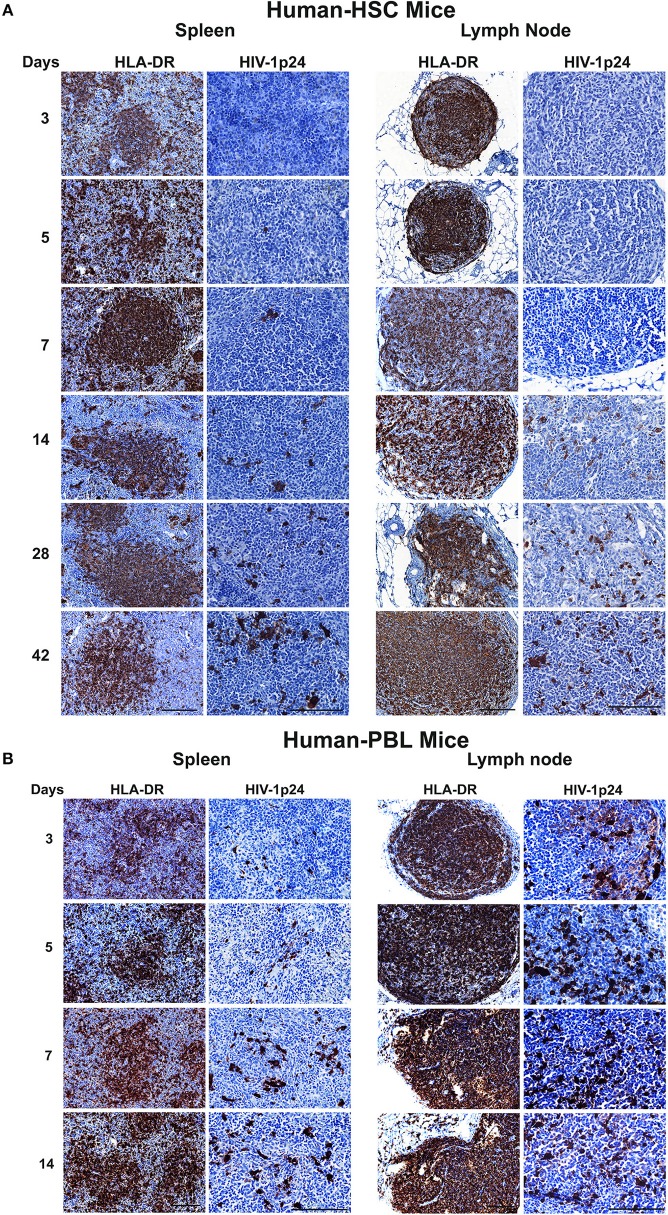
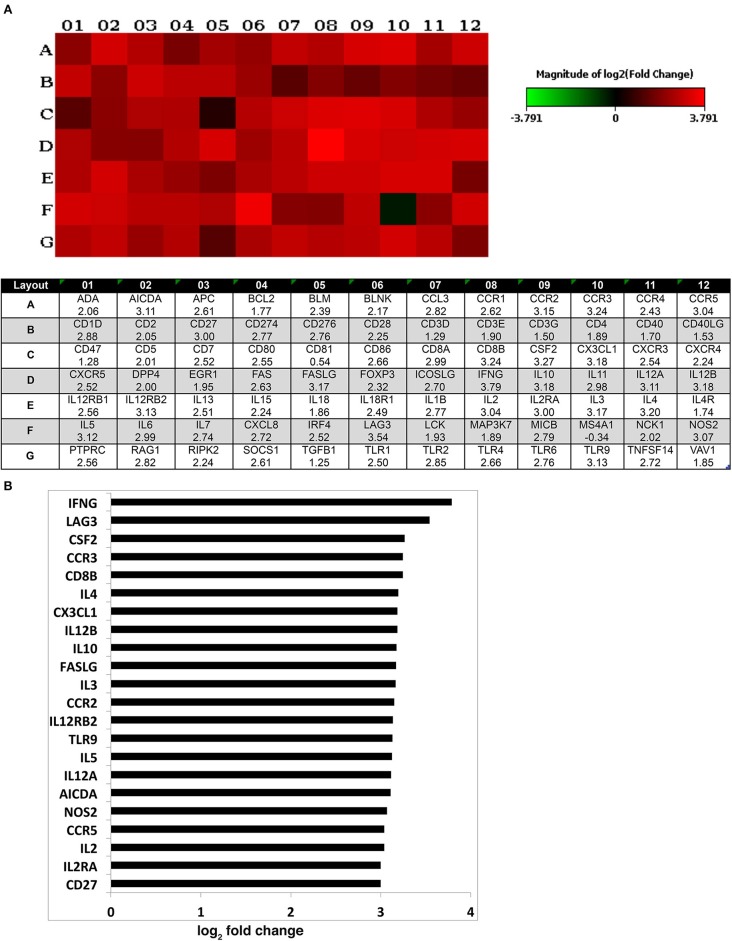
Human immunodeficiency virus type one (HIV-1) tissue compartments are established soon after viral infection. However, the timing in which virus gains a permanent foothold in tissue and the cellular factors that control early viral-immune events are incompletely understood. These are critical events in studies of HIV-1 pathogenesis and in the development of viral reservoirs after antiretroviral therapy. Moreover, factors affecting the permanence of viral-tissue interactions underlie barriers designed to eliminate HIV-1 infection. To this end we investigated the temporal and spatial viral and host factors during HIV-1 seeding of tissue compartments. Two humanized NOD.Cg-Prkdcscid IL2rgtm1Wjl/SzJ mouse models were employed. In the first, immune deficient mice were reconstituted with human CD34+ cord blood hematopoietic stem cells (HSC) (hu-HSC) and in the second mice were transplanted with adult mature human peripheral lymphocytes (hu-PBL). Both, in measure, reflect relationships between immune activation and viral infection as seen in an infected human host. Following humanization both mice models were infected with HIV-1ADA at 104 50% tissue culture infective doses. Viral nucleic acids and protein and immune cell profiles were assayed in brain, lung, spleen, liver, kidney, lymph nodes, bone marrow, and gut from 3 to 42 days. Peripheral CD4+ T cell loss began at 3 days together with detection of HIV-1 RNA in both mouse models after initiation of HIV-1 infection. HIV-1 was observed in all tested tissues at days 3 and 14 in hu- PBL and HSC mice, respectively. Immune impairment was most prominent in hu-PBL mice. T cell maturation and inflammation factors were linked directly to viral tissue seeding in both mouse models. We conclude that early viral tissue compartmentalization provides a roadmap for investigations into HIV-1 elimination.
Keywords: HIV-1 seeding; host immune responses; host inflammatory responses; humanized mice; immune activation; viral tissue compartments.
Figures
Similar articles
-
A mature macrophage is a principal HIV-1 cellular reservoir in humanized mice after treatment with long acting antiretroviral therapy.Retrovirology. 2017 Mar 9;14(1):17. doi: 10.1186/s12977-017-0344-7. Retrovirology. 2017. PMID: 28279181 Free PMC article.
-
HIV-1 infection and CD4 T cell depletion in the humanized Rag2-/-gamma c-/- (RAG-hu) mouse model.Retrovirology. 2006 Nov 1;3:76. doi: 10.1186/1742-4690-3-76. Retrovirology. 2006. PMID: 17078891 Free PMC article.
-
A Simple Mouse Model for the Study of Human Immunodeficiency Virus.AIDS Res Hum Retroviruses. 2016 Feb;32(2):194-202. doi: 10.1089/AID.2015.0211. Epub 2015 Dec 17. AIDS Res Hum Retroviruses. 2016. PMID: 26564392 Free PMC article.
-
Current humanized mouse models for studying human immunology and HIV-1 immuno-pathogenesis.Sci China Life Sci. 2010 Feb;53(2):195-203. doi: 10.1007/s11427-010-0059-7. Epub 2010 Mar 7. Sci China Life Sci. 2010. PMID: 20596827 Free PMC article. Review.
-
Cell-to-Cell Spread of HIV and Viral Pathogenesis.Adv Virus Res. 2016;95:43-85. doi: 10.1016/bs.aivir.2016.03.001. Epub 2016 Apr 4. Adv Virus Res. 2016. PMID: 27112280 Review.
Cited by
-
CEST MRI Affirms HIV-1-Associated Neurometabolic Impairments in a Humanized Mouse Model.Res Sq [Preprint]. 2025 Jul 2:rs.3.rs-6821484. doi: 10.21203/rs.3.rs-6821484/v1. Res Sq. 2025. PMID: 40630517 Free PMC article. Preprint.
-
Comparing Current and Next-Generation Humanized Mouse Models for Advancing HIV and HIV/Mtb Co-Infection Studies.Viruses. 2022 Aug 30;14(9):1927. doi: 10.3390/v14091927. Viruses. 2022. PMID: 36146734 Free PMC article.
-
The development and improvement of immunodeficient mice and humanized immune system mouse models.Front Immunol. 2022 Oct 19;13:1007579. doi: 10.3389/fimmu.2022.1007579. eCollection 2022. Front Immunol. 2022. PMID: 36341323 Free PMC article. Review.
-
HIV-1-Associated Left Ventricular Cardiac Dysfunction in Humanized Mice.Sci Rep. 2020 Jun 16;10(1):9746. doi: 10.1038/s41598-020-65943-9. Sci Rep. 2020. PMID: 32546795 Free PMC article.
-
HIV-1 infection facilitates Alzheimer's disease pathology in humanized APP knock-in immunodeficient mice.NeuroImmune Pharm Ther. 2025 Feb 10;4(1):27-38. doi: 10.1515/nipt-2024-0018. eCollection 2025 Mar. NeuroImmune Pharm Ther. 2025. PMID: 40309515 Free PMC article.
References
-
- Yazdanpanah Y, Fagard C, Descamps D, Taburet AM, Colin C, Roquebert B, et al. . High rate of virologic suppression with raltegravir plus etravirine and darunavir/ritonavir among treatment-experienced patients infected with multidrug-resistant HIV: results of the ANRS 139 TRIO trial. Clin Infect Dis. (2009) 49:1441–9. 10.1086/630210 - DOI - PubMed
Publication types
MeSH terms
Substances
Grants and funding
LinkOut - more resources
Full Text Sources
Medical
Research Materials