Genetic Mapping With Allele Dosage Information in Tetraploid Urochloa decumbens (Stapf) R. D. Webster Reveals Insights Into Spittlebug (Notozulia entreriana Berg) Resistance
- PMID: 30873183
- PMCID: PMC6401981
- DOI: 10.3389/fpls.2019.00092
Genetic Mapping With Allele Dosage Information in Tetraploid Urochloa decumbens (Stapf) R. D. Webster Reveals Insights Into Spittlebug (Notozulia entreriana Berg) Resistance
Erratum in
-
Corrigendum: Genetic Mapping With Allele Dosage Information in Tetraploid Urochloa decumbens (Stapf) R. D. Webster Reveals Insights Into Spittlebug (Notozulia entreriana Berg) Resistance.Front Plant Sci. 2019 Jun 26;10:855. doi: 10.3389/fpls.2019.00855. eCollection 2019. Front Plant Sci. 2019. PMID: 31297129 Free PMC article.
Abstract
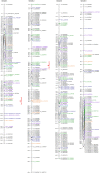
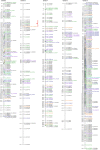
Urochloa decumbens (Stapf) R. D. Webster is one of the most important African forage grasses in Brazilian beef production. Currently available genetic-genomic resources for this species are restricted mainly due to polyploidy and apomixis. Therefore, crucial genomic-molecular studies such as the construction of genetic maps and the mapping of quantitative trait loci (QTLs) are very challenging and consequently affect the advancement of molecular breeding. The objectives of this work were to (i) construct an integrated U. decumbens genetic map for a full-sibling progeny using GBS-based markers with allele dosage information, (ii) detect QTLs for spittlebug (Notozulia entreriana) resistance, and (iii) seek putative candidate genes involved in defense against biotic stresses. We used the Setaria viridis genome a reference to align GBS reads and selected 4,240 high-quality SNP markers with allele dosage information. Of these markers, 1,000 were distributed throughout nine homologous groups with a cumulative map length of 1,335.09 cM and an average marker density of 1.33 cM. We detected QTLs for resistance to spittlebug, an important pasture insect pest, that explained between 4.66 and 6.24% of the phenotypic variation. These QTLs are in regions containing putative candidate genes related to defense against biotic stresses. Because this is the first genetic map with SNP autotetraploid dosage data and QTL detection in U. decumbens, it will be useful for future evolutionary studies, genome assembly, and other QTL analyses in Urochloa spp. Moreover, the results might facilitate the isolation of spittlebug-related candidate genes and help clarify the mechanism of spittlebug resistance. These approaches will improve selection efficiency and accuracy in U. decumbens molecular breeding and shorten the breeding cycle.
Keywords: Brachiaria; SNP; allele dosage; linkage map; polyploidy; quantitative traits; signalgrass.
Figures


Similar articles
-
Corrigendum: Genetic Mapping With Allele Dosage Information in Tetraploid Urochloa decumbens (Stapf) R. D. Webster Reveals Insights Into Spittlebug (Notozulia entreriana Berg) Resistance.Front Plant Sci. 2019 Jun 26;10:855. doi: 10.3389/fpls.2019.00855. eCollection 2019. Front Plant Sci. 2019. PMID: 31297129 Free PMC article.
-
Microsatellite loci for Urochloa decumbens (Stapf) R.D. Webster and cross-amplification in other Urochloa species.BMC Res Notes. 2016 Mar 10;9:152. doi: 10.1186/s13104-016-1967-9. BMC Res Notes. 2016. PMID: 26964874 Free PMC article.
-
High-density linkage map construction and QTL analyses for fiber quality, yield and morphological traits using CottonSNP63K array in upland cotton (Gossypium hirsutum L.).BMC Genomics. 2019 Nov 21;20(1):889. doi: 10.1186/s12864-019-6214-z. BMC Genomics. 2019. PMID: 31771502 Free PMC article.
-
Diverged subpopulations in tropical Urochloa (Brachiaria) forage species indicate a role for facultative apomixis and varying ploidy in their population structure and evolution.Ann Bot. 2022 Nov 17;130(5):657-669. doi: 10.1093/aob/mcac115. Ann Bot. 2022. PMID: 36112370 Free PMC article.
-
An Overview of the Genetics and Genomics of the Urochloa Species Most Commonly Used in Pastures.Front Plant Sci. 2021 Dec 13;12:770461. doi: 10.3389/fpls.2021.770461. eCollection 2021. Front Plant Sci. 2021. PMID: 34966402 Free PMC article. Review.
Cited by
-
A joint learning approach for genomic prediction in polyploid grasses.Sci Rep. 2022 Jul 21;12(1):12499. doi: 10.1038/s41598-022-16417-7. Sci Rep. 2022. PMID: 35864135 Free PMC article.
-
Allele mining in diverse accessions of tropical grasses to improve forage quality and reduce environmental impact.Ann Bot. 2021 Sep 7;128(5):627-637. doi: 10.1093/aob/mcab101. Ann Bot. 2021. PMID: 34320174 Free PMC article.
-
Spittlebug damage on tropical grass and its impact in pasture-based beef production systems.Sci Rep. 2020 Jul 1;10(1):10758. doi: 10.1038/s41598-020-67490-9. Sci Rep. 2020. PMID: 32612122 Free PMC article.
-
A Semi-Automated SNP-Based Approach for Contaminant Identification in Biparental Polyploid Populations of Tropical Forage Grasses.Front Plant Sci. 2021 Oct 22;12:737919. doi: 10.3389/fpls.2021.737919. eCollection 2021. Front Plant Sci. 2021. PMID: 34745171 Free PMC article.
-
High-Resolution Linkage Map With Allele Dosage Allows the Identification of Regions Governing Complex Traits and Apospory in Guinea Grass (Megathyrsus maximus).Front Plant Sci. 2020 Feb 26;11:15. doi: 10.3389/fpls.2020.00015. eCollection 2020. Front Plant Sci. 2020. PMID: 32161603 Free PMC article.
References
-
- Akaike H. (1974). A new look at the statistical model identification. IEEE Trans. Automat. Contr. 19 716–723. 10.1109/TAC.1974.1100705 - DOI
-
- Almeida M. C. D. C., Chiari L., Jank L., Valle C. B. D. (2011). Diversidade genética molecular entre cultivares e híbridos de Brachiaria spp. e Panicum maximum. Ciênc. Rural 41 1998–2003. 10.1590/S0103-84782011001100024 - DOI
-
- Associação Brasileira das Indústrias Exportadoras de Carne [ABIEC] (2016). Perfil da Pecuária do Brasil: Relatório Anual. Available at: http://abiec.siteoficial.ws/images/upload/sumario-pt-010217.pdf
-
- Bargary N., Hinde J., Garcia A. A. F. (2014). “Finite mixture model clustering of SNP data,” in Statistical Modelling in Biostatistics and Bioinformatics eds MacKenzie G., Peng D. (Berlin: Springer International Publishing; ) 139–157. 10.1007/978-3-319-04579-5_11 - DOI
LinkOut - more resources
Full Text Sources
Miscellaneous

