

Phytochrome A Regulates Carbon Flux in Dark Grown Tomato Seedlings
- PMID: 30873186
- PMCID: PMC6400891
- DOI: 10.3389/fpls.2019.00152
Phytochrome A Regulates Carbon Flux in Dark Grown Tomato Seedlings
Abstract
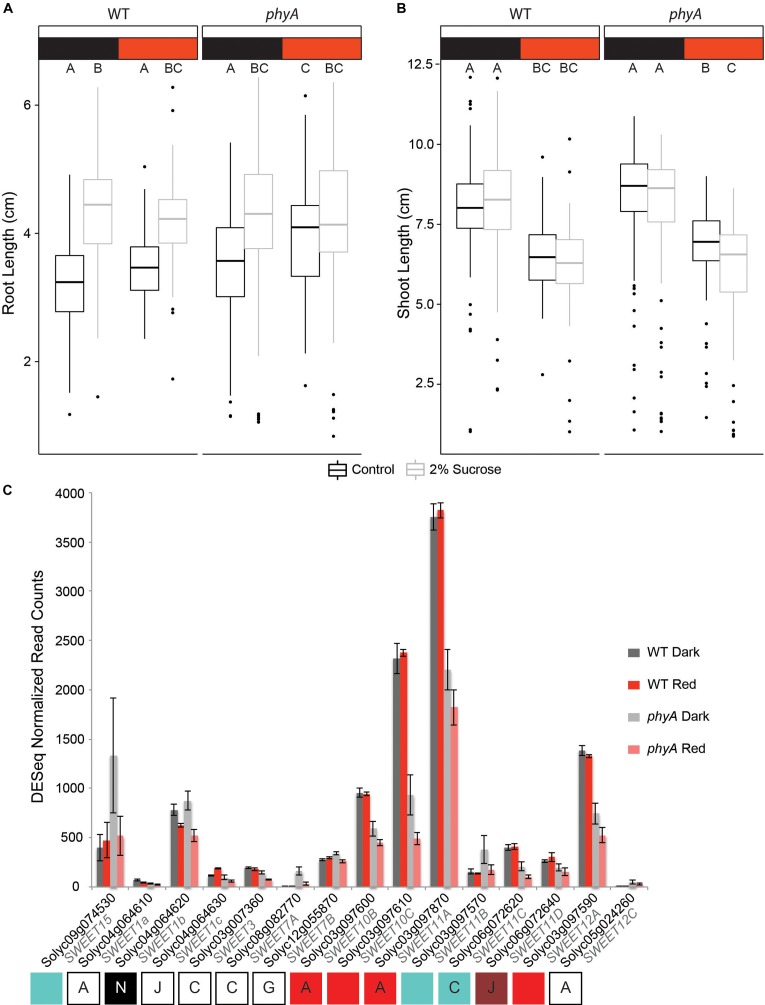
Phytochromes comprise a small family of photoreceptors with which plants gather environmental information that they use to make developmental decisions, from germination to photomorphogenesis to fruit development. Most phytochromes are activated by red light and de-activated by far-red light, but phytochrome A (phyA) is responsive to both and plays an important role during the well-studied transition of seedlings from dark to light growth. The role of phytochromes during skotomorphogenesis (dark development) prior to reaching light, however, has received considerably less attention although previous studies have suggested that phytochrome must play a role even in the dark. We profiled proteomic and transcriptomic seedling responses in tomato during the transition from dark to light growth and found that phyA participates in the regulation of carbon flux through major primary metabolic pathways, such as glycolysis, beta-oxidation, and the tricarboxylic acid (TCA) cycle. Additionally, phyA is involved in the attenuation of root growth soon after reaching light, possibly via control of sucrose allocation throughout the seedling by fine-tuning the expression levels of several sucrose transporters of the SWEET gene family even before the seedling reaches the light. Presumably, by participating in the control of major metabolic pathways, phyA sets the stage for photomorphogenesis for the dark grown seedling in anticipation of light.
Keywords: beta oxidation; glycolysis; photomorphogenesis; phytochrome; primary metabolism; skotomorphogenesis; storage proteins; tricarboxylic acid (TCA) cycle.
Figures


Similar articles
-
Involvement of phytochrome A in suppression of photomorphogenesis in rice seedling grown in red light.Plant Cell Environ. 2013 Dec;36(12):2120-34. doi: 10.1111/pce.12099. Epub 2013 Apr 25. Plant Cell Environ. 2013. PMID: 23495675
-
Phytochrome A is an irradiance-dependent red light sensor.Plant J. 2007 Apr;50(1):108-17. doi: 10.1111/j.1365-313X.2007.03036.x. Epub 2007 Mar 5. Plant J. 2007. PMID: 17346261
-
Light-activated phytochrome A and B interact with members of the SPA family to promote photomorphogenesis in Arabidopsis by reorganizing the COP1/SPA complex.Plant Cell. 2015 Jan;27(1):189-201. doi: 10.1105/tpc.114.134775. Epub 2015 Jan 27. Plant Cell. 2015. PMID: 25627066 Free PMC article.
-
The system of phytochromes: photobiophysics and photobiochemistry in vivo.Membr Cell Biol. 1998;12(5):691-720. Membr Cell Biol. 1998. PMID: 10379648 Review.
-
Regulation of Photomorphogenic Development by Plant Phytochromes.Int J Mol Sci. 2019 Dec 6;20(24):6165. doi: 10.3390/ijms20246165. Int J Mol Sci. 2019. PMID: 31817722 Free PMC article. Review.
Cited by
-
iTRAQ-based proteome profiling revealed the role of Phytochrome A in regulating primary metabolism in tomato seedling.Sci Rep. 2021 Apr 6;11(1):7540. doi: 10.1038/s41598-021-87208-9. Sci Rep. 2021. PMID: 33824368 Free PMC article.
-
Application of Multi-Omics Technologies to the Study of Phytochromes in Plants.Antioxidants (Basel). 2024 Jan 14;13(1):99. doi: 10.3390/antiox13010099. Antioxidants (Basel). 2024. PMID: 38247523 Free PMC article. Review.
-
Phytochrome E Plays a Role in the Suppression of Germination in Far-Red Light in Tomato.Plant Direct. 2025 May 23;9(5):e70079. doi: 10.1002/pld3.70079. eCollection 2025 May. Plant Direct. 2025. PMID: 40417128 Free PMC article.
-
The dark activity of Arabidopsis blue-light receptor CRY2.Sci China Life Sci. 2025 Mar;68(3):887-889. doi: 10.1007/s11427-024-2788-y. Epub 2024 Nov 29. Sci China Life Sci. 2025. PMID: 39625635 No abstract available.
-
Phytochrome-Mediated Light Perception Affects Fruit Development and Ripening Through Epigenetic Mechanisms.Front Plant Sci. 2022 Apr 28;13:870974. doi: 10.3389/fpls.2022.870974. eCollection 2022. Front Plant Sci. 2022. PMID: 35574124 Free PMC article.
References
-
- Alexa A., Rahnenfuhrer J. (2010). Topgo: Enrichment Analysis For Gene Ontology R Package Version 2.18.0.
LinkOut - more resources
Full Text Sources