Review
. 2015 Jul 19;1(1):6-21.
eCollection 2015 Jul 20.

Survey and critical appraisal of pharmacological agents with potential thermo-modulatory properties in the context of artificially induced hypometabolism

Affiliations
Review

Survey and critical appraisal of pharmacological agents with potential thermo-modulatory properties in the context of artificially induced hypometabolism

Marcel C Dirkes et al. J Clin Transl Res. .

Abstract

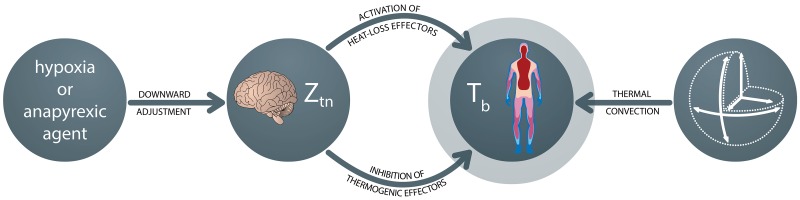
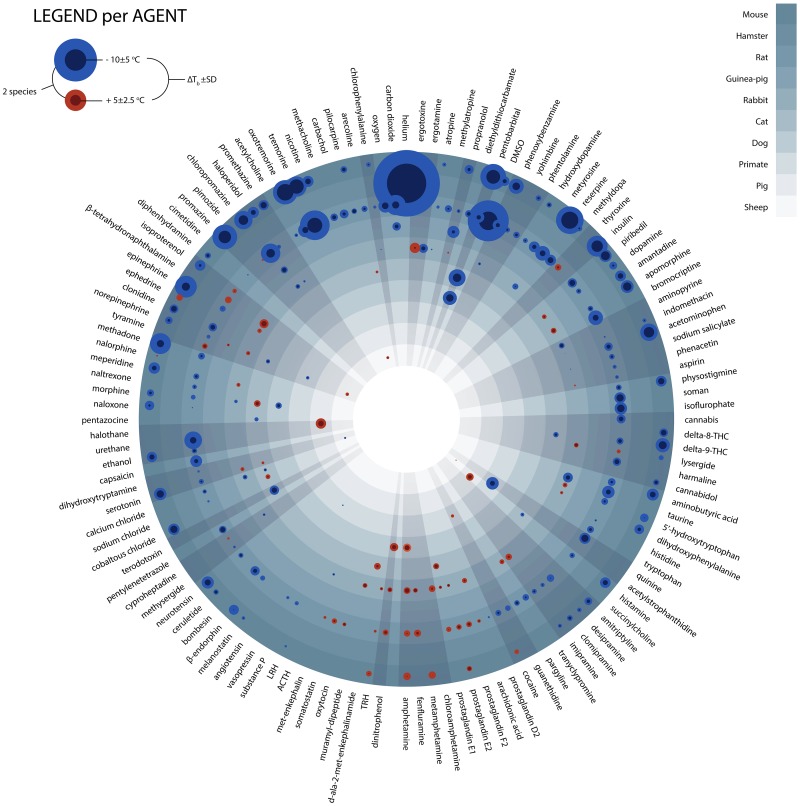
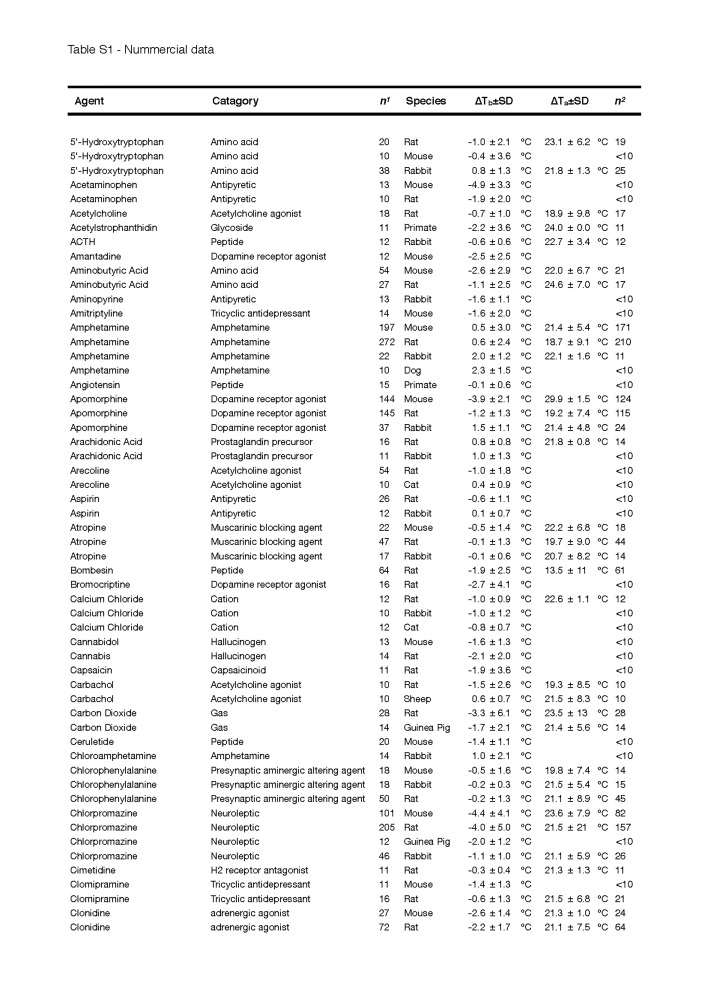
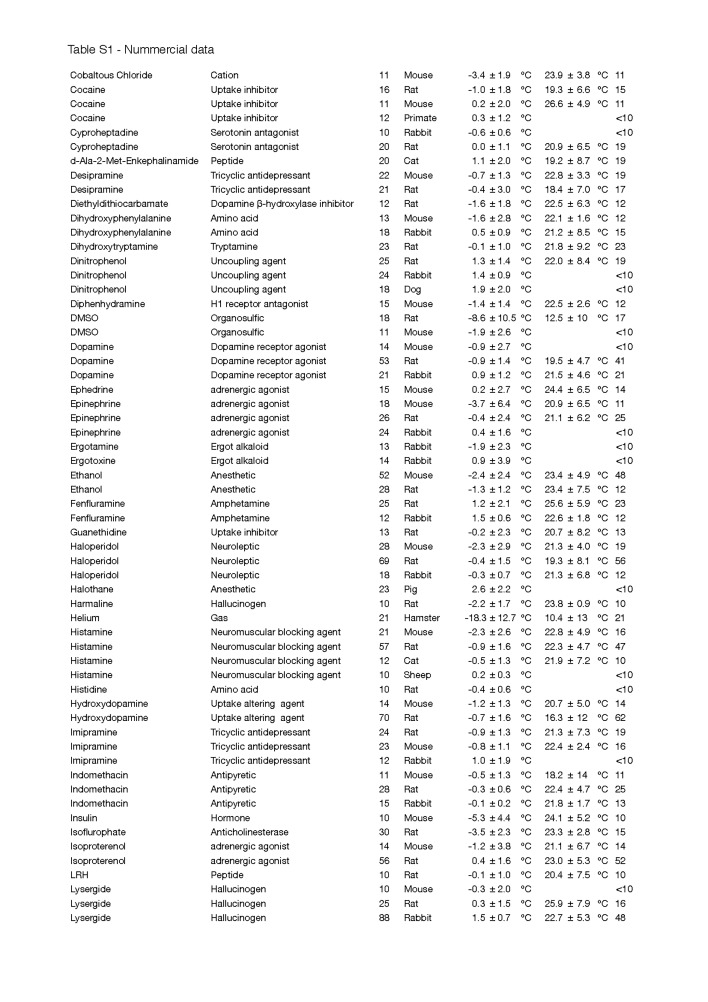
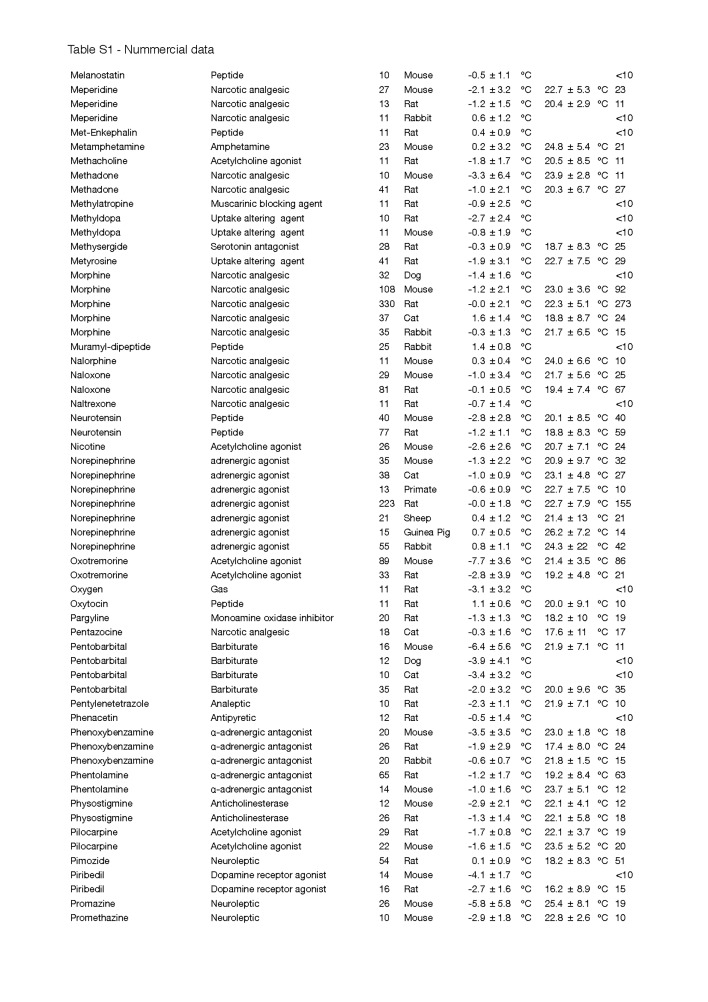
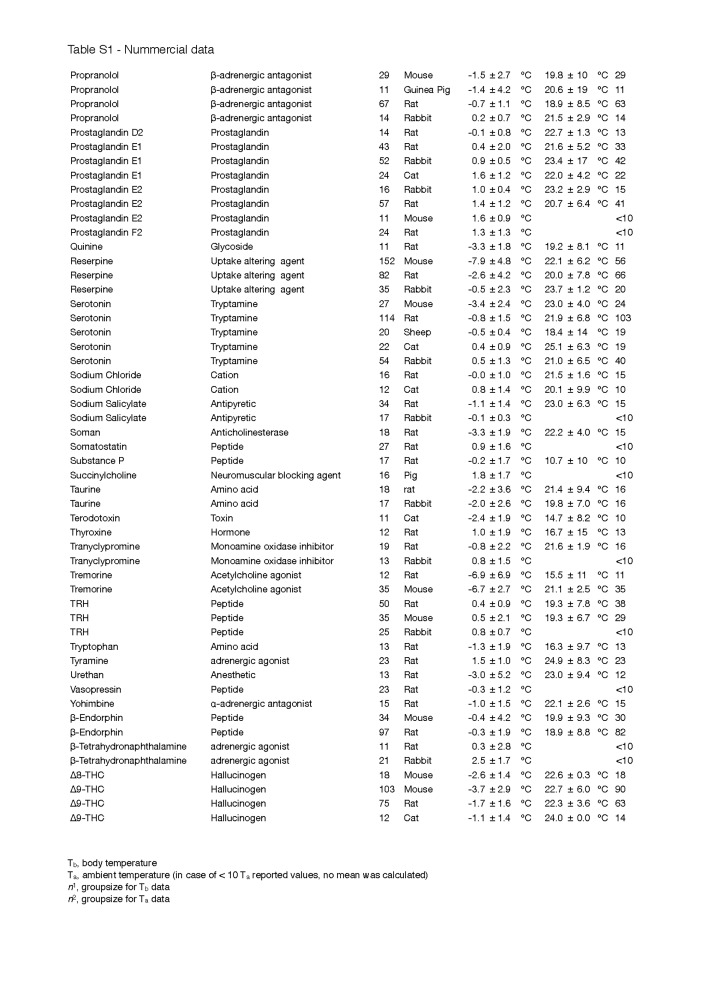
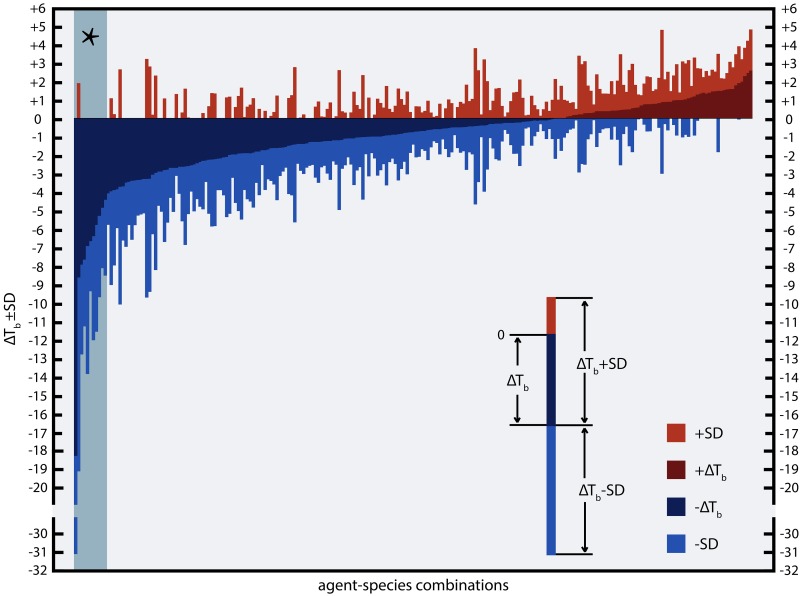
A reduction in body temperature can be achieved by a downward adjustment of the termoneutral zone, a process also described as anapyrexia. Pharmacological induction of anapyrexia could enable numerous applications in medicine. However, little is known about the potential of pharmacological agents to induce anapyrexic signaling. Therefore, a review of literature was performed and over a thousand pharmacologically active compounds were analyzed for their ability to induce anapyrexia in animals. Based on this analysis, eight agents (helium, dimethyl sulfoxide, reserpine, (oxo)tremorine, pentobarbital, (chlor) promazine, insulin, and acetaminophen) were identified as potential anapyrexia-inducing compounds and discussed in detail. The translational pitfalls were also addressed for each candidate compound. Of the agents that were discussed, reserpine, (oxo)tremorine, and (chlor) promazine may possess true anapyrexic properties based on their ability to either affect the thermoneutral zone or its effectors and facilitate hypothermic signaling. However, these properties are currently not unequivocal and warrant further examination in the context of artificially-induced hypometabolism.

Keywords: animals; body temperature; hypothermia induction; pharmacological agents; thermoneutral zone.


Figures

Figure 1.
Figure 1.. Regulation of body temperature (Tb) through change of the thermoneutral zone (Ztn). The first sphere on the left indicates an initial external trigger, which may be an environmental stimulus such as hypoxia or a pharmacological agent with anapyrexic properties. These triggers can lead to a downward adjustment of the Ztn (second sphere). In turn, the reduction of the Ztn leads to activation of heat loss mechanisms (sweating, behavioral adaptation, panting, vasodilation) and inhibition of thermogenesis (shivering, activation of brown adipose tissue, behavioral adaptation, vasoconstriction, piloerection), resulting in a reduction of Tb (third sphere). The extent of Tb reduction is dependent on the rate of thermal convection, which in turn is dependent on the body surface:volume ratio (fourth sphere).
Figure 2.
Figure 2.. Change in Tb upon exposure to pharmacological agents. All presented data are derived from reviews published by Clark et al. [29-36]. These reviews total 18,808 reports on changes in Tb (ΔTb) following exposure to a biochemical agent. All avian (628 reports), aquatic (46 reports), reptilian (31 reports), and naturally hibernating species (164 reports) were excluded on the basis that they are intrinsically endowed with different mechanisms regarding thermoregulation and hypometabolism [37]. All reports of human ΔTb (1,285 reports) were excluded on the basis that they are not likely to be performed under standardized or controlled circumstances. All reports including a pre-existing febrile state (2,680 reports) were excluded on the rationale that these do not reflect an effect on healthy individuals and possibly only affect an increased Ztn. All reports with no quantitative data were excluded (6,591 reports). In case of multiple data points, the largest ΔTb was included. To improve the validity of Tb values, all agents that had < 10 reports within one species were also excluded. The final dataset, consisting of ≥10 reports/agent/species, was used for analysis and visualization. Data analysis was performed in Matlab R2011a (Mathworks) and graphically processed in Adobe InDesign CS5 (Adobe). The ΔTbs are plotted as bicolored spheres, whereby cooling is indicated in blue and heating in red. The mean ΔTb of each agent per species (n ≥ 10) is represented by the inner diameter of the sphere. The difference between the inner and outer diameter of the sphere represents the standard deviation. All spheres are projected against a layered concentric background, whereby each layer (separated by different shades of gray) represents a species as indicated in the legend (upper right). The agents are grouped according to the classification used in the original manuscripts, delineated by the outward radiating gray areas. For better viewing, the figure is also provided online as supplemental Figure 1.
Table S1
Table S1. Nummercial data
Table S1
Table S1. Nummercial data
Table S1
Table S1. Nummercial data
Table S1
Table S1. Nummercial data
Table S2
Table S2. Species distribution
Figure 3.
Figure 3.. (A) Change in core body temperature (ΔTb) per species plotted as a function of compound with the most profound effect on Tb (1, x-axis) to the compound with the least effect on Tb (up to 70, x-axis). The ΔTb represents the mean of all ΔTbs reported for the respective compound in the respective species that were included in the analysis. Research data were included on the basis of the criteria described in section 3 and the legend of Figure 2. The complete data set containing all the species is provided in Table S3. The data were normalized to the maximum and minimum common body weights (BW) of laboratory mice (B), rats (C), and rabbits (D) and should be read vertically per compound, whereby the upper limit is the minimum ΔTb for the heaviest animals. The actual recorded values fall between the upper and lower bounds per compound. Note the different y-axis scaling of the inset plots. Common body weights were obtained from the internet (e.g., laboratory animal providers such as Harlan and Charles River).
Figure 4.
Figure 4.. Ranked effect size of the change in Tb following exposure of an animal to a pharmacological agent. For the source of the data and inclusion criteria see the legend of Figure 2. All agent-species combinations (x-axis) were ranked by mean effect size (y-axis) with standard deviations (see legend within panel). The section marked with an asterix (*, top left) marks the agents that are discussed in more detail.

Similar articles

Cited by

References

    1. Steiner AA, Branco LG. Hypoxia-induced anapyrexia: implications and putative mediators. Annu Rev Physiol. 2002;64:263–288. - PubMed
    1. Cerri M, Zamboni G, Tupone D, Dentico D, Luppi M, Martelli D, Perez E, Amici R. Cutaneous vasodilation elicited by disinhibition of the caudal portion of the rostral ventromedial medulla of the free-behaving rat. Neuroscience. 2010;165:984–995. - PubMed
    1. Maingret F, Lauritzen I, Patel AJ, Heurteaux C, Reyes R, Lesage F, Lazdunski M, Honore E. TREK-1 is a heat-activated background K(+) channel. EMBO J. 2000:19, 2483–2491. - PMC - PubMed
    1. Crawshaw L, Grahn D, Wollmuth L, Simpson L. Central nervous regulation of body temperature in vertebrates: comparative aspects. Pharmacol Ther. 1985;30:19–30. - PubMed
    1. Cerri M, Mastrotto M, Tupone D, Martelli D, Luppi M, Perez E, Zamboni G, Amici R. The inhibition of neurons in the central nervous pathways for thermoregulatory cold defense induces a suspended animation state in the rat. J Neurosci. 2013;33:2984–2993. - PMC - PubMed

LinkOut - more resources