. 2015 Sep 30;1(2):78-93.

The physiology of artificial hibernation

Affiliations

The physiology of artificial hibernation

Marcel C Dirkes et al. J Clin Transl Res. .

Abstract

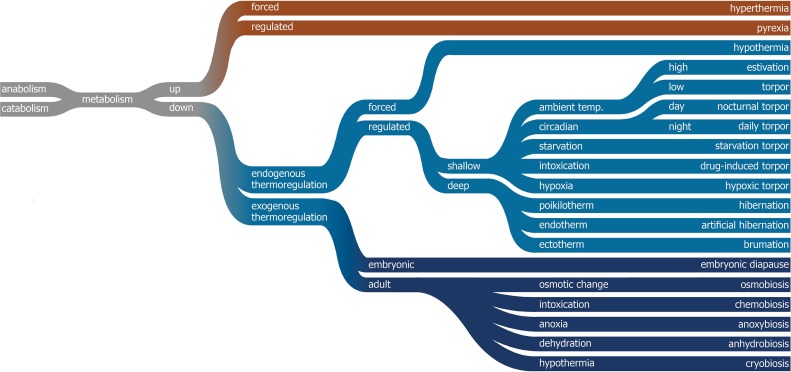
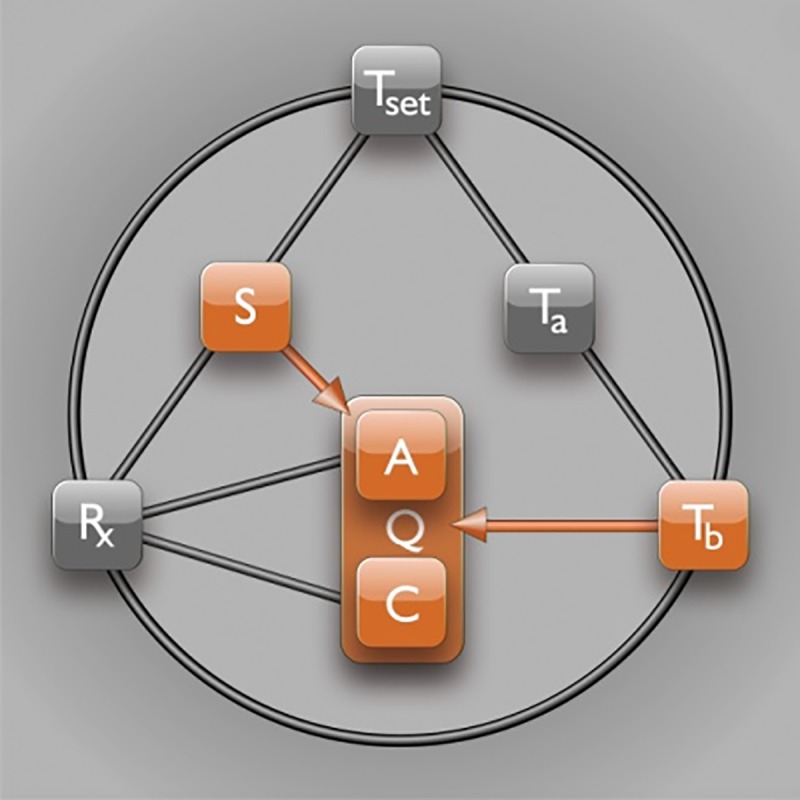
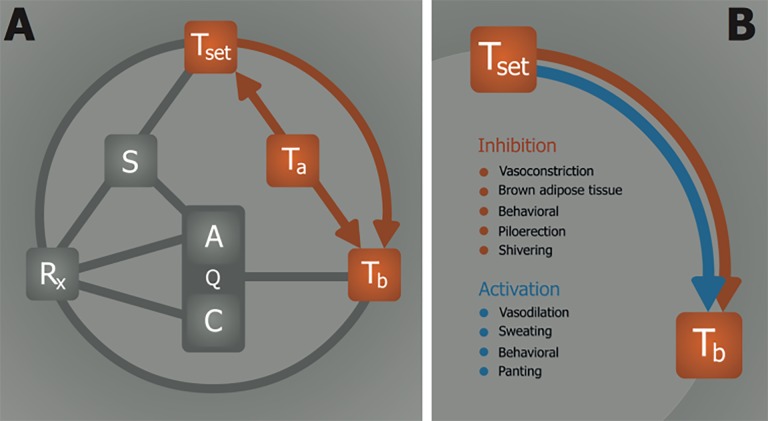
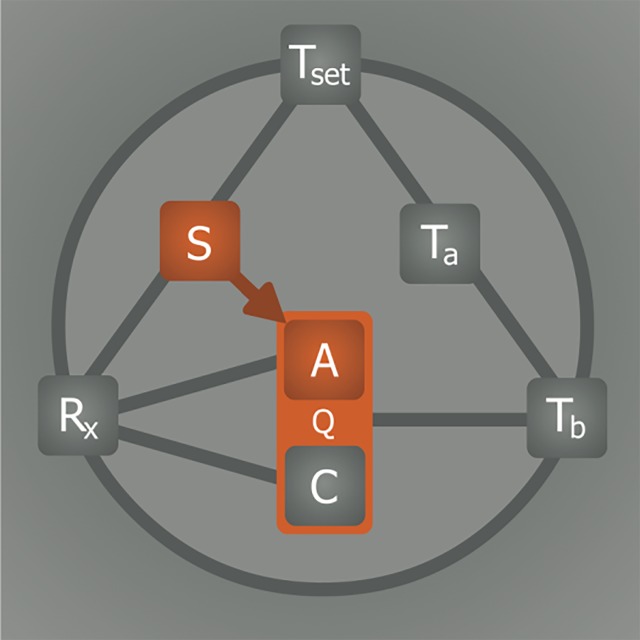
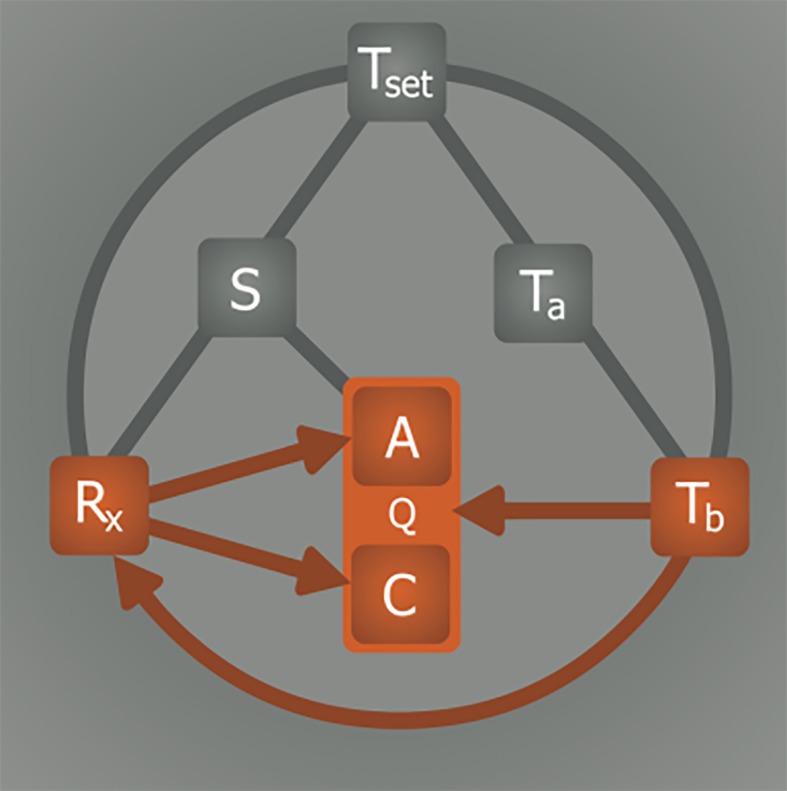
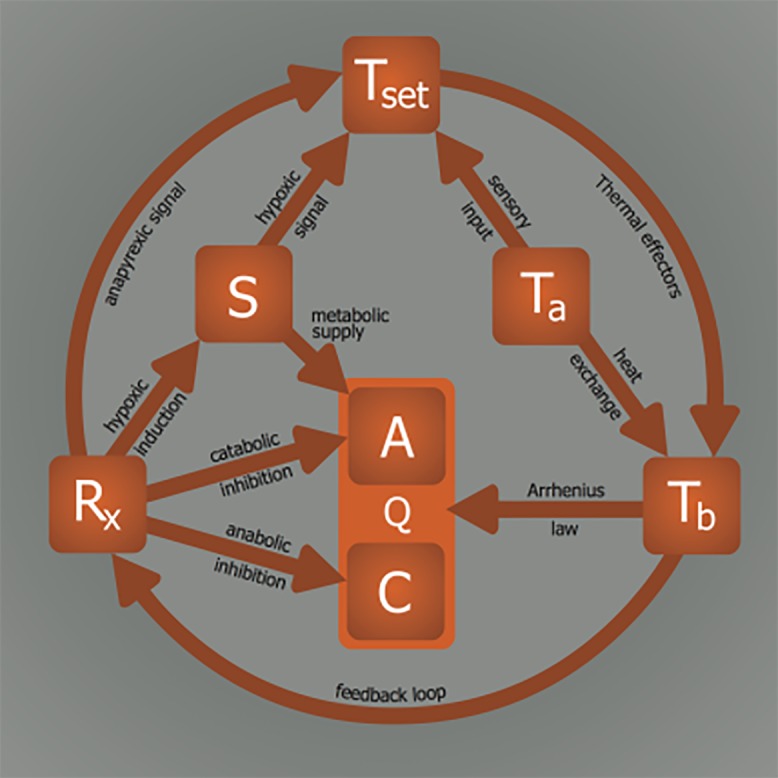
Incomplete understanding of the mechanisms responsible for induction of hibernation prevent translation of natural hibernation to its artificial counterpart. To facilitate this translation, a model was developed that identifies the necessary physiological changes for induction of artificial hibernation. This model encompasses six essential components: metabolism (anabolism and catabolism), body temperature, thermoneutral zone, substrate, ambient temperature, and hibernation-inducing agents. The individual components are interrelated and collectively govern the induction and sustenance of a hypometabolic state. To illustrate the potential validity of this model, various pharmacological agents (hibernation induction trigger, delta-opioid, hydrogen sulfide, 5'-adenosine monophosphate, thyronamine, 2-deoxyglucose, magnesium) are described in terms of their influence on specific components of the model and corollary effects on metabolism. Relevance for patients: The ultimate purpose of this model is to help expand the paradigm regarding the mechanisms of hibernation from a physiological perspective and to assist in translating this natural phenomenon to the clinical setting.

Keywords: Arrhenius law; anapyrexia; body temperature; hypometabolic agents; hypometabolism; hypoxia; natural hibernation; thermal convection; thermoneutral zone; torpor.


Conflict of interest statement

The authors declare that there are no conflicts of interest present.

Figures

Figure 1.
Figure 1.. Classification of the different types of hyper- and hypometabolism and the official biological vernacular. Endogenous thermoregulation occurs through the modulation of the thermoneutral zone (Ztn) and thermal effectors, whereas exogenous thermoregulation is dependent on the ambient temperature (Ta) and exogenous triggers but not the Ztn.
Figure 2.
Figure 2.. Substrate and temperature effects on metabolism. The S—Q relationship relies on substrate (S) availability to support anabolism (A). The Tb—Q relationship is dictated by the Arrhenius equation (Equation 1, where k is equal to Q in this model), which governs the relation between body temperature (Tb) and chemical reaction speed (Q). Catabolism (C) is directly affected by Tb, but not by S.
Figure 3.
Figure 3.. The relationship between the thermoneutral zone and temperature. (A) Overview of thermoregulatory processes. The Ta—Tb relationship represents heat exchange between ambient (Ta) and body temperature (Tb). Information on the Ta is processed and translated into a thermoneutral zone (Ztn) through the Ta—Ztn relationship, whereby the Ztn maintains Tb by regulating thermal effector activity via the Ztn—Tb relationship. (B) Summary of thermal effectors that are mediated by the Ztn—Tb relationship. The Ztn activates thermogenic processes (red) when the Tb < Ztn and heat loss mechanisms (blue) when the Tb > Ztn.
Figure 4.
Figure 4.. Effects of hypoxia on metabolism. Metabolism (Q) is controlled by substrate (S) availability. Lowering of oxygen availability (hypoxia) directly inhibits anabolism (A, i.e., ATP production) but not catabolism (C, i.e., ATP consumption). Consequently, the metabolic tolerance of hypoxia is limited by the extent to which C can be sustained in the absence of A.
Figure 5.
Figure 5.. Induction of hypometabolism by hypoxia in mice. An experiment was conducted that exemplifies the reduction in temperature (measured with a thermal camera) and metabolism (measured by exhaled CO2 levels) following exposure of mice (Mus musculus) to hypoxia. The mouse was placed in an air-tight container with an inlet coupled to a gas cylinder containing either an O2:N2 mixture of 21% O2 (to induce normoxic conditions, N) or an O2:N2 mixture of 5% O2 (to induce hypoxic conditions, H). The container was purged with the normoxic or hypoxic gas mixture at a flow rate of 1 L/min. The container also had a gas outlet that was coupled to a CO2 sensor (model 77535 CO2 meter, AZ Instrument, Taichung City, Taiwan). After a 30-min stabilization period under normoxic conditions, hypoxia was induced for 3.5 h, after which the container was changed back to normoxic conditions and the mouse was allowed to recover for an additional 3 h. The ambient temperature (Ta) was maintained at 23.4 ±0.3 °C. During the experiment the mouse was imaged with a thermal camera (Inframetrics, Kent, UK), whereby dark pixels indicate low temperatures and light pixels indicate high temperatures. The frame designations correspond to the lettering in the CO2 production chart to indicate the time point and phase at which the images were acquired. Upon induction of a hypoxic environment, the body temperature (Tb) of the mouse dropped (B), as evidenced by the decreased Tb-Ta contrast between 0.5 h and 4 h. Following restoration of normoxic conditions (C), the animal’s Tb gradually returned to baseline levels. The right panel shows the CO2 profile during normoxia and hypoxia, whereby the hypoxic phase is clearly associated with reduced levels of exhaled CO2, which constitutes a hallmark of hypometabolism.
Figure 6.
Figure 6.. Hypoxia-induced hypometabolism via anapyrexic signaling. (A) The onset of hypoxia, i.e., low substrate (S = oxygen) levels, is proposed to modulate the thermoneutral zone (Ztn) downward via a so-called hypoxic link. The lowering of the Ztn inhibits thermogenesis and activates heat loss mechanisms through the Ztn—Tb relationship, allowing heat exchange between body temperature (Tb) and ambient temperature (Ta) to occur. The consequent reduction in Tb slows down both anabolic (A) and catabolic (C) metabolism (Q) as described in Figure 2. (B) Pathways leading to anapyrexia via the Rx—Ztn and S—Ztn relationships. Although this relationship is exemplified for hypoxic conditions, where S comprises oxygen, it may also apply to conditions where another S is reduced, such as glucose during periods of starvation. Prolonged hypoglycemia is known to also induce hypometabolism, as addressed in section 2.5.4. A direct anapyrexic pathway is suggested for Rx—Ztn, where a neuroactive agent such as delta-opioids directly lowers the Ztn (section 2.5.5). Alternatively, an Rx such as H2S can also affect the Ztn without affecting S availability by inducing hypoxic signaling through oxygen sensors such as carotid bodies (section 2.5.1).
Figure 7.
Figure 7.. The effect of hibernation induction trigger on metabolic activity. It has been suggested that metabolism (Q) may be directly inhibited by pharmacological agents (Rx) such as hibernation induction trigger (HIT) via inhibition of anabolism (A) and/or catabolism (C). It should be underscored that, based on the information presented in sections 2.2 and 2.4, this pathway is unlikely to occur in the absence of hypothermic signaling via Ztn downmodulation.
Figure 8.
Figure 8.. Physiological effects of hibernation inducing agents. Overview of physiological effects in response to 2-deoxyglucose (2-DG), 5’-adenosine monophosphate (5’-AMP), hydrogen sulfide (H2S), hibernation induction trigger (HIT), delta-opioid (DOP), and thyronamine (TAM). Each effect is represented by a black dot (lowering of value), transparent square (equal value), or black triangle (rise of value). The effects are stratified according to the size of the animal, from outer ring to inner ring these are: < 0.1 kg (e.g., mouse), 0.1-1 kg (e.g., rat), 1-10 kg (e.g., macaque) and > 10 kg (e.g., pig). The inner white ring indicates the respective reference (number) and species (letter). Animals: A, house mouse (Mus musculus, Linnaeus), B, deer mouse (Peromyscus maniculatus, Wagner); C, djungarian hamster (Phodopus sungorus, Pallas); D, common rat (Rattus novergicus, Berkenhout); E, thirteen-lines ground squirrel (Spermophilus tridecemlineatus, Mitchill); F, domestic dog (Canis lupus familiaris, Linnaeus); G, rhesus macaque (Macaca mulatta, Zimmermann) or southern pig-tailed macaque (Macaca nemestrina, Linnaeus); H, domestic pig (Sus scrofa domesticus, Erxleben); I, sheep (Ovis aries, Linnaeus). The physiological parameters include: Tb, core body temperature; VO2, oxygen consumption; M, motion; RR, respiratory rate; HR, heart rate; U, urine production; BP, blood pressure; RQ, respiratory quotient; CO, cardiac output; CO2, carbon dioxide production; PP, pulmonary pressure. All parameters are expected to be reduced during hypometabolism.
Figure 9.
Figure 9.. Signal amplifying feedback loop during hypometabolic induction. Theoretically, lowering of the body temperature (Tb) could be part of a feedback system that triggers the release of a metabolism inhibiting agent (Rx) capable of further lowering metabolism (Q) via direct inibition of anabolism (A) and/or catabolism (C). This process is embodied by the Tb—Rx— Q relationship.
Figure 10.
Figure 10.. Electrolyte changes during induction of natural hibernation. Analysis of blood levels of magnesium (Mg2+, serum n = 23, muscle n = 9), calcium (Ca2+, serum n = 19, muscle n = 5), sodium (Na+, serum n = 16, muscle n = 6), potassium (K+, serum n = 25, muscle n = 9), and chloride (Cl, serum n = 9, muscle n = 3) from summer active state to hibernation (< 1, reduction upon induction into hibernation; 1, no change; > 1, increase in electrolyte concentration). Black bars correspond to serum electrolyte levels, grey bars indicate electrolyte levels in muscle tissue. Animals included in this figure are: European hedgehog (Erinaceus europaeus, Linnaeus) [114-116], long-eared hedgehog (Hemiechinus auritus, Gmelin) [117], golden hamster (Mesocricetus auratus, Waterhouse) [118-122], common box turtle (Terrapene carolina, Linnaeus) [123], pond slider (Trachemys scripta, Thunberg) [123], painted turtle (Chrysemys picta, Schneider) [124-127], European ground squirrel (Spermophilus citellus, Linneaus) [128], thirteen-lined ground squirrel (Spermophilus tridecemlineatus, Mitchill) [121, 122, 129], groundhog (Marmota monax, Linneaus) [130, 131], yellow-bellied marmot (Marmota flaviventris, Audubon & Backman) [132], Asian common toad (Duttaphrynus melanostictus, Schneider) [133], little brown bat (Myotis lucifugus, LeConte) [122, 134, 135], big brown bat (Eptesicus fuscus, Palisot de Beauvois) [122;134], American black bear (Ursus americanus, Pallas) [122], common musk turtle (Sternotherus odoratus, Latreille) [136], desert monitor (Varanus griseus, Daudin) [137]. Statistical analysis was performed in MatLab R2011a. Intragroup analysis of serum versus muscle electrolyte levels (Mann-Whitney U test: p-value): Mg2+, p < 0.001; Ca2+, p = 0.395; Na+, p = 0.299; K+, p = 0.067; Cl, p = 0.315. Intergroup analysis of serum electrolyte levels, indicating statistical differences (Kruskal-Wallis test): Mg2+ versus Ca2+, Na+, K+, and Cl, (p < 0.05).
Figure 11.
Figure 11.. Model for induction of (artificial) hypometabolism. Depicted parameters: Q, overall metabolism defined as chemical reaction speed (i.e., similar to k in Equation 1); C, catabolism; A, anabolism; Tb, core body temperature; Ta, ambient temperature; Ztn, thermoneutral zone; S, substrate; Rx, (bio)chemical agent able to induce hypometabolism. The relationships: Tb—Q, Arrhenius law; Ta—Tb, heat exchange; Ztn—Tb, thermogenesis and heat loss mechanisms; Ta—Ztn, sensory input; S—Ztn, hypoxic link; Rx— S, hypoxia/hypoglycemia induction; Rx—C, catabolic modulation; Rx—A, anabolic modulation; Rx—Ztn, anapyrexic signal; S—A, metabolic substrate supply; Tb—Rx, positive/negative feedback loop.

Similar articles

Cited by

References

    1. Geiser F. Metabolic rate and body temperature reduction during hibernation and daily torpor. Annu Rev Physiol. 2004;66:239–274. - PubMed
    1. Hudson JW, Scott IM. Daily torpor in the laboratory mouse, Musmusculus var. albino. Physiological Zoology. 1979;52:205–218.
    1. Blackstone E, Morrison M, Roth MB. H2S induces a suspended animation-like state in mice. Science. 2005;308:518. - PubMed
    1. Dark J, Miller DR, Zucker I. Reduced glucose availability induces torpor in Siberian hamsters. Am J Physiol. 1994;267:R496–R501. - PubMed
    1. Horton ND, Kaftani DJ, Bruce DS, Bailey EC, Krober AS, Jones JR, Turker M, Khattar N, Su TP, Bolling SF, Oeltgen PR. Isolation and partial characterization of an opioid-like 88 kDa hibernation-related protein. Comp Biochem Physiol B Biochem Mol Biol. 1998;119:787–805. - PubMed

LinkOut - more resources