. 2017 May 24;3(2):276-282.

FITC-linked Fibrin-Binding Peptide and real-time live confocal microscopy as a novel tool to visualize fibrin(ogen) in coagulation

Affiliations

FITC-linked Fibrin-Binding Peptide and real-time live confocal microscopy as a novel tool to visualize fibrin(ogen) in coagulation

Nikolaj Weiss et al. J Clin Transl Res. .

Abstract

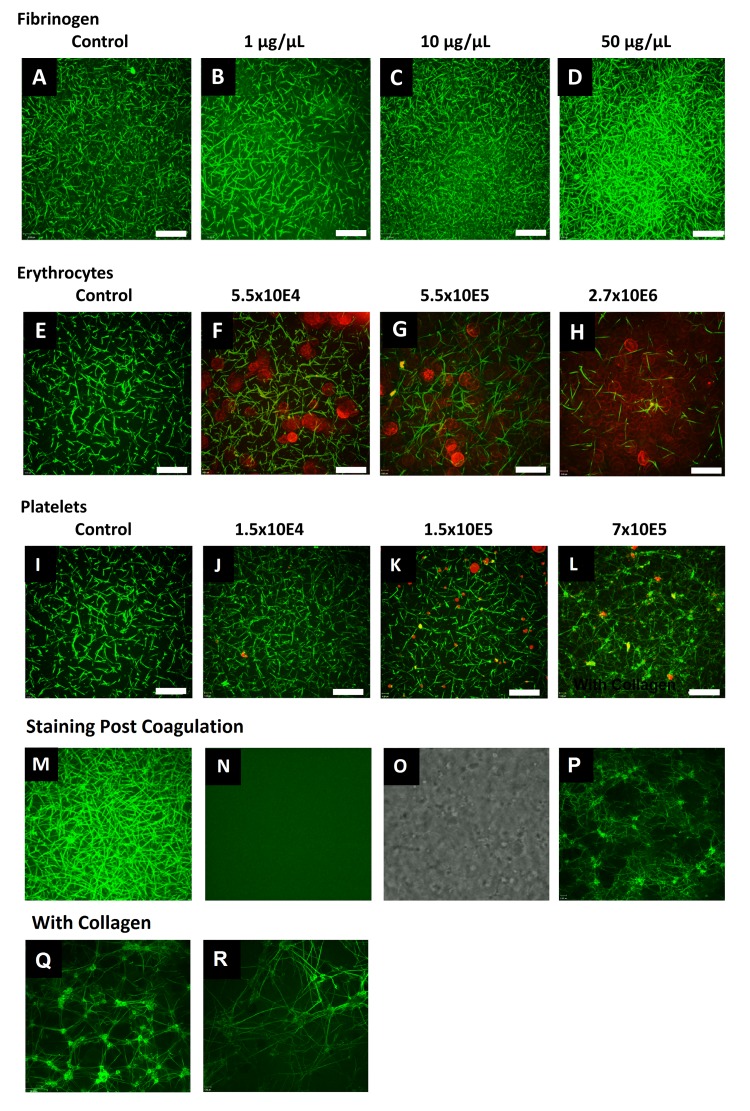
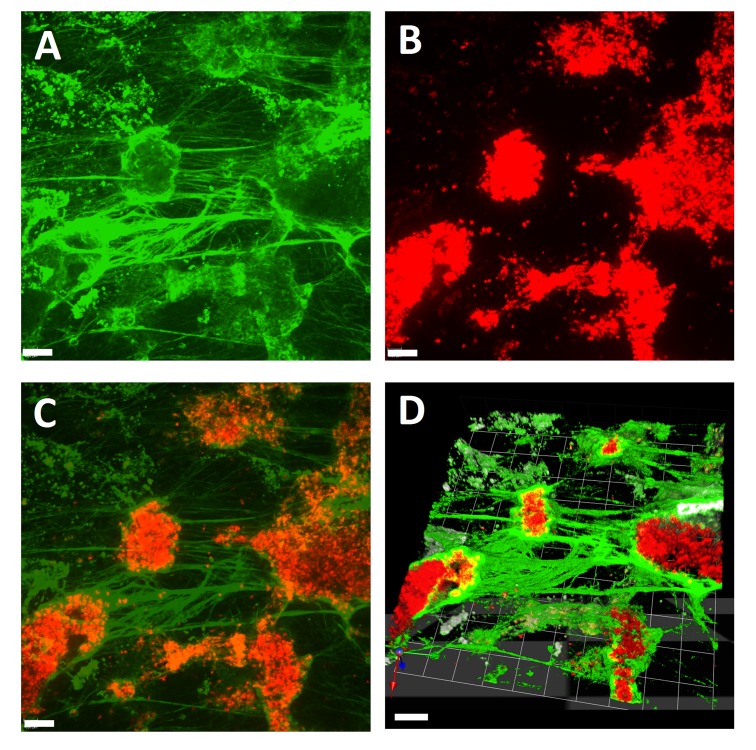
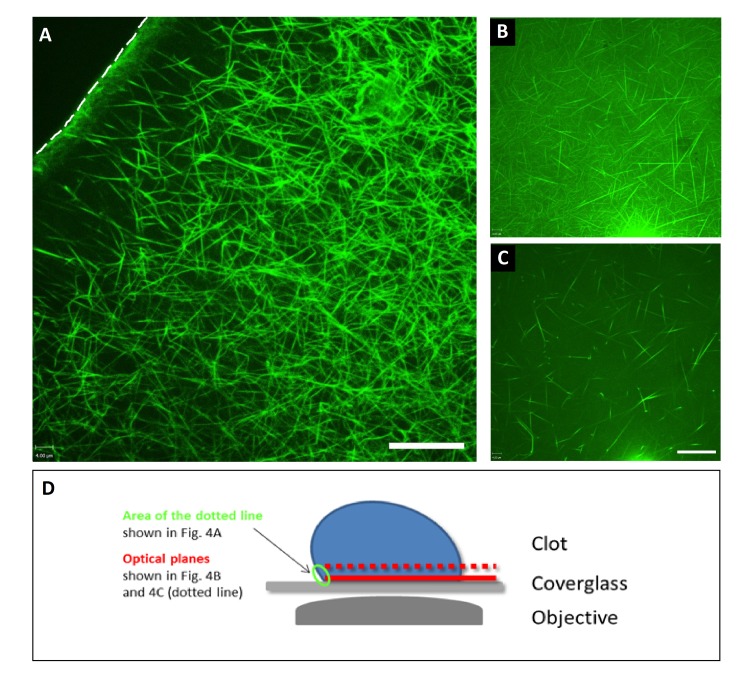
Background and Aim: Although fibrinogen has been established as a key player in the process of coagulation, many questions about the role of fibrinogen under specific conditions remain. Confocal microscopic assessment of clot formation, and in particular the role that fibrinogen plays in this process, is commonly investigated using pre-labeled fibrinogen. This has a number of drawbacks, primarily that it is impossible to stain fibrin networks after their formation. The aim of the present study is to present an alternative for conveniently post-staining fibrin in a wide range of models/situations, in real time and with high resolution. Methods: We combined a peptide known to bind fibrin and linked it to fluorescein isothiocyanate (FITC), creating the FITC-Fibrin-Binding Peptide (FFBP). We subsequently tested its fibrin-binding capability in vitro under static conditions, as well as under simulated flow, using real-time live confocal microscopy. Results: Fibrin stained with FFBP overlaps with fibrin stained with fibrinogen pre-labeled with Alexa Fluor 647 following coagulation induction. In contrast to pre-labeled fibrinogen, FFBP also stains already formed fibrin networks. By combining FFBP with real-time live confocal microscopy even the visualization of single fibrin fibers is possible. Conclusions: These data indicate that FFBP is a valid and valuable tool for real-time live confocal assessment of clot formation. Relevance for patients: Our findings present a valuable alternative for the visualization of fibrin even after its formation, and we believe this approach will be particularly valuable for future investigations of important, but previously overlooked, aspects of clot formation.

Keywords: coagulants; confocal; fibrin; fibrinogen; hemostasis; microscopy.


Conflict of interest statement

C. Solomon was an employee of CSL Behring at the time of writing and previously received speaker honoraria and re-search support from Tem International and CSL Behring and travel support from Haemoscope Ltd (former manufacturer of TEG®). D. Fries has received honoraria for consulting, lecture fees and sponsoring for academic studies from the following companies: Astra Zeneca, AOP Orphan, Baxter, Bayer, B. Braun, Biotest, CSL Behring, Delta Select, Dade Behring, Edwards, Fresenius, Glaxo, Haemoscope, Hemogem, Lilly, LFB, Mitsubishi Pharma, NovoNordisk, Octapharm, Pfizer, Tem-Innovation. M. Hermann, N. Weiss, B. Schenk and M. Bachler have no conflicts of interest to disclose.

Figures

Figure 1
Figure 1. Comparison between FFBP and pre-labeled fibrinogen (Alexa Fluor 647). Clots were created from citrated human plasma with added RBCs and platelets by addition of star-tem/ex-tem. Shown are confocal images of fibrin fibers 1 µm above the bottom surface of the chamber stained with A) FFBP or B) pre-labeled fibrinogen; both images come from one sample stained with both methods. C) Shows a bright field image of RBCs/platelets and D) shows the merged image. Note the 100% overlay of the fibrin visualization with FFBP and pre-labeled fibrinogen resulting in the yellow color. Z-stack images (20 optical planes with a spacing of 0.2 µm) were acquired using a 63× oil immersion objective with a numerical aperture of 1.42. Scale bar = 16 µm. All experiments were performed at least three times, and representative samples are shown.
Figure 2
Figure 2. Clots from citrated human plasma were formed by addition of star-tem and ex-tem. All stainings were performed before induction of coagulation. The fibrin network is labeled in green via FFBP. Shown is the FFBP labeled fibrin network without (A) and with addition of fibrinogen (1/10/50 µg/µl; B-D). The influence of RBCs (5.5×10⁴-2.7×10⁶) on the fibrin network is shown in (E-H) and platelets (1.5×10⁴-7×10⁵) in (I-L). Fluorescence images of fibrin fibers were acquired 1 μm above the bottom surface of the chambers. In red the RBCs and platelets are visualized via wheat germ agglutinin (561 nm) staining. Merged images are shown. In panels M-O, coagulation was performed before the addition of the stains. Stains were added 15 min after starting the coagulation. M) Shows the result using FFBP; N) using pre-labeled human fibrinogen Alexa Fluor 647 and O) shows the same area as a bright field image in order to verify the presence of fibrin fibers. An additional image showing staining performed with FFBP 30 min post coagulation is shown in P). Further controls show representative images acquired from a dish coated with type I (rat rail) collagen in the presence (Q) and absence (R) of RBCs. All images were obtained using a 63× oil immersion objective with a numerical aperture of 1.42. Scale bar = 16 μm. All experiments were performed at least three times, and representative samples are shown.
Figure 3
Figure 3. Visualization of clot formation induced by star-tem and ex-tem in the Cellix microfluidic biochip system. A) Fibrin stained with FFBP, B) RBCs stained with wheat germ agglutinin and C) a merged image of A and B. D) A 3-dimensional representation of the same clot made by combining a Z-stack of images A and B. Scale bar = 10 μm. The round objects stained by wheat germ agglutinin are platelet aggregates. All experiments were performed at least three times, and representative samples are shown.
Figure 4
Figure 4. A) Fibrin formation in response to air (top left corner of the image) as visualized via FFBP under static conditions in an 8-well chamber. Clot formation was induced by addition of star-tem and ex-tem. Shown is the border of the clot that faces the air (dotted line). Note the dense architecture of the fibrin network at this border compared to the architecture of the network at the center of the clot. Notably, staining of the fibrin network was performed after its formation. B) Fibrin architecture at the bottom of the 8-well slide and C) 1 µm away towards the center of the clot. D) Shows a diagrammatic representation of how images A-C were obtained. Note the different architecture which resembles the one shown before at the contact site towards the air. Scale bar = 16 μm. All experiments were performed at least three times, and representative samples are shown.

References

    1. Falati S, Gross P, Merrill-Skoloff G, Furie BC, Furie B. Real-time in vivo imaging of platelets, tissue factor and fibrin during arterial thrombus formation in the mouse. Nat Med. 2002;8:1175–1181. - PubMed
    1. Campbell RA, Aleman M, Gray LD, Falvo MR, Wolberg AS. Flow profoundly influences fibrin network structure: Implications for fibrin formation and clot stability in haemostasis. Thromb Haemost. 2010;104:1281–1284. - PMC - PubMed
    1. Chapin JC, Hajjar KA. Fibrinolysis and the control of blood coagulation. Blood Rev. 2015;29:17–24. - PMC - PubMed
    1. Hoppe B. Fibrinogen and factor xiii at the intersection of coagulation, fibrinolysis and inflammation. Thromb Haemost. 2014;112:649–658. - PubMed
    1. Solomon C, White NJ, Hochleitner G, Hermann M, Fries D. In search for in vivo methods to visualize clot forming in cut vessels and interrupted flow. Br J Anaesth. 2016;116:554–555. - PubMed

LinkOut - more resources