. 2019 Jun 1;36(6):1333-1343.
doi: 10.1093/molbev/msz058.

Transmission Trees on a Known Pathogen Phylogeny: Enumeration and Sampling

Affiliations

Transmission Trees on a Known Pathogen Phylogeny: Enumeration and Sampling

Matthew D Hall et al. Mol Biol Evol. .

Abstract

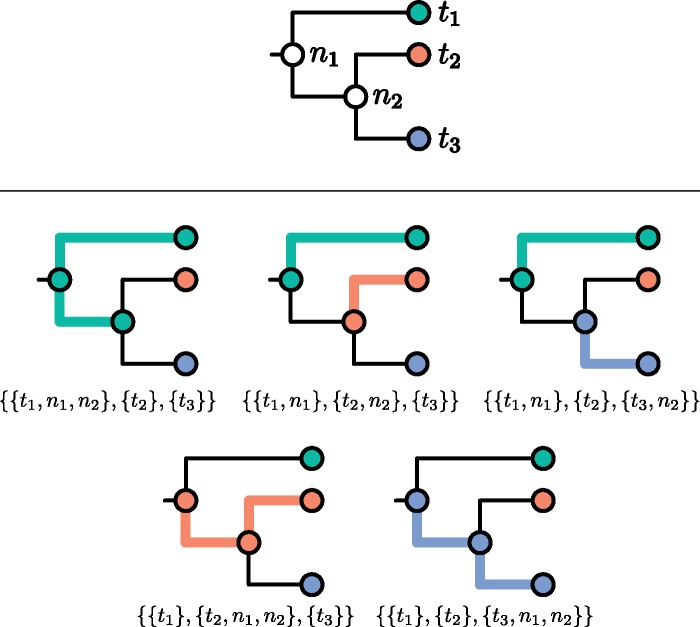
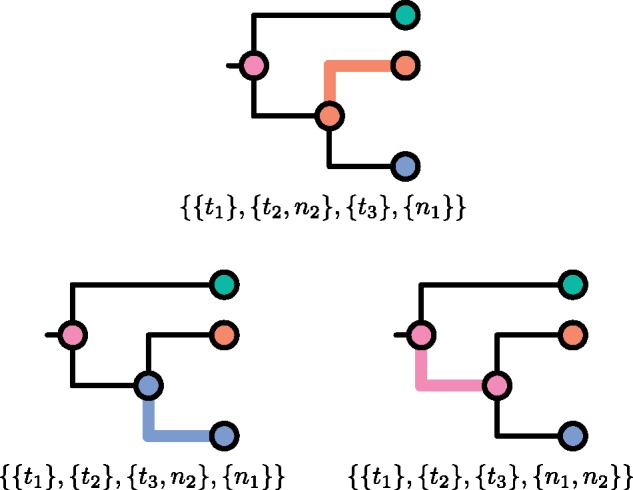
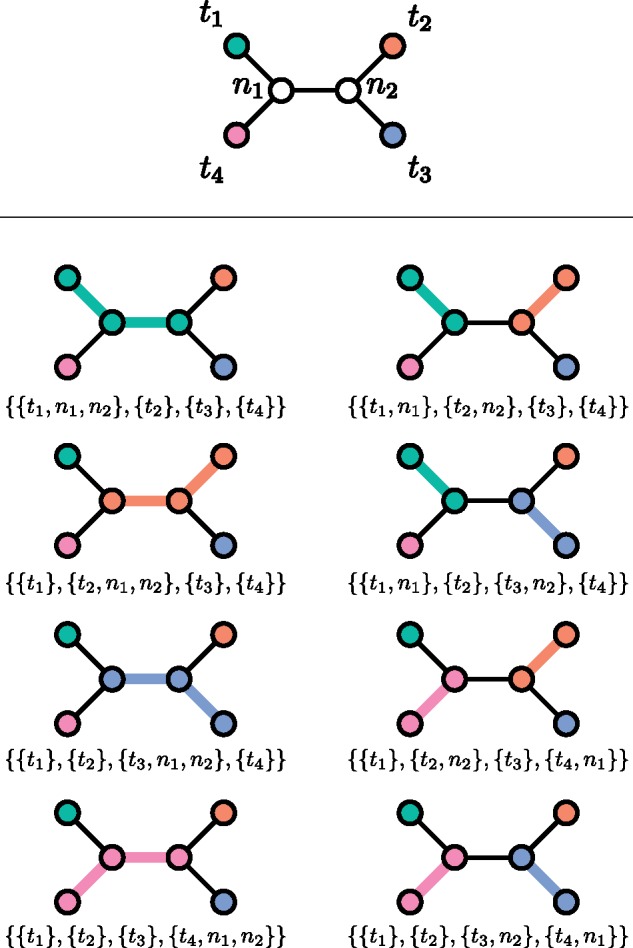
One approach to the reconstruction of infectious disease transmission trees from pathogen genomic data has been to use a phylogenetic tree, reconstructed from pathogen sequences, and annotate its internal nodes to provide a reconstruction of which host each lineage was in at each point in time. If only one pathogen lineage can be transmitted to a new host (i.e., the transmission bottleneck is complete), this corresponds to partitioning the nodes of the phylogeny into connected regions, each of which represents evolution in an individual host. These partitions define the possible transmission trees that are consistent with a given phylogenetic tree. However, the mathematical properties of the transmission trees given a phylogeny remain largely unexplored. Here, we describe a procedure to calculate the number of possible transmission trees for a given phylogeny, and we then show how to uniformly sample from these transmission trees. The procedure is outlined for situations where one sample is available from each host and trees do not have branch lengths, and we also provide extensions for incomplete sampling, multiple sampling, and the application to time trees in a situation where limits on the period during which each host could have been infected and infectious are known. The sampling algorithm is available as an R package (STraTUS).

Keywords: epidemic reconstruction; molecular epidemiology; pathogen genomics; phylogenetics.


Figures

<sc>Fig</sc>. 1.
Fig. 1.
A rooted phylogeny (top) and the five compatible transmission trees labeled with their expression as partitions of its node set (bottom). Thicker, colored branches connect members of the same part.
<sc>Fig</sc>. 2.
Fig. 2.
For the tree in figure 1, the three members of Q(T) which are not members of P(T).
<sc>Fig</sc>. 3.
Fig. 3.
An unrooted phylogeny (top) and the eight partitions of its node set (bottom). Thicker, colored branches connect members of the same part.
<sc>Fig</sc>. 4.
Fig. 4.
How to count partitions. At each node u, if Tu is the subtree rooted at u, then the red number is |P(Tu)| and the blue |P(Tu*)|. If u is internal and has children uL and uR, |P(Tu)| is (|P(TuL)|×|P(TuR*)|)+(|P(TuR)|×|P(TuL*)|) (the sum of the product of the blue number at uL and the red number at uR, and the product of the blue number at uR and the red number at uL), whereas |P(Tu*)| is |P(Tu)|+(|P(TuL*)|×|P(TuR*)|) (the sum of the red number at u and the product of the blue numbers at its children).
<sc>Fig</sc>. 5.
Fig. 5.
Yule (top) and biased (bottom) phylogenetic trees with randomly sampled partitions. Each color corresponds to a part of each partition. Gray edges separate nodes that are in different parts of the partition. Branch lengths are assumed to be in arbitrary time units.
<sc>Fig</sc>. 6.
Fig. 6.
Offspring distributions from two input phyogenetic trees without (top) and with (bottom) constraints on the time between infection and sampling such that hosts became noninfectious immediately upon sampling, and had been infectious for a maximum of 3.5 time units, compared with the mean branch length in these trees of 1.39 and 1.63 time units, respectively.
<sc>Fig</sc>. 7.
Fig. 7.
Multidimensional scaling plots visualizing distances between transmission trees sampled on the Yule and biased phylogenies, without and with restrictions on the lengths of infectious periods.
<sc>Fig</sc>. 8.
Fig. 8.
PCA plot illustrating the distances between transmission trees inferred by TransPhylo and sampled using STraTUS, derived from the timed phylogenetic tree of the Roetzer outbreak, previously published by Didelot et al. (2017). The colors indicate the algorithm used and the number of unsampled cases selected in STraTUS. The shaded areas enclose all the trees in each sample and give an idea of the extent of the corresponding MDS spaces. The squares represent the geometric median tree of each sample.
<sc>Fig</sc>. 9.
Fig. 9.
Geometric median trees from TransPhylo (left) and STraTUS (right). Gray nodes represent unsampled cases and in each case the index host in the tree is ringed in black. Although many individual transmission events differ, there are many points where the differences are “minor” and the trees share small subclusters of cases who transmitted to each other in different configurations.
<sc>Fig</sc>. 10.
Fig. 10.
The number of transmission trees versus the number of cherries (top) and the Sackin measure of imbalance (bottom) over 500 random phylogenies each with 20 tips.

References

    1. Aldrin M, Lyngstad TM, Kristoffersen AB, Storvik B, Borgan Ø, Jansen PA.. 2011. Modelling the spread of infectious salmon anaemia among salmon farms based on seaway distances between farms and genetic relationships between infectious salmon anaemia virus isolates. J R Soc Interface 862: 1346–1356. - PMC - PubMed
    1. Blum MGB, François O.. 2005. On statistical tests of phylogenetic tree imbalance: the sackin and other indices revisited. Math Biosci. 1952: 141–153. - PubMed
    1. Bortolussi N, Durand E, Blum M, François O.. 2006. apTreeshape: statistical analysis of phylogenetic tree shape. Bioinformatics 223: 363–364. - PubMed
    1. Chessel D, Dufour A-B, Thioulouse J.. 2004. The ade4 package – I: one-table methods. R News 41: 5–10.
    1. Colijn C, Gardy J.. 2014. Phylogenetic tree shapes resolve disease transmission patterns. Evol Med Public Health 20141: 96–108. - PMC - PubMed

Publication types