. 2019 Apr 15;44(4):267-278.
doi: 10.1093/chemse/bjz014.

SmellSpace: An Odor-Based Social Network as a Platform for Collecting Olfactory Perceptual Data

Affiliations

SmellSpace: An Odor-Based Social Network as a Platform for Collecting Olfactory Perceptual Data

Kobi Snitz et al. Chem Senses. .

Abstract

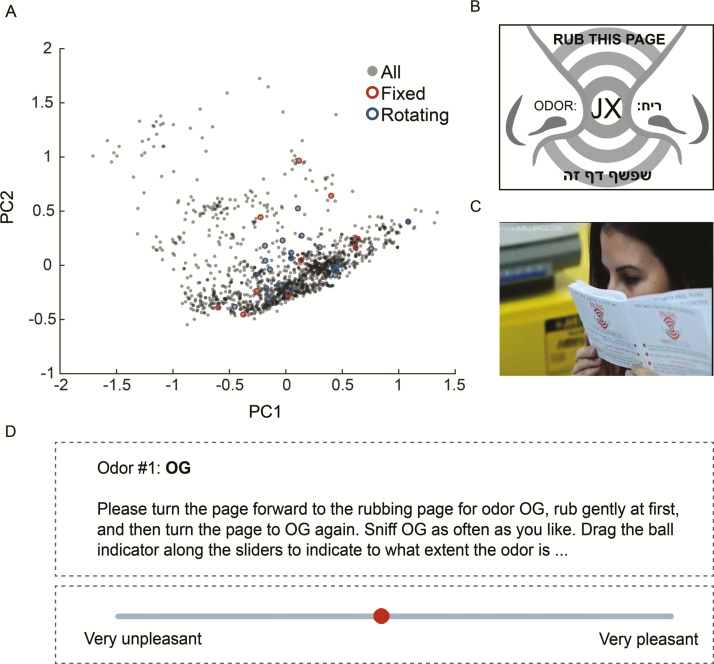
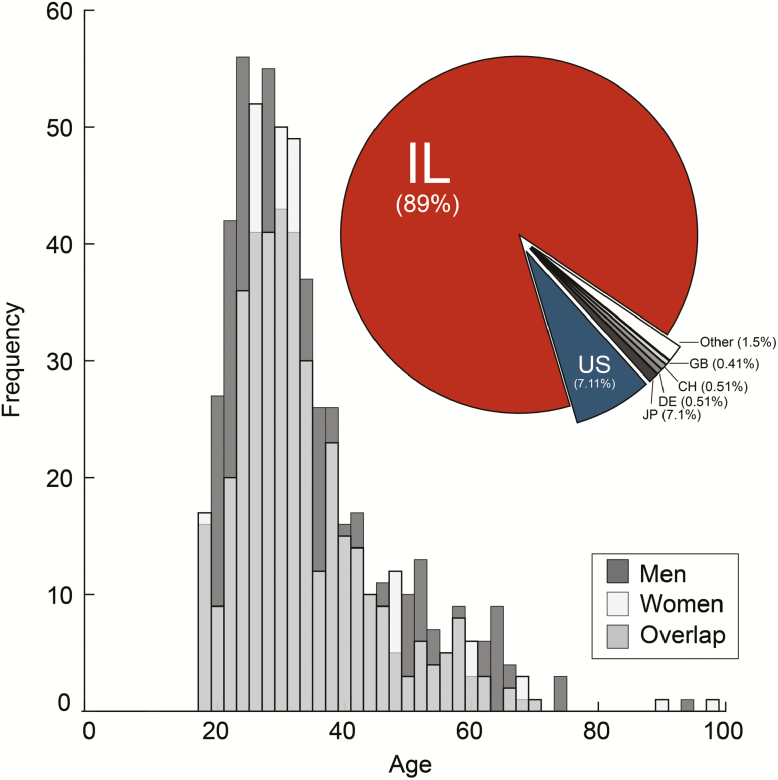
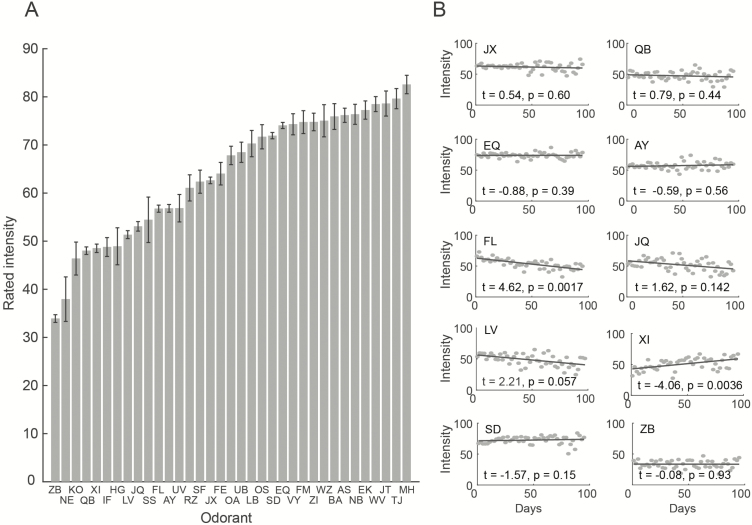
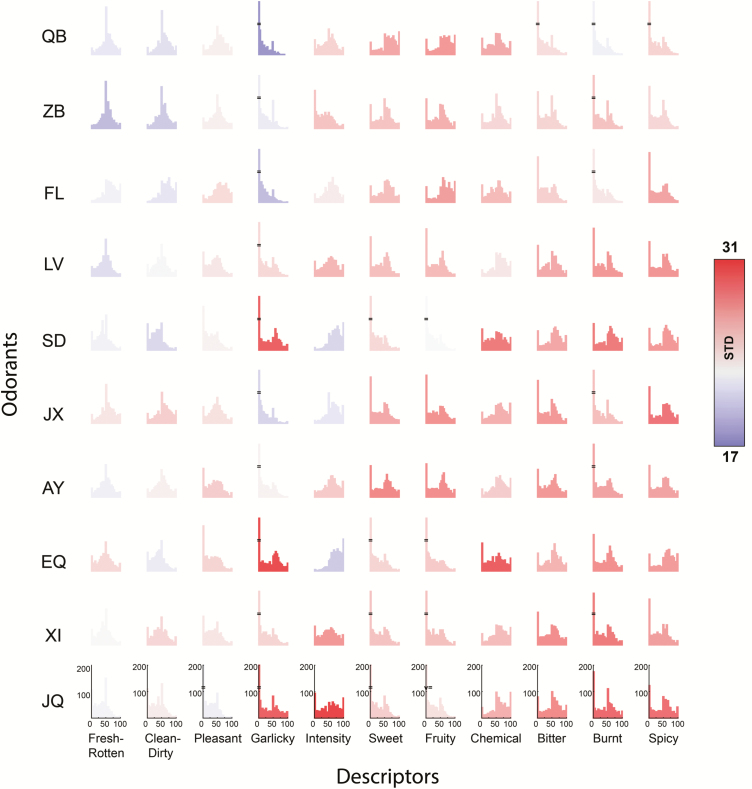
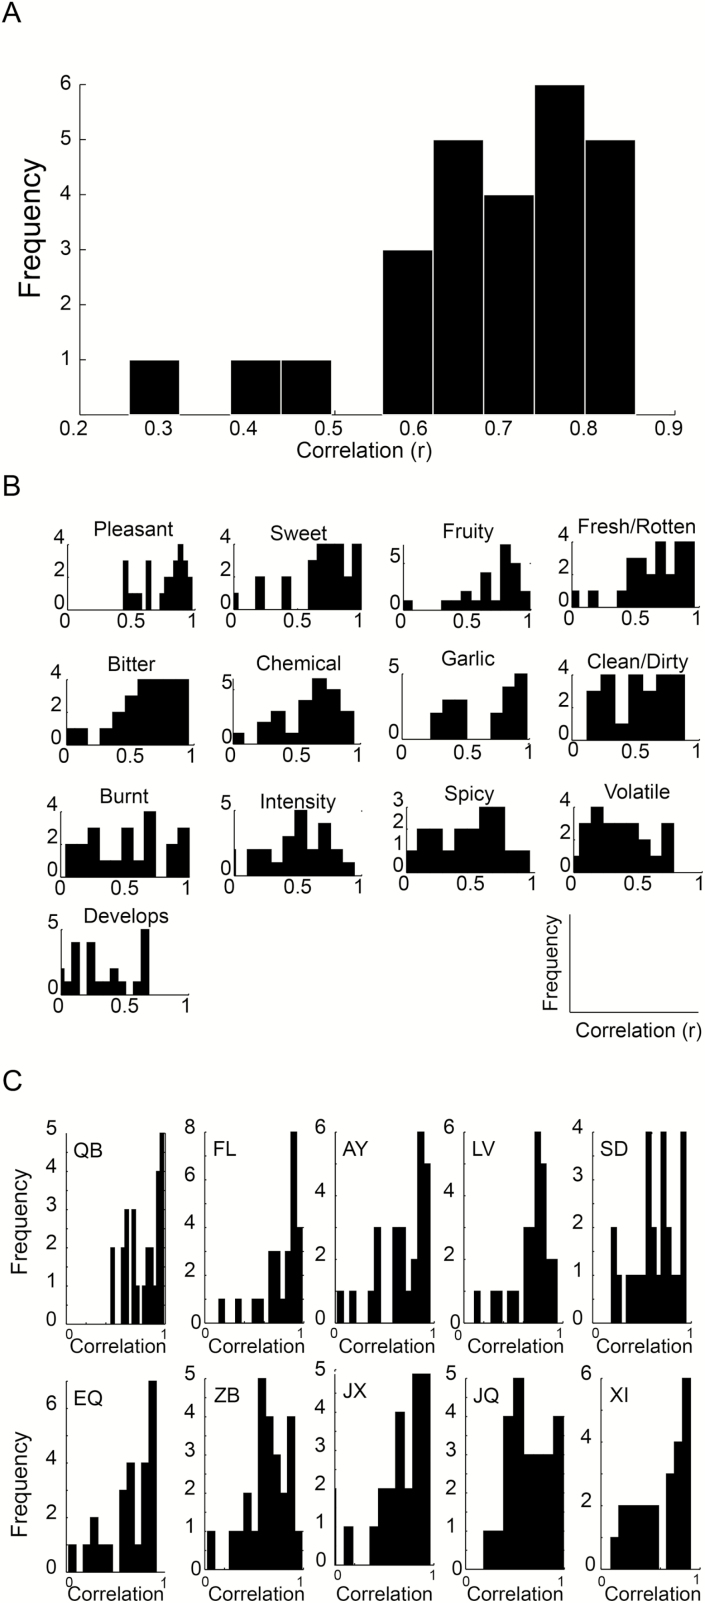
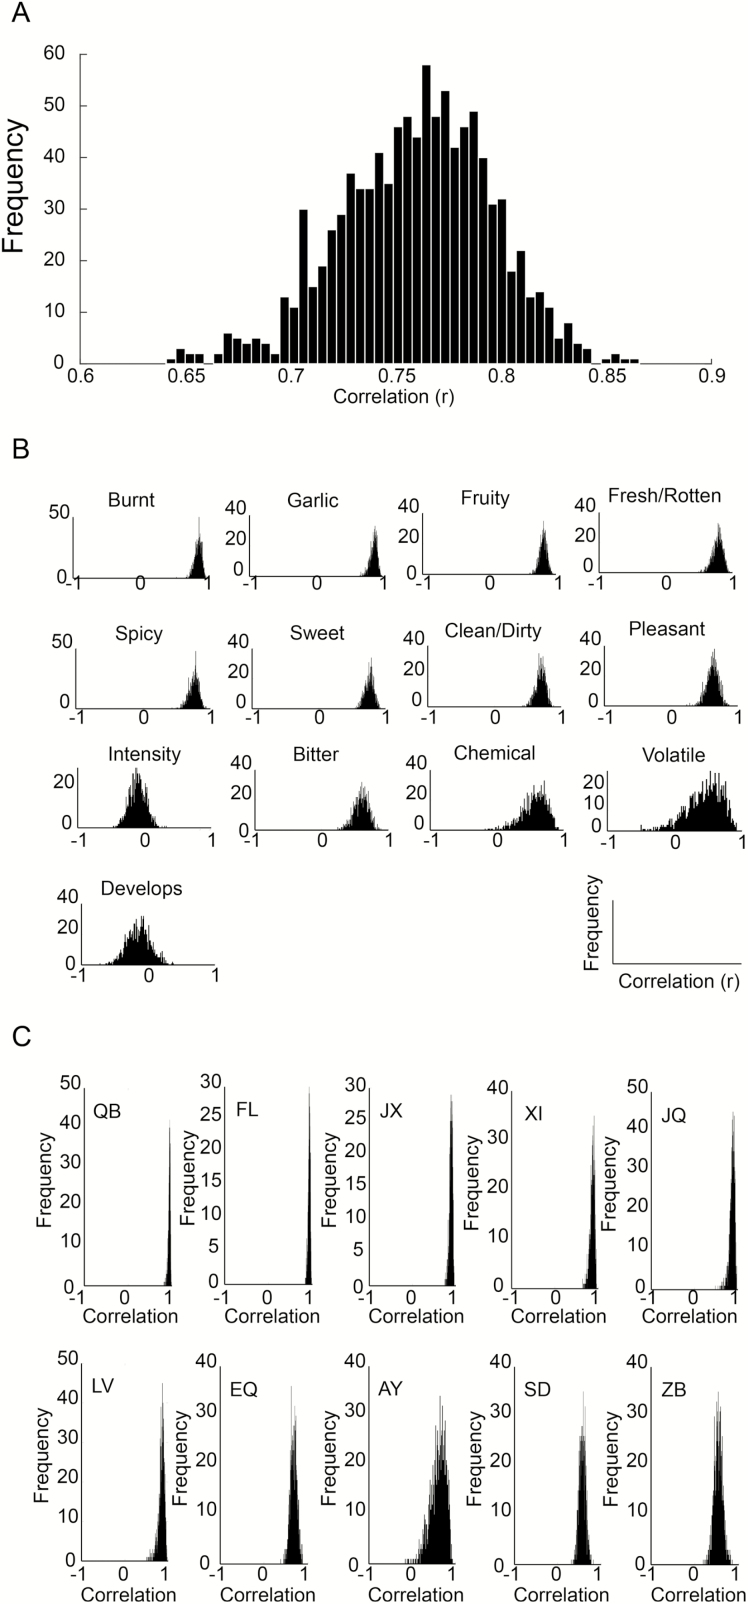
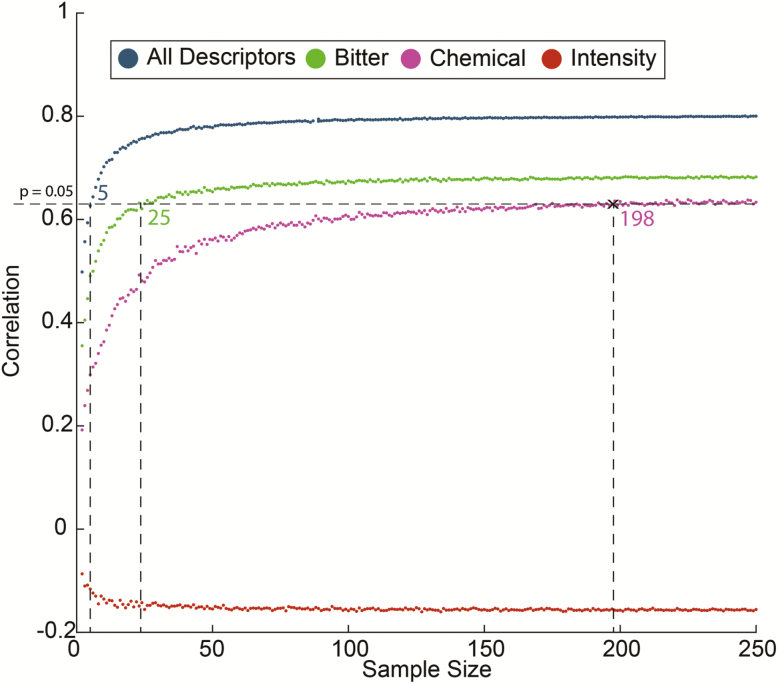
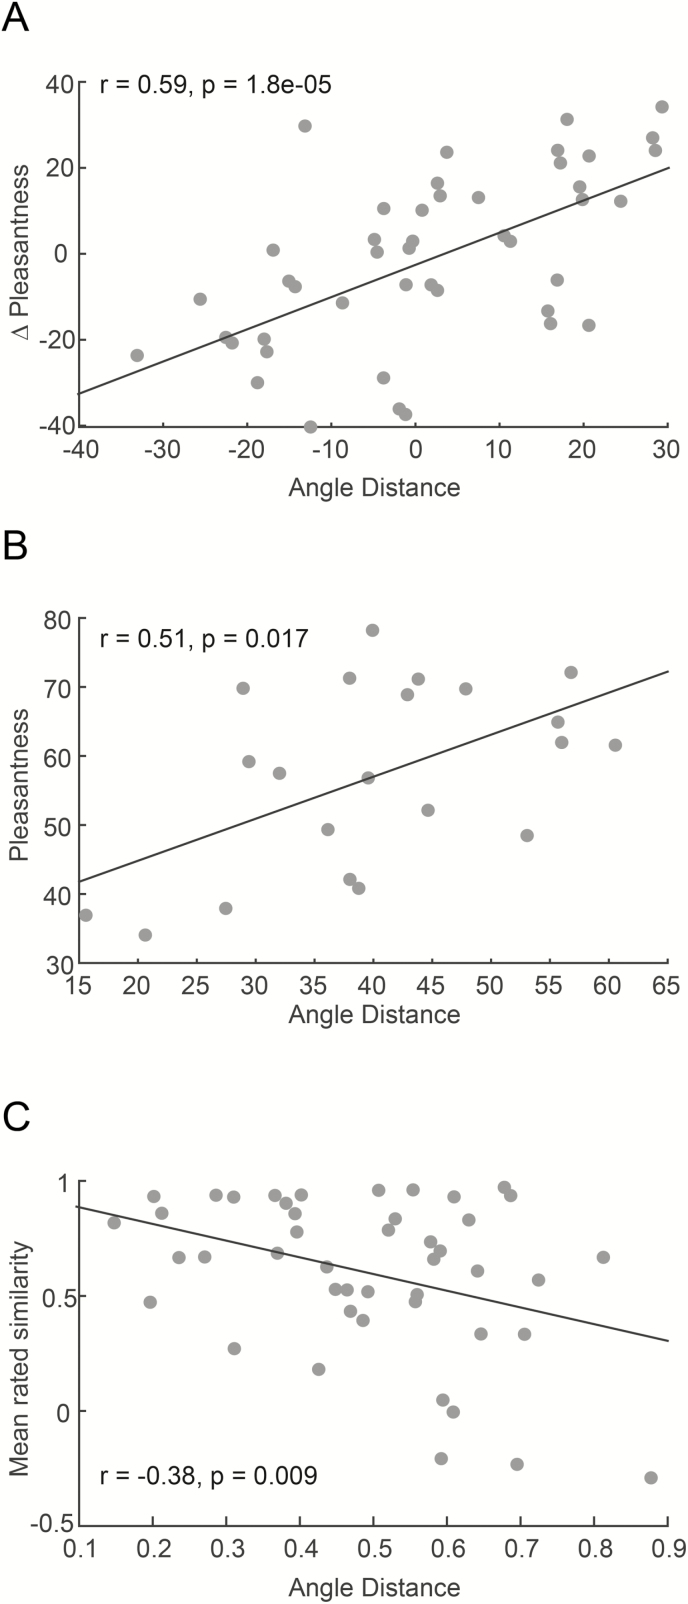
A common goal in olfaction research is modeling the link between odorant structure and odor perception. Such modeling efforts require large data sets on olfactory perception, yet only a few of these are publicly and freely available. Given that individual odor perception may be informative on personal makeup and interpersonal relationships, we hypothesized that people would gladly provide olfactory perceptual estimates in the context of an odor-based social network. We developed a web-based infrastructure for such a network we called SmellSpace and distributed 10 000 scratch-and-sniff registration booklets each containing a subset of 12 out of 35 microencapsulated odorants. Within ~100 days, we obtained data from ~1000 participants who rated the odorants along 13 verbal descriptors. To verify that these estimates are comparable to lab-collected estimates we tested 26 participants in a controlled lab setting using the same odorants and descriptors. We observed remarkably high overall group correlations between lab and SmellSpace data, implying that this method provides for credible group-representations of odorants. We further estimated the usability of the data by applying to it two previously published models that used odorant structure alone to predict either odorant pleasantness or pairwise odorant perceptual similarity. We observed statistically significant predictions in both cases, thus further implying that the current data may be helpful toward future efforts of modeling olfactory perception from structure. We conclude that an odor-based social network is a potentially useful instrument for collecting extensive data on olfactory perception and here post the complete raw data set from the first ~1000 participants.

Keywords: odor perception; odorant descriptors; odorant pleasantness; odorant similarity.


Figures

Figure 1.
Figure 1.
Odorants were distributed by Scratch and Sniff booklets. (A) The monomolecules used in the study: 10 fixed odorants and 13 rotators (the remaining 12 odorants were mixtures) depicted within the first and second principal components of a representative physicochemical space containing ~1500 odorant molecules. (B) An odorant page from within the booklet. The microencapsulated odorant (in this case; JX) was printed on the entire page. (C) A participant sniffing the booklet. (D) Example of the VAS scale in the webpage.
Figure 2.
Figure 2.
One thousand participants within 100 days. A histogram depicting age and gender of the participants. The insert pie chart denotes country of origin: IL = Israel; US = USA; JP = Japan; DE = Germany; CH = Switzerland; GB = Great Britain.
Figure 3.
Figure 3.
The odorants varied in perceived intensity. (A) Mean and standard error of perceived intensity for all 35 odorants used, rank-ordered by intensity. (B) Perceived intensity of the 10 fixed set odorants across 100 days of distribution (day 0 is the first day of distribution). Each point is the average for that day. The t and p values reflect a two-tailed paired t-test between the first 10 days and last 10 days.
Figure 4.
Figure 4.
Descriptors were variably applied across odorants. Histograms for each of the 11 fixed descriptors as they were applied to 10 fixed odorants. Columns arranged according to increasing average column variance (from left to right) and rows according to increasing average row variance in increasing order from top to bottom (the standard deviation is color coded). In other words, “Spicy” and “Fresh-Rotten” were the most and least variably applied descriptors, respectively, and JQ and QB were the most and least variably perceived odorants, respectively.
Figure 5.
Figure 5.
Individual lab participants provided consistent ratings. (A) A histogram reflecting the frequencies of day-after-day correlations on the entire fixed set (a 110 unit vector of 11 odorants along 10 descriptors). (B) Histograms reflecting the frequencies of day-after-day correlations on the fixed set of 10 odorants across each of the 13 descriptors. (C) Histograms reflecting the frequencies of day-after-day correlations on the fixed set of 11 descriptors across each of the 10 odorants.
Figure 6.
Figure 6.
SmellSpace group data reflected lab group data. We sampled SmellSpace 1000 times, each time selecting 26 participants age and gender matched to the lab cohort. (A) A histogram reflecting the frequencies of SmellSpace-to-lab correlations on the entire fixed set (a 110 unit vector of 11 odorants along 10 descriptors). (B) Histograms reflecting the frequencies of SmellSpace-to-lab correlations on the fixed set of 10 odorants across each of the 13 descriptors. (C) Histograms reflecting the frequencies of SmellSpace-to-lab correlations on the fixed set of 11 descriptors across each of the 10 odorants.
Figure 7.
Figure 7.
Correlations with lab data as a function of SmellSpace sample size. We randomly sampled SmellSpace 1000 times for each sample size. For each sample we compared the fixed odorant set vector (without odorant ZB). The dashed line reflects a significant correlation between lab and SmellSpace. At 198 SmellSpace participants, all descriptors but “Intensity” are significantly correlated across lab and SmellSpace.
Figure 8.
Figure 8.
Predicting odorant perception from odorant structure in SmellSpace. (A) Predicting pairwise differences in monomolecular odorant pleasantness from odorant structure. Each dot is a comparison of 2 odorants. (B) Predicting odorant pleasantness from odorant structure. Each dot is a monomolecule. (C) Predicting pairwise monomolecular odorant similarity from odorant structure. Each dot is a comparison of 2 odorants.

References

    1. Arctander S. 1969. Perfume and flavor chemicals: (aroma chemicals). Carol Stream (IL): Allured Publishing Corporation.
    1. Callegari P, Rouault J, Laffort P. 1997. Olfactory quality: from descriptor profiles to similarities. Chem Senses. 22:1–8. - PubMed
    1. Distel H, Ayabe-Kanamura S, Martínez-Gómez M, Schicker I, Kobayakawa T, Saito S, Hudson R. 1999. Perception of everyday odors–correlation between intensity, familiarity and strength of hedonic judgement. Chem Senses. 24:191–199. - PubMed
    1. Doty RL, Golbe LI, McKeown DA, Stern MB, Lehrach CM, Crawford D. 1993. Olfactory testing differentiates between progressive supranuclear palsy and idiopathic Parkinson’s disease. Neurology. 43:962–965. - PubMed
    1. Doty RL, Shaman P, Kimmelman CP, Dann MS. 1984. University of Pennsylvania Smell Identification Test: a rapid quantitative olfactory function test for the clinic. Laryngoscope. 94:176–178. - PubMed

Publication types