. 2019 Jul;176(14):2509-2524.
doi: 10.1111/bph.14660. Epub 2019 May 9.

β3 -Adrenoceptor as a potential immuno-suppressor agent in melanoma

Affiliations

β3 -Adrenoceptor as a potential immuno-suppressor agent in melanoma

Maura Calvani et al. Br J Pharmacol. 2019 Jul.

Abstract

Background and purpose: Stress-related catecholamines have a role in cancer and β-adrenoceptors; specifically, β2 -adrenoceptors have been identified as new targets in treating melanoma. Recently, β3 -adrenoceptors have shown a pleiotropic effect on melanoma micro-environment leading to cancer progression. However, the mechanisms by which β3 -adrenoceptors promote this progression remain poorly understood. Catecholamines affect the immune system by modulating several factors that can alter immune cell sub-population homeostasis. Understanding the mechanisms of cancer immune-tolerance is one of the most intriguing challenges in modern research. This study investigates the potential role of β3 -adrenoceptors in immune-tolerance regulation.

Experimental approach: A mouse model of melanoma in which syngeneic B16-F10 cells were injected in C57BL-6 mice was used to evaluate the effect of β-adrenoceptor blockade on the number and activity of immune cell sub-populations (Treg, NK, CD8, MDSC, macrophages, and neutrophils). Pharmacological and molecular approaches with β-blockers (propranolol and SR59230A) and specific β-adrenoceptor siRNAs targeting β2 - or β3 -adrenoceptors were used.

Key results: Only β3 -, but not β2 -adrenoceptors, were up-regulated under hypoxia in peripheral blood mononuclear cells and selectively expressed in immune cell sub-populations including Treg, MDSC, and NK. SR59230A and β3 -adrenoceptor siRNAs increased NK and CD8 number and cytotoxicity, while they attenuated Treg and MDSC sub-populations in the tumour mass, blood, and spleen. SR59230A and β3 -adrenoceptor siRNAs increased the ratio of M1/M2 macrophages and N1 granulocytes.

Conclusions and implications: Our data suggest that β3 -adrenoceptors are involved in immune-tolerance, which opens the way for new strategic therapies to overcome melanoma growth.

Linked articles: This article is part of a themed section on Adrenoceptors-New Roles for Old Players. To view the other articles in this section visit http://onlinelibrary.wiley.com/doi/10.1111/bph.v176.14/issuetoc.


Conflict of interest statement

The authors declare no conflicts of interest.

Figures
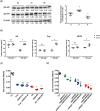
Figure 1
Figure 1
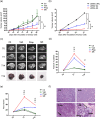
(a) Representative WB of β3‐adrenoceptors in murine lymphocytes after 24 hr of normoxic (N) or 24 hr hypoxic conditions (H) and 1 hr of normoxic re‐exposure (R) and relative densitometric quantification (n = 6). Results are reported as mean ± SD of relative expression normalized to β‐actin. *P < 0.05 hypoxic (H) and re‐exposure conditions compared with normoxic (N). (b) FACS quantification of β2‐ and β3‐adrenoceptors expression in blood and tumour infiltrating NK and Treg cells, and MDSC. *P < 0.05 β3‐adrenoceptor in tumour compared with β3‐adrenoceptor in blood (n = 6). (c) MTT cell viability assay in B16‐F10 cells untreated or treated with propranolol (Prop) or SR59230A (SR) and co‐cultured for 48 hr under hypoxic conditions with PBMC untreated or pretreated with Prop or SR. Dot plots show the changes of each treatment compared with Ctrl (n = 6). ns: not significant, *P < 0.05 PBMC/SR or SR + (PBMC/SR) compared with SR. (d) MTT cell viability assay in B16‐F10 cells silenced with siRNA‐Ctrl, siRNA‐β2, or siRNA‐β3 and co‐cultured for 48 hr under hypoxic conditions with PBMC untreated or pretreated with Ctrl‐siRNA, siRNA‐β2, or siRNA‐β3. Dot plots show the changes of each treatment compared with Ctrl (n = 6). ns: not significant, *P < 0.05 PBMC/siRNA‐β3 or siRNA‐β3 + (PBMC/siRNA‐β3) compared with siRNA‐β3
Figure 2
Figure 2
(a) Tumour growth rate in control‐ (Crl), vehicle‐ (Veh), propranolol (Prop)‐, and SR59230A (SR)‐ treated mice (n = 6). (b) Tumour growth rate in siRNA‐CTRL, siRNA‐β2, and siRNA‐β3 treated mice (n = 6). (c) MR images of mouse ventral section in control, vehicle‐, propranolol‐, and SR59230A‐treated mice (n = 6). (d) FACS analysis of AnnexinV positive cells in control, vehicle‐, propranolol‐, and SR59230A‐treated mice (n = 6). (e) FACS analysis of Fas marker expression in tumours of control, vehicle‐, propranolol ‐, and SR59230A‐treated mice (n = 6). (f) Representative fields of haematoxylin–eosin (H&E) staining at T14 in control, vehicle‐, propranolol‐, and SR59230A‐treated mice (n = 6). *P < 0.05 Prop‐ (or siRNA‐β2) compared with Veh‐; # P < 0.05 SR‐ (or siRNA‐β3) compared with Veh‐; $ P < 0.05 SR‐ (or siRNA‐β3) compared with Prop‐ (or siRNA‐β2)
Figure 3
Figure 3
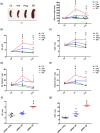
(a) Representative images of mouse spleens at T7 (n = 6; left) and mean weight of mouse spleens (right). (b) FACS analysis and quantification at T7 and T14 of NK (NKp46+/NK1.1+ gated on CD3/CD45+). (c) FACS analysis and quantification at T7 and T14 of CD8+ (gated on CD45+). (d) FACS analysis and quantification at T7 and T14 of perforin expression on NKp46+/NK1.1+ cells. Two‐way ANOVA analysis was performed. (e) FACS analysis and quantification at T7 and T14 of CD8+ cytotoxic (CD107+ gated on CD8+). (f) FACS analysis and quantification at T14 of NK (NKp46+/NK1.1+ gated on CD3/CD45+) cells in siRNA‐CTRL, siRNA‐β2, and siRNA‐β3 treated mice (n = 6). (g) FACS analysis and quantification at T14 of CD8+ (gated on CD45+) cells in siRNA‐CTRL, siRNA‐β2, and siRNA‐β3 treated mice (n = 6). *P < 0.05 Prop‐ (or siRNA‐β2) compared with Veh‐; # P < 0.05 SR‐ (or siRNA‐β3) compared with Veh‐; $ P < 0.05 SR‐ (or siRNA‐β3) compared with Prop‐ (or siRNA‐β2)
Figure 4
Figure 4
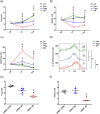
(a) FACS analysis and quantification at T7 and T14 of Treg (CD25+/CD127 gated on CD45+/CD4+). (b) FACS analysis and quantification at T7 and T14 of MDSC (in CD11b+, GR1+ gated on CD45+). (c) FACS analysis and quantification at T7 and T14 of CD8+/Treg ratio. (d) iNOS expression in MDSC. (e) FACS analysis and quantification at T14 of Treg (CD25+/CD127 gated on CD45+/CD4+) in siRNA‐CTRL, siRNA‐β2, and siRNA‐β3 treated mice (n = 6). (f) FACS analysis and quantification at T14 of MDSC (in CD11b+, GR1+ gated on CD45+) in siRNA‐CTRL, siRNA‐β2, and siRNA‐β3 treated mice (n = 6). *P < 0.05 propranolol (Prop)‐ (or siRNA‐β2) compared with Veh‐; # P < 0.05 SR59230A (SR)‐ (or siRNA‐β3) compared with Veh‐; $ P < 0.05 SR‐ (or siRNA‐β3) compared with Prop‐ (or siRNA‐β2)
Figure 5
Figure 5
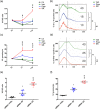
(a) FACS analysis and quantification at T7 and T14 of M1/M2 ratio on CD45+ cells. (b) IL‐10 expression in M2 macrophages. (c) FACS analysis and quantification at T7 and T14 of N1 granulocytes (CD54+, CD95+, and CD11b+). (d) Arg1 expression in N1 granulocytes. (e) FACS analysis and quantification at T14 of M1/M2 ratio on CD45+ cells in siRNA‐CTRL, siRNA‐β2, and siRNA‐β3 treated mice (n = 6). (f) FACS analysis and quantification at T14 of N1 granulocytes (CD54+, CD95+, and CD11b+) in siRNA‐CTRL, siRNA‐β2, and siRNA‐β3 treated mice (n = 6). *P < 0.05 propranolol (Prop)‐ (or siRNA‐β2) compared with Veh‐; # P < 0.05 SR59230A (SR)‐ (or siRNA‐β3) compared with Veh‐; $ P < 0.05 SR‐ (or siRNA‐β3) compared with Prop‐ (or siRNA‐β2)
Figure 6
Figure 6
(a) FACS analysis and quantification at T7 and T14 of NK (NKp46+/NK1.1+ gated on CD3/CD45+) cells (left) and CD8+ (gated on CD45+) cells (right) in spleen of control (Crl), vehicle (Veh)‐, propranolol (Prop)‐, and SR59230A (SR)‐treated mice (n = 6). (b) FACS analysis and quantification at T7 and T14 of NK (NKp46+/NK1.1+ gated on CD3/CD45+) cells (left) and CD8+ (gated on CD45+) cells (right) in blood of control, vehicle‐, propranolol‐, and SR59230A‐treated mice (n = 6). (c) FACS analysis and quantification at T7 and T14 of NK (NKp46+/NK1.1+ gated on CD3/CD45+) cells (left) and CD8+ (gated on CD45+) cells (right) in spleen of siRNA‐CTRL, siRNA‐β2, and siRNA‐β3 treated mice (n = 6). (d) FACS analysis and quantification at T7 and T14 of NK (NKp46+/NK1.1+ gated on CD3/CD45+) cells (left) and CD8+ (gated on CD45+) cells (right) in blood of siRNA‐CTRL, siRNA‐β2, and siRNA‐β3 treated mice (n = 6). *P < 0.05 Prop‐ (or siRNA‐β2) compared with Veh‐; # P < 0.05 SR‐ (or siRNA‐β3) compared with Veh‐; $ P < 0.05 SR‐ (or siRNA‐β3) compared with Prop‐ (or siRNA‐β2)
Figure 7
Figure 7
(a) FACS analysis and quantification at T7 and T14 of Treg (CD25+/CD127 gated on CD45+/CD4+) cells (left) and MDSC (in CD11b+, GR1+ gated on CD45+) (right) in spleen of control (Crl), vehicle (Veh)‐, propranolol (Prop)‐, and SR59230A (SR)‐treated mice (n = 6). (b) FACS analysis and quantification at T7 and T14 of Treg (CD25+/CD127 gated on CD45+/CD4+) cells (left) and MDSC (in CD11b+, GR1+ gated on CD45+) cells (right) in blood of control, vehicle‐, propranolol‐, and SR59230A‐treated mice (n = 6). (c) FACS analysis and quantification at T7 and T14 of Treg (CD25+/CD127 gated on CD45+/CD4+) cells (left) and MDSC (in CD11b+, GR1+ gated on CD45+) (right) in spleen of siRNA‐CTRL, siRNA‐β2, and siRNA‐β3 treated mice (n = 6). (d) FACS analysis and quantification at T7 and T14 of Treg (CD25+/CD127 gated on CD45+/CD4+) cells (left) and MDSC (in CD11b+, GR1+ gated on CD45+) (right) in blood of siRNA‐CTRL, siRNA‐β2, and siRNA‐β3 treated mice (n = 6). *P < 0.05 Prop‐ (or siRNA‐β2) compared with Veh‐; # P < 0.05 SR‐ (or siRNA‐β3) compared with Veh‐; $ P < 0.05 SR‐ (or siRNA‐β3) compared with Prop‐ (or siRNA‐β2)

Similar articles

Cited by

References

    1. Abrahams, V. M. , Kamsteeg, M. , & Mor, G. (2003). The Fas/Fas ligand system and cancer: Immune privilege and apoptosis. Molecular Biotechnology, 25, 19–30. 10.1385/MB:25:1:19 - DOI - PubMed
    1. Aktas, E. , Kucuksezer, U. C. , Bilgic, S. , Erten, G. , & Deniz, G. (2009). Relationship between CD107a expression and cytotoxic activity. Cellular Immunology, 254, 149–154. 10.1016/j.cellimm.2008.08.007 - DOI - PubMed
    1. Alexander, S. P. , Christopoulos, A. , Davenport, A. P. , Kelly, E. , Marrion, N. V. , Peters, J. A. , … CGTP Collaborators (2017). The concise guide to pharmacology 2017/18: G protein‐coupled receptors. British Journal of Pharmacology, 174, S17–S129. 10.1111/bph.13878 - DOI - PMC - PubMed
    1. Alexander, S. P. H. , Fabbro, D. , Kelly, E. , Marrion, N. V. , Peters, J. A. , Faccenda, E. , … CGTP Collaborators . (2017a). The concise guide to pharmacology 2017/18: Enzymes. Br J Pharmacol, 174, S272–S359. - PMC - PubMed
    1. Alexander, S. P. H. , Fabbro, D. , Kelly, E. , Marrion, N. V. , Peters, J. A. , Faccenda, E. , … CGTP Collaborators . (2017b). The Concise Guide to PHARMACOLOGY 2017/18: Catalytic receptors. British Journal of Pharmacology, 174(S1), S225–S271. 10.1111/bph.13876 - DOI - PMC - PubMed

Publication types

MeSH terms

Substances