. 2019 Mar 15;10(1):1221.
doi: 10.1038/s41467-019-09124-x.

Restoration of high-sensitivity and adapting vision with a cone opsin

Affiliations

Restoration of high-sensitivity and adapting vision with a cone opsin

Michael H Berry et al. Nat Commun. .

Abstract

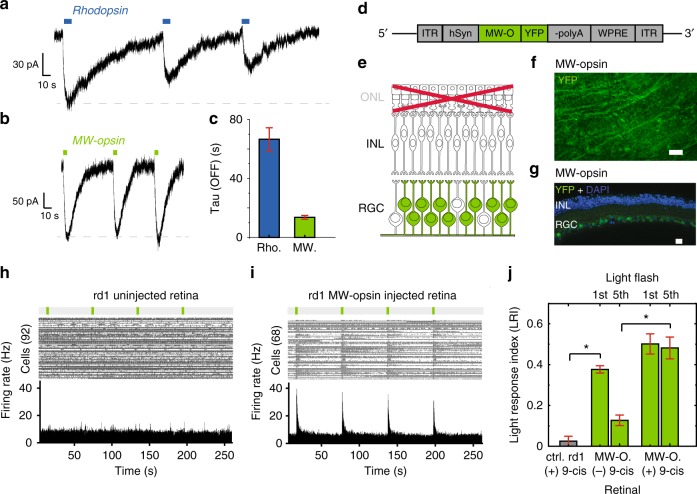
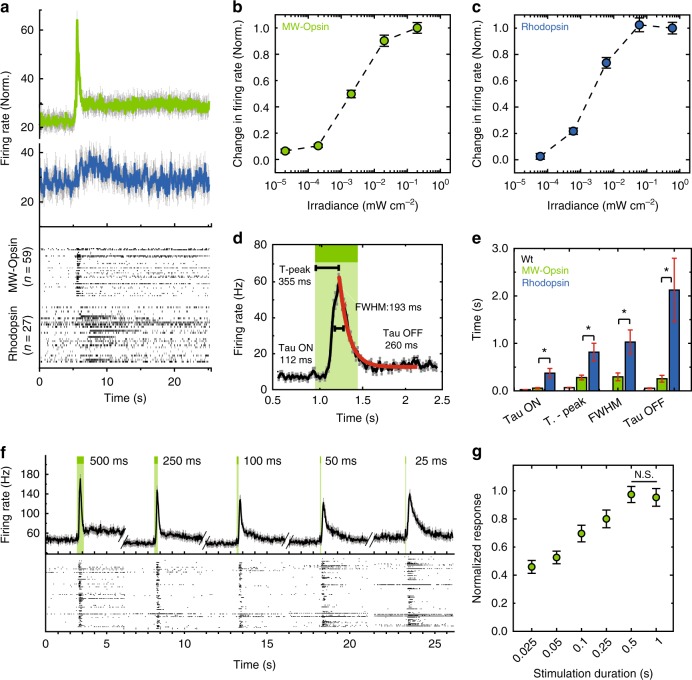
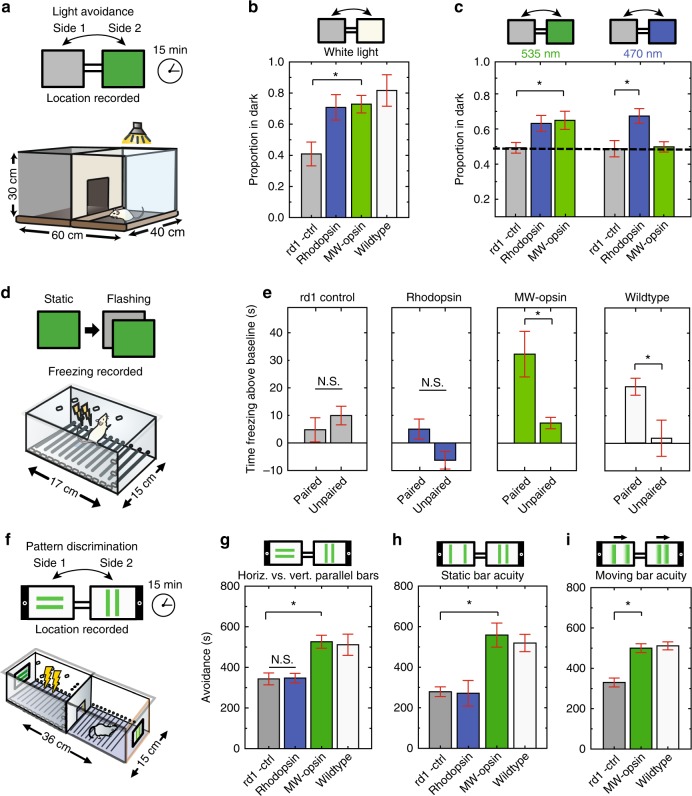
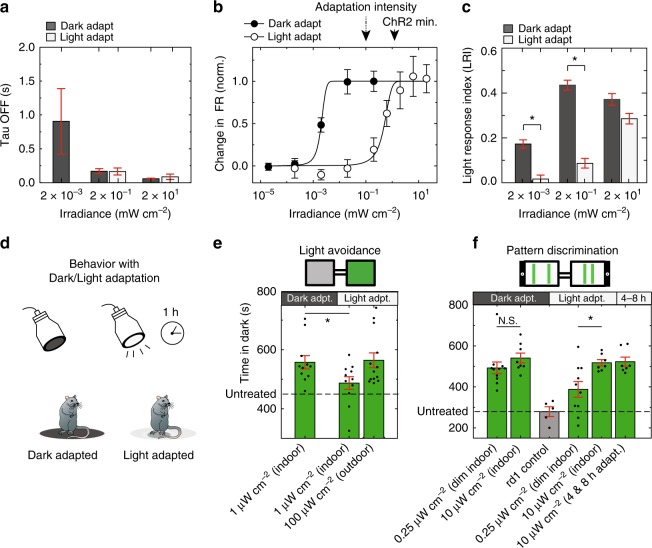
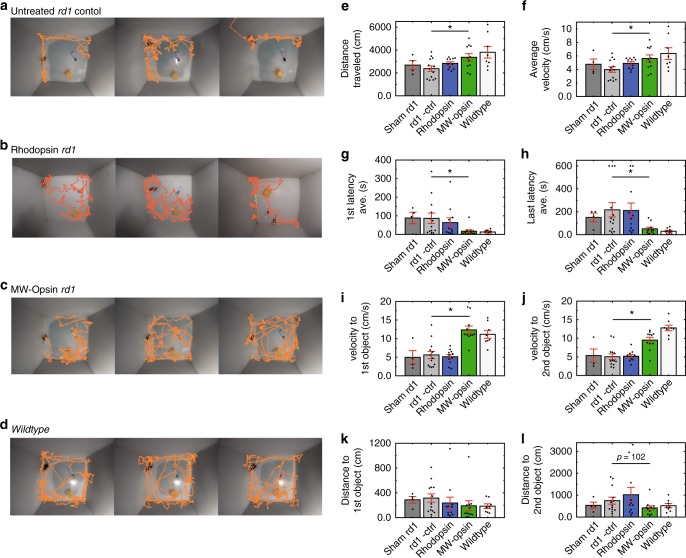
Inherited and age-related retinal degenerative diseases cause progressive loss of rod and cone photoreceptors, leading to blindness, but spare downstream retinal neurons, which can be targeted for optogenetic therapy. However, optogenetic approaches have been limited by either low light sensitivity or slow kinetics, and lack adaptation to changes in ambient light, and not been shown to restore object vision. We find that the vertebrate medium wavelength cone opsin (MW-opsin) overcomes these limitations and supports vision in dim light. MW-opsin enables an otherwise blind retinitis pigmenotosa mouse to discriminate temporal and spatial light patterns displayed on a standard LCD computer tablet, displays adaption to changes in ambient light, and restores open-field novel object exploration under incidental room light. By contrast, rhodopsin, which is similar in sensitivity but slower in light response and has greater rundown, fails these tests. Thus, MW-opsin provides the speed, sensitivity and adaptation needed to restore patterned vision.


Conflict of interest statement

J.G.F and E.Y.I. are founders of Photoswitch Therapeutics, a startup whose goal is to restore vision in blinding disease using photo-pharmacology, chemical optogenetics, and optogenetic methods of the kind described here. The remaining authors declare no competing interests.

Figures

Fig. 1
Fig. 1
Expression and function of MW-opsin in HEK293 cells and RGCs of rd1 mouse retina. a, b Representative traces of activation of homotetramer GIRK(F137S) channels by photo-stimulation of rhodopsin (a) or MW-opsin (b) measured in whole cell patch in 50 mM [K+]ext at VH = −80 mV in response to low intensity (1 mW cm−2) pulses of light at 535 nm (for MW-opsin) or 500 nm (for rhodopsin). c Decay of photo-response (Tau OFF) for rhodopsin (blue) and MW-opsin (green). Values are mean + SEM; n = 6 (rhodopsin), 8 (MW-opsin) cells. d Viral DNA expression cassette. MW-opsin with YFP (green) under control of hSyn-1 promoter. e Schematic of a degenerated rd1 mouse retina with targeted RGCs highlighted (green). ONL outer nuclear layer, IPL inner plexiform layer. Photoreceptor degeneration denoted in light gray and red cross. f, g En face view of flat mount (f) and transverse slice (g) confocal images of MW-opsin expression of rd1 mouse retina 4 weeks after intravitreal injection of AAV2/2-hSyn-MW-opsin-YFP. Images of YFP fused to C-terminal end of MW-opsin (green) show pan-retinal distribution (f) in RGC layer in relation to DAPI staining of nuclei (d, blue). Scales 60 μm (f) and 20 μm (g). h, i MEA recordings from representative uninjected control (e) and MW-opsin expressing (f) rd1 mouse retina. (Top) Raster plot with spikes for each RGC (e: n = 92 cells; g: n = 68 cells). (Bottom) Peristimulus time histogram (PSTH). Light stimulation protocol: 4 pulses of light of 100 ms duration (λ = 535 nm, enlarged green bars) separated by 60 s dark intervals. j Normalized Light response Index (LRI) for rd1 retina without (gray) and with MW-opsin expression (green) (gray: N = 6 retinas, n = 295 cells; green: N = 8 retinas, n = 323 cells). LRI for 1st and 5th light flash without (N = 3 retinas, n = 106 cells) and with (N = 6 retinas, n = 257 cells) 9-cis retinal. Light intensity 2 mW cm−2. Wavelength: λ = 535 nm (MW-opsin), Values are mean + SEM. Cells are sorted units. Statistical significance assessed using Mann–Whitney U test (*p ≤ 0.01)
Fig. 2
Fig. 2
Light response in isolated rd1 mouse retina with MW-Opsin in RGCs. a (Top) Average response to light flash of RGC population expressing MW-opsin (green) or rhodopsin (blue) in rd1 mouse retina. (Bottom) Raster plot of average response of rd1 mouse retina RGCs to 5 flashes of 100 ms duration light at 535 nm for MW-opsin (n = 59 cells) and 510 nm for rhodopsin (n = 27 cells) expressing in RGCs. b, c Light sensitivity for MW-opsin (N = 6 retinas) and rhodopsin (N = 4 retinas) in RGCs of rd1 mouse retina. Peak firing rate normalized to maximum at highest intensity. d, e Time-course of light response. Population average traces with time from light onset to max excitation (time to peak: 355 + 21 ms), exponential fits for excitatory phase (Tau ON: 112 + 25 ms) and decay (Tau OFF: 260 + 31 ms) and full width at half max (FWHM: 183 + 85 ms) (e) for MW-opsin (d; e, green; N = 5 retinas, nc = 104 channels), rhodopsin (e, blue; N = 7 retinas, nc = 134 channels) and wt (e, white; N = 3 retina, nc = 97 channels). f, g Dependence of MW-opsin light response on flash duration. f Representative retina light response (n = 117 cells): population average firing rate (top) and raster plot of unit responses (bottom). g Normalized peak responses for different stimulation durations (2 × 100 mW cm−2, N = 2 retinas, nc = 63 channels). Light intensity 2 × 10−1 mW cm−2 unless specified, Wavelength: λ = 535 nm (MW-opsin) or 510 nm (rhodopsin). N = number of retinas, nc = # of channels, n = number of cells/units. Cells are sorted units. Values are mean + SEM. Statistical significance assessed using Mann–Whitney U test (*p ≤ 0.05)
Fig. 3
Fig. 3
Light avoidance and learned visually guided behavior in rd1 mice expressing MW-opsin or rhodopsin in RGCs. a Schematic of light/dark box for light avoidance test. b, c Respectively for b, c-left and c-right, proportion of time spent in the dark compartment (proportion of avoidance) for rd1 control (gray; n = 5,8,5 mice), rd1 expressing rhodopsin in RGCs (blue; n = 6,8,5 mice) or MW-opsin (green; n = 11,10,4), and wt mice (white; n = 5 mice) when illuminated with either (b) white light (100 μW cm−2), (c) 1 μW cm−2 blue light (470 nm) (right) or green light (535 nm) (left). d Schematic of freezing response fear conditioning experiment. e Quantification of fear response for discrimination of temporally patterned stimulation. Time freezing above baseline is shown for when illumination transitions from static to 2 Hz frequency stimulation (100 μW cm−2) was paired or unpaired with a electric shock for control rd1, rhodopsin, MW-opsin, and wt mice (n = 4,6,12,10 paired, n = 7,8,8,8 unpaired). f Schematic of pattern discrimination experiment. Mice habituated at day 1, then exposed to electric shock in association with specific pattern of light projected to tablets and paired randomly in either chamber (conditioning days 2 and 3). On day 4 recall tested (time spent in each chamber), in absence of shock with light patterns reversed to avoid location bias (See Supplementary Fig. 11d). gi Learned pattern discrimination. Time spent avoiding pattern paired with shock. g Horizontal vs. vertical parallel bars. Discrimination of parallel static (h) or moving (i) bars at distances of 1 vs. 6 cm. Respectively for g, h and i: rd1 control (n = 8,5,16), rd1 rhodopsin (blue; n = 8,6 mice), rd1 MW-opsin (n = 17,11,6) and wt (n = 5,6,9). (25 μW cm−2). (Note, proportion of success for these experiments shown in Supplementary Fig. 11). Light intensity = 25–100 μW cm−2; Wavelength: = 535 nm (MW-opsin), 510 nm (rhodopsin) or white light (MW-opsin). n = number of mice. Values are mean + SEM. Statistical significance assessed using Student’s two-tailed t-test with Bonferroni correction: *p < 0.05
Fig. 4
Fig. 4
Light adaptation in RGC activity and visually guided behavior by MW-opsin. ac MEA recordings in isolated retina of RGC light response mediated by MW-opsin in RGCs of rd1 mouse retina show sensitivity difference with retina adapted to dark versus light. a Light response decay (Tau OFF) as a function of flash intensity in dark versus light adapted condition (N = 3 retinas, nc = 88 channels). b Example intensity-response curve for representative retina first dark adapted (filled symbols) then light adapted (open symbols) (n = 56 cells). White light adaptation. ChR2 minimum value from Bi et al. and Sengupta et al.. c Average (error bars are SEM) normalized Light response Index (LRI) at 3 flash intensities in same retina, first dark adapted and then light adapted (N = 3 retinas, nc = 88 channels). df Behavior shows light adaptation in visually guided tasks. d Schematic of adaptation to dark or light prior to testing of innate avoidance behavior or learned pattern discrimination behavior. e Proportion of time spent in the dark compartment (proportion of avoidance) under 100 μW cm−2 (bright light) or 1 μW cm−2 (dim indoor light) following 1 h. of adaptation to dark (N = 11 mice) or adaptation to light (white light; 1 mW cm−2/535 nm spectral component; ~50 μW cm−2; N = 11,13 mice). f Learned pattern discrimination of parallel bars spaced at distances of 1 versus 6 cm displayed at low (0.25 μW cm−2) or indoor (10 μW cm−2) light levels following 1 h. of adaptation to dark (N = 11 and 8 mice for each display) or light (white light; 1 mW cm−2/535 nm spectral component; 50 μW cm−2; N = 10 and 7 mice for each display). Performance was also reported in cohorts experiencing 4 and 8 h. of light adaptation (N = 7 mice). Dotted line denotes average performance of untreated rd1 control mice and performance (gray N = 5 mice) reproduced from Fig. 3h for reference and comparison. Wavelength: λ = 535 nm. N = # of animals, n = # of retina, nc = number of channels. Cells are identified as sorted units. Values are mean + SEM. Statistical significance assessed using Mann-Whitney U test (*p < 0.01). Student’s two-tailed t-test with Bonferroni correction: *p < 0.05
Fig. 5
Fig. 5
Restoration of visually guided exploratory behavior by MW-opsin. ad Open field behavioral arena containing two novel objects with traces of the first minute locomotion track from 3 representative animals per condition: untreated rd1 mice (a), rhodopsin expressing rd1 mice (b), MW-opsin expressing rd1 mice (c), and wt mice (d). e, f Total distance traveled and average velocity of mice during 10 min of exploration in the novel object behavior box. gl Latency to exploration of first object (g), cumulative latency to exploration of the second object (h), velocity of travel to the first (i) and second object (j), distance traveled to first (k) and second object (l) for rd1-sham injected (dark gray) (n = 4), rd1 untreated (gray) (n = 13), rhodopsin (blue) (n = 11), MW-opsin (green) (n = 11) and wt (white) (n = 8). Values are mean + SEM. Statistical significance assessed using a two-tailed t test (*p < 0.05)

References

    1. Leveillard T, Sahel JA. Rod-derived cone viability factor for treating blinding diseases: from clinic to redox signaling. Sci. Transl. Med. 2010;2:26ps16. doi: 10.1126/scitranslmed.3000866. - DOI - PMC - PubMed
    1. Ratnapriya R, Chew EY. Age-related macular degeneration-clinical review and genetics update. Clin. Genet. 2013;84:160–166. doi: 10.1111/cge.12206. - DOI - PMC - PubMed
    1. Daiger SP, Bowne SJ, Sullivan LS. Perspective on genes and mutations causing retinitis pigmentosa. Arch. Ophthalmol. 2007;125:151–158. doi: 10.1001/archopht.125.2.151. - DOI - PMC - PubMed
    1. Ferrari S, et al. Retinitis pigmentosa: genes and disease mechanisms. Curr. Genom. 2011;12:238–249. doi: 10.2174/138920211795860107. - DOI - PMC - PubMed
    1. Tuo J, Bojanowski CM, Chan CC. Genetic factors of age-related macular degeneration. Prog. Retin. Eye. Res. 2004;23:229–249. doi: 10.1016/j.preteyeres.2004.02.001. - DOI - PMC - PubMed

Publication types

MeSH terms