. 2019 Mar 15;9(1):4616.
doi: 10.1038/s41598-019-40851-9.

In vitro metabolic activation of vitamin D3 by using a multi-compartment microfluidic liver-kidney organ on chip platform

Affiliations

In vitro metabolic activation of vitamin D3 by using a multi-compartment microfluidic liver-kidney organ on chip platform

Jannick Theobald et al. Sci Rep. .

Abstract

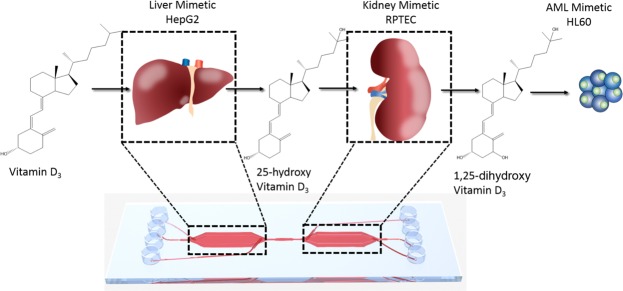
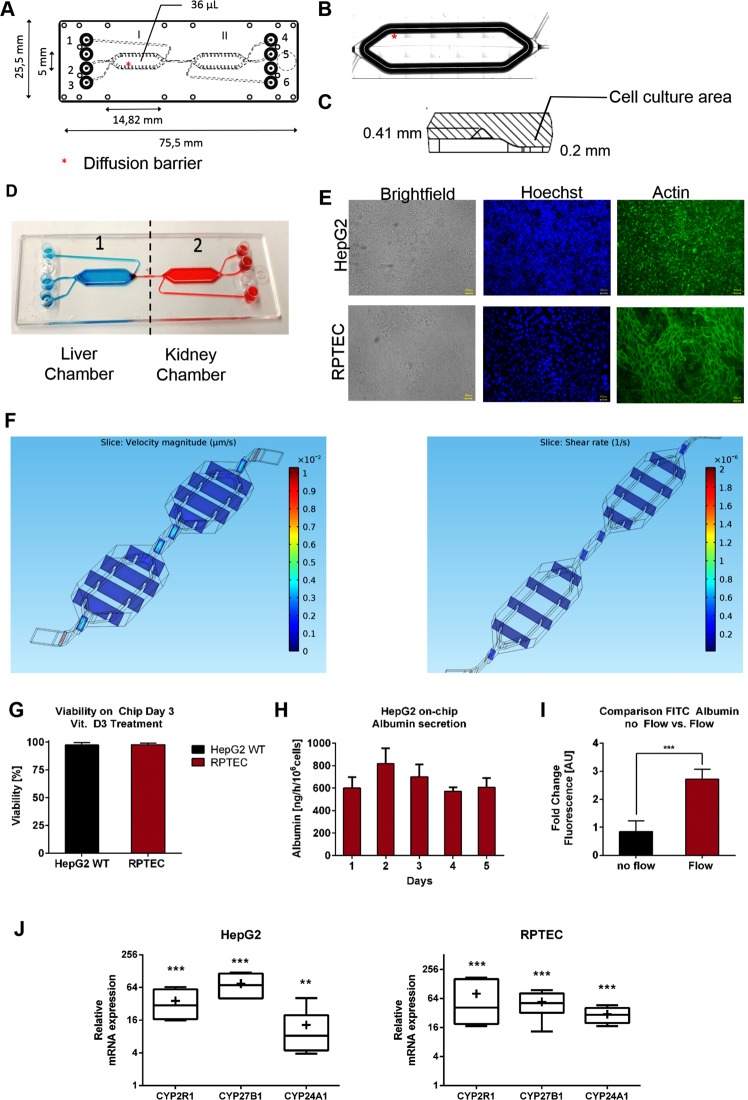
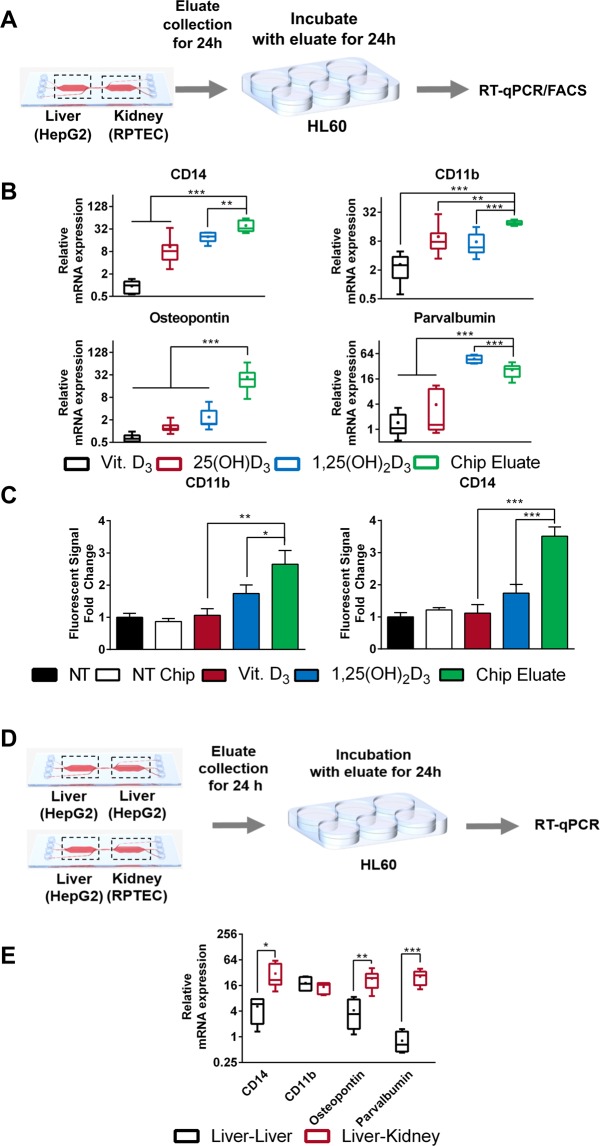
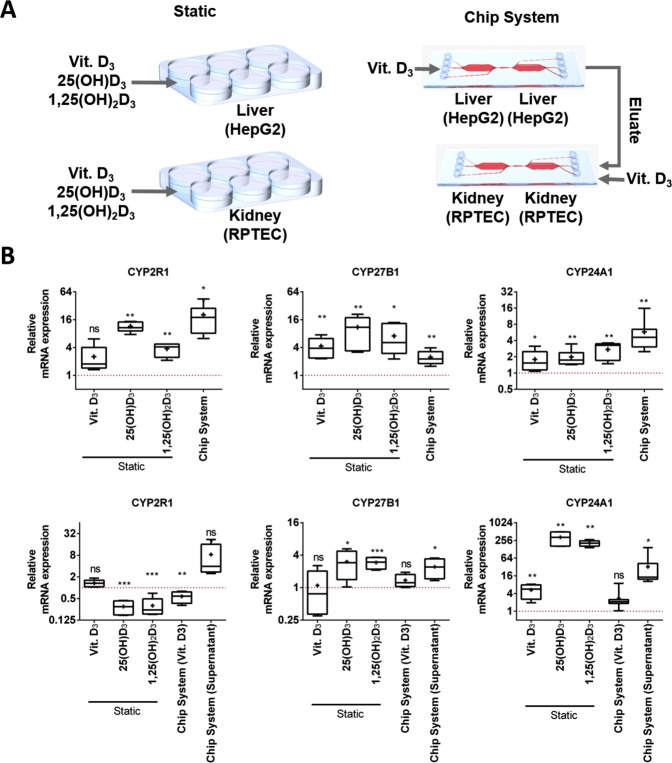
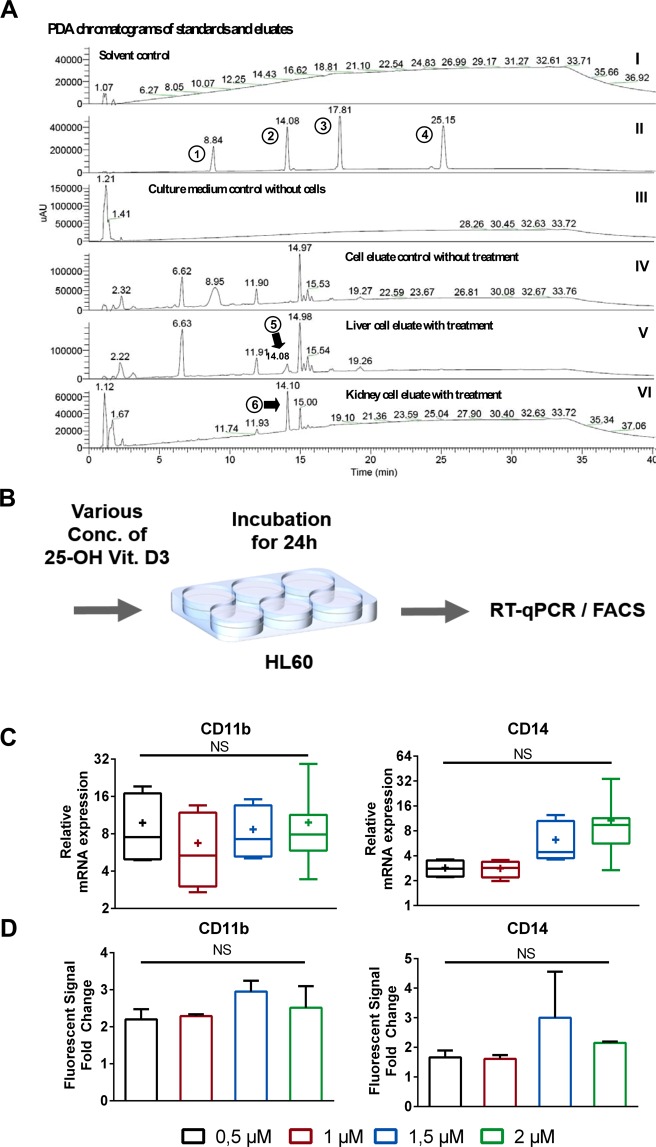
Organ-on-chip platforms provide models that allow the representation of human physiological processes in cell-based miniaturized systems. Potential pre-clinical applications include drug testing and toxicity studies. Here we describe the use of a multi-compartment micro-fluidic chip to recapitulate hepatic vitamin D metabolism (vitamin D to 25-hydroxyvitamin D) and renal bio-activation (25-hydroxyvitamin D to 1,25-dihydroxyvitamin D) in humans. In contrast to cultivation in conventional tissue culture settings, on-chip cultivation of HepG2 and RPTEC cells in interconnected chambers, used to mimic the liver and kidneys, respectively, resulted in the enhanced expression of vitamin D metabolizing enzymes (CYP2R1, CYP27B1 and CYP24A1). Pump-driven flow of vitamin D3-containing medium through the microfluidic chip produced eluate containing vitamin D3 metabolites. LC-MSMS showed a strong accumulation of 25-hydroxyvitamin D. The chip eluate induced the expression of differentiation markers in HL-60 (acute myeloid leukemia) cells, assessed by qPCR and FACS analysis, in a manner similar to treatment with reference standards indicating the presence of fully activated 1,25 dihydroxyvitamin D, although the latter was not detected in the eluate by LC-MSMS. Interestingly, 25-hydroxyvitamin D by itself led to weak activation of HL-60 cells suggesting that 25-hydroxyvitamin D is also an active metabolite. Our experiments demonstrate that complex metabolic interactions can be reconstructed outside the human body using dedicated organ-on-chip platforms. We therefore propose that such systems may be used to mimic the in vivo metabolism of various micronutrients and xenobiotics.


Conflict of interest statement

The authors declare no competing interests.

Figures

Figure 1
Figure 1
Schematic overview of vitamin D3 metabolism and bio-activation on-chip. Vitamin D3 is introduced into the microfluidic chip system and metabolised by the liver chamber giving rise to 25(OH)D3, which is then transported via the microfluidic flow to the kidney chamber where it is further metabolised to 1,25(OH)2D3. This bioactive form is then given to HL-60 cells and pro-differentiation effects of the molecule are investigated.
Figure 2
Figure 2
(A) Geometry of the two chamber microfluidic system. Chips are fabricated by microfluidic ChipShop Jena. (B) Position of the guidance barrier on the edge of the cell culture area. (C) Side view of the guidance barrier with specific height. (D) Illustration of the individual seeding of the two compartments of the Chip using food dye. (E) Brightfield picture and immufluorescent staining of HepG2 and RPTEC cells within the microfluidic system using Hoechst (blue) and Phalloidin Actin Dye (green). Images show confluent monolayer and sporadic 3D formations. (F) Simulation of flow velocity and shear rate in two chamber chip design using flow rates of 20 µL/h. Shear rate and velocity flow rate were highest in the narrow inlet and outlet part of the chambers. Shear rate within the culture are was calculated to be as low as 0.05 Pa. (G) Viability of HepG2 and RPTEC cells on-chip after 3 days of culture. Values are calculated as ratio of PI-negative cells divided by total cell number. Numbers are calculated in percentage as average of n = 3 Chips with 20 Pictures per Chip per chamber. (H) Albumin secretion of HepG2 cells cultured in microfluidic chips. Albumin secretion remained constant over the culture period (5 days), with a concentration of >600 ng/h/106 cells. Data presented are the average of 3 independent experiments. Error bars ± SD. (I) Comparison of FITC-Albumin uptake of RPTEC cells under static and fluidic conditions. Values are plotted as fold change in fluorescence intensity [AU]. Analysis of fluorescence intensity was performed using ImageJ. (J) Comparison of CYP mRNA expression under static and microfluidic conditions for HepG2 and RPTEC cells using RT-qPCR. Relative expression values are calculated using the ∆∆Ct method with RPL-30 as the reference gene. Lines in the middle of the box plot represent the median, whereas the + sign represents the mean of more than 3 independent experiments. Error bars ± SD. Statistical significance between the different culture conditions was calculated using an unpaired two-tailed Student’s t-test, where p-values less than or equal to 0.05, 0.01, and 0.001, depicted as *, **, and ***, respectively.
Figure 3
Figure 3
(A) Explanatory workflow using the eluate of the chip system to treat HL60 cells for 24 hours and perform RT-qPCR analysis shown in (B) and FACS shown in (C). (B) Effect of various treatments on the mRNA expression of multiple differentiation markers (CD14, CD11b, Osteopontin and Parvalbumin) in HL60 cells using RT-qPCR. Note that chip eluate refers to the eluate of a chip containing both HepG2 and RPTEC cells in subsequent chambers, which was fed with medium containing vitamin D3. (C) Analysis of CD11b and CD14 protein levels in HL-60 cells in response to different treatments using FACS. Values are presented as fold change of fluorescence intensity normalized to fluorescence intensity non-treated cells. Values are the mean of two biological replicates. Error bars ± SD. (D) Explanatory workflow to investigate the effect of the kidney chamber in the two compartment microfluidic setup. (E) Comparison of the expression of HL-60 differentiation markers, treated with the eluate of a HepG2-liver-chip only (black) and a HepG2-RPTEC liver-kidney chip (red). For all figures lines in the middle of the box plot represent the median, whereas the + sign represents the mean of more than 5 independent experiments Error bars ± SD Statistical significance between the cells treated with the chip eluate and other treatments was calculated using an unpaired two-tailed Student’s t-test, where p-values less than or equal to 0.05, 0.01, and 0.001, depicted as *, **, and ***, respectively.
Figure 4
Figure 4
(A) Illustration of the performed experiments investigating regulation of various CYPs by treatment of HepG2 and RPTEC cells cultured in static and microfluidic setups. (B) Comparison of CYP mRNA expression in HepG2 (upper row) and RPTEC cells (lower row). In the upper row Chip System refers to a HepG2 chip treated with vitamin D3, in the lower row Chip System (Vit. D3) refers to a RPTEC chip treated with vitamin D3 and Chip System (Supernatant) refers to a RPTEC chip treated with the eluate of a HepG2 chip fed with vitamin D3. The different treatments are illustrated in A. Values for HepG2 and RPTEC cells were obtained using RT-qPCR. Relative expression values are calculated using the ∆∆Ct method with RPL-30 as the reference gene. Lines in the middle of the box plot represent the median, whereas the + sign represents the mean of more than 5 independent experiments. Error bars ± SD. Statistical significance between the different culture conditions was calculated using an unpaired two-tailed Student’s t-test, where p-values less than or equal to 0.05, 0.01, and 0.001, depicted as *, **, and ***, respectively.
Figure 5
Figure 5
Verification of biosynthesis of 25(OH)D3 after addition of 20 µM vitamin D3 in microfluidic eluate by LC-MSMS. (A) PDA chromatograms; I: MeOH negative control; II: Standards 1,25(OH)D3 (1), 25(OH)D3 (2), 1(OH)D3 (3), and vitamin D3 (4); III: Cell culture medium pure; IV: Culture medium of cell culture without treatment; V: Eluate of HepG2 microfluidic chip fed with cell culture medium containing 20 µM vitamin D3; VI: Eluate of RPTEC microfluidic chip fed with cell culture medium containing 20 µM vitamin D3. (Peak analysis in supplementary Fig. 4). (B) Explanatory workflow to determine the influence of 25(OH)D3 concentration on HL60 cells for using RT-qPCR shown in (C) and FACS shown in (D). (C) Effect of various concentration of 25(OH)D3 on the mRNA expression of CD14, CD11b in HL60 cells using RT-qPCR. (D) Analysis of CD11b and CD14 protein levels in HL-60 cells in response to different concentration of 25(OH)D3 using FACS.

References

    1. Holick MF. Vitamin D deficiency. N Engl J Med. 2007;357(3):266–81. doi: 10.1056/NEJMra070553. - DOI - PubMed
    1. Feldman D, et al. The role of vitamin D in reducing cancer risk and progression. Nat Rev Cancer. 2014;14(5):342–57. doi: 10.1038/nrc3691. - DOI - PubMed
    1. Cheng JB, et al. Genetic evidence that the human CYP2R1 enzyme is a key vitamin D 25-hydroxylase. Proc Natl Acad Sci USA. 2004;101(20):7711–5. doi: 10.1073/pnas.0402490101. - DOI - PMC - PubMed
    1. Deeb KK, Trump DL, Johnson CS. Vitamin D signalling pathways in cancer: potential for anticancer therapeutics. Nat Rev Cancer. 2007;7(9):684–700. doi: 10.1038/nrc2196. - DOI - PubMed
    1. Abu El Maaty, M. A. et al. 1,25(OH)2D3 Disrupts glucose metabolism in prostate cancer cells leading to a truncation of the tca cycle and inhibition of txnip expression. (Biochim Biophys Acta, 2017). - PubMed

Publication types