

Trends and Patterns of Geographic Variation in Opioid Prescribing Practices by State, United States, 2006-2017
- PMID: 30874783
- PMCID: PMC6484643
- DOI: 10.1001/jamanetworkopen.2019.0665
Trends and Patterns of Geographic Variation in Opioid Prescribing Practices by State, United States, 2006-2017
Erratum in
-
Errors in eFigure Title and Caption in the Supplement.JAMA Netw Open. 2019 May 3;2(5):e194307. doi: 10.1001/jamanetworkopen.2019.4307. JAMA Netw Open. 2019. PMID: 31050768 Free PMC article. No abstract available.
Abstract
Importance: Risk of opioid use disorder, overdose, and death from prescription opioids increases as dosage, duration, and use of extended-release and long-acting formulations increase. States are well suited to respond to the opioid crisis through legislation, regulations, enforcement, surveillance, and other interventions.
Objective: To estimate temporal trends and geographic variations in 6 key opioid prescribing measures in 50 US states and the District of Columbia.
Design, setting, and participants: Population-based cross-sectional analysis of opioid prescriptions filled nationwide at US retail pharmacies between January 1, 2006, and December 31, 2017. Data were obtained from the IQVIA Xponent database. All US residents who had an opioid prescription filled at a US retail pharmacy were included.
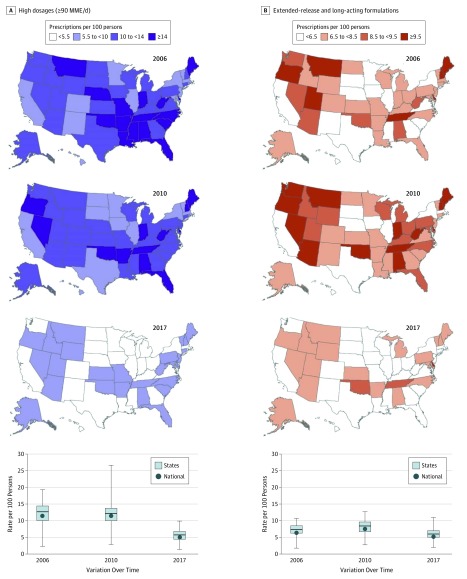
Main outcomes and measures: Primary outcomes were annual amount of opioids prescribed in morphine milligram equivalents (MME) per person; mean duration per prescription in days; and 4 separate prescribing rates-for prescriptions 3 or fewer days, those 30 days or longer, those with a high daily dosage (≥90 MME), and those with extended-release and long-acting formulations.
Results: Between 2006 and 2017, an estimated 233.7 million opioid prescriptions were filled in retail pharmacies in the United States each year. For all states combined, 4 measures decreased: (1) mean (SD) amount of opioids prescribed (mean [SD] decrease, 12.8% [12.6%]) from 628.4 (178.0) to 543.4 (158.6) MME per person, a statistically significant decrease in 23 states; (2) high daily dosage (mean [SD] decrease, 53.1% [13.6%]) from 12.3 (3.4) to 5.6 (1.7) per 100 persons, a statistically significant decrease in 49 states; (3) short-term (≤3 days) duration (mean [SD] decrease, 43.1% [9.4%]) from 18.0 (5.4) to 10.0 (2.5) per 100 persons, a statistically significant decrease in 48 states; and (4) extended-release and long-acting formulations (mean [SD] decrease, 14.7% [13.7%]) from 7.2 (1.9) to 6.0 (1.7) per 100 persons, a statistically significant decrease in 27 states. Two measures increased, each associated with the duration of prescription dispensed: (1) mean (SD) prescription duration (mean [SD] increase, 37.6% [6.9%]) from 13.0 (1.2) to 17.9 (1.4) days, a statistically significant increase in every state; and (2) prescriptions for a term of 30 days or longer (mean [SD] increase, 37.7% [28.9%]) from 18.3 (7.7) to 24.9 (10.7) per 100 persons, a statistically significant increase in 39 states. Two- to 3-fold geographic differences were observed across states, measured by comparing the ratio of each state's 90th to 10th percentile for each measure.
Conclusions and relevance: In this study, across 12 years, the mean duration and prescribing rate for long-term prescriptions of opioids increased, whereas the amount of opioids prescribed per person and prescribing rate for high-dosage prescriptions, short-term prescriptions, and extended-release and long-acting formulations decreased. Some decreases were significant, but results were still high. Two- to 3-fold state variation in 5 measures occurred in most states. This information may help when state-specific intervention programs are being designed.
Conflict of interest statement
Figures


References
-
- Manchikanti L, Kaye AM, Knezevic NN, et al. . Responsible, safe, and effective prescription of opioids for chronic non-cancer pain: American Society of Interventional Pain Physicians (ASIPP) Guidelines. Pain Physician. 2017;20(2S):S3-S92. - PubMed
MeSH terms
Substances
LinkOut - more resources
Full Text Sources
Medical
Molecular Biology Databases
Miscellaneous
