. 2019 Mar 1;2(3):e191938.
doi: 10.1001/jamanetworkopen.2019.1938.

Twenty-Year Trends in Outcomes for Older Adults With Acute Myocardial Infarction in the United States

Affiliations

Twenty-Year Trends in Outcomes for Older Adults With Acute Myocardial Infarction in the United States

Harlan M Krumholz et al. JAMA Netw Open. .

Abstract

Importance: Medicare and other organizations have focused on improving quality of care for patients with acute myocardial infarction (AMI) over the last 2 decades. However, there is no comprehensive perspective on the evolution of outcomes for AMI during that period, and it is unknown whether temporal changes varied by patient subgroup, hospital, or county.

Objective: To provide a comprehensive evaluation of national trends in inpatient outcomes and costs of AMI during this period.

Design, setting, and participants: This cohort study included analysis of data from a sample of 4 367 485 Medicare fee-for-service beneficiaries aged 65 years or older from January 1, 1995, through December 31, 2014, across 5680 hospitals in the United States. Analyses were conducted from January 15 to June 5, 2018.

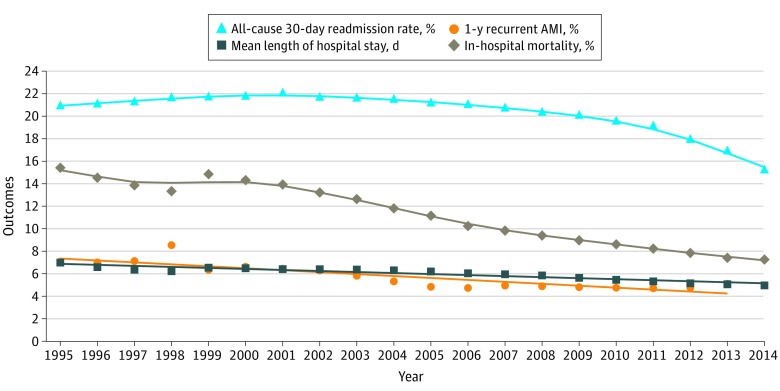
Main outcomes and measures: Thirty-day all-cause mortality at the patient, hospital, and county levels. Additional outcomes included 30-day all-cause readmissions; 1-year recurrent AMI; in-hospital mortality; length of hospital stay; 2014 Consumer Price Index-adjusted median Medicare inpatient payment per AMI discharge; and rates of catheterization, percutaneous coronary intervention, and coronary artery bypass graft surgery.

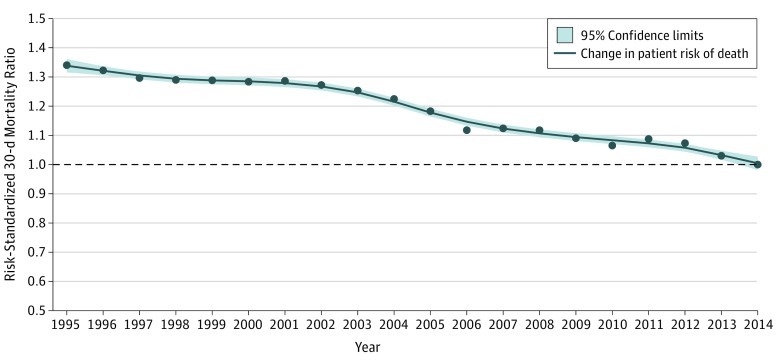
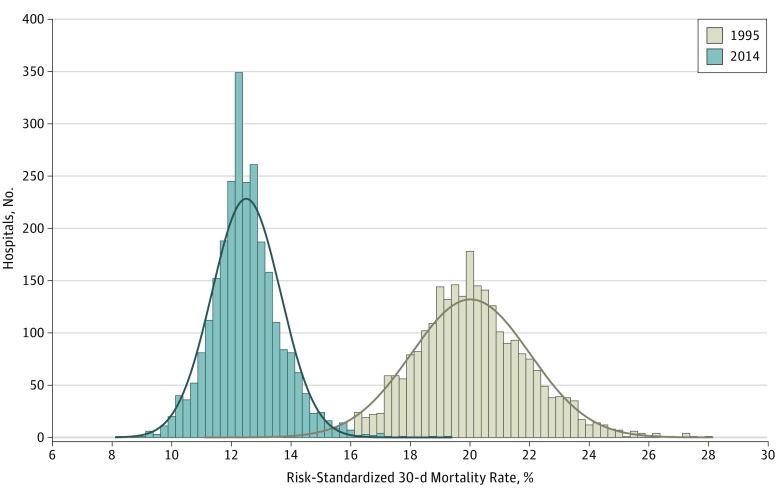
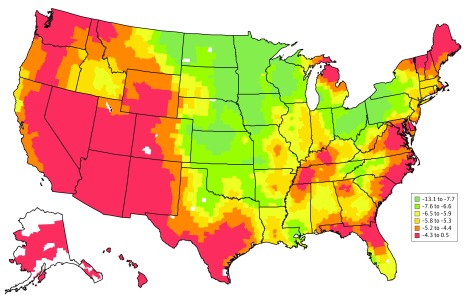
Results: The cohort included 4 367 485 Medicare fee-for-service patients aged 65 years or older hospitalized for AMI during the study period. Between 1995 and 2014, the mean (SD) age of patients increased from 76.9 (7.2) to 78.2 (8.7) years, the percentage of female patients declined from 49.5% to 46.1%, the percentage of white patients declined from 91.0% to 86.2%, and the percentage of black patients increased from 5.9% to 8.0%. There were declines in AMI hospitalizations (914 to 566 per 100 000 beneficiary-years); 30-day mortality (20.0% to 12.4%; difference, 7.6 percentage points; 95% CI, 7.3-7.8 percentage points); 30-day all-cause readmissions (21.0% to 15.3%; difference, 5.7 percentage points; 95% CI, 5.4-6.0 percentage points); and 1-year recurrent AMI (7.1% to 5.1%; difference, 2.0 percentage points; 95% CI, 1.8-2.2 percentage points). There were increases in the 2014 Consumer Price Index-adjusted median (interquartile range) Medicare inpatient payment per AMI discharge ($9282 [$6969-$12 173] to $11 031 [$8099-$16 861]); 30-day inpatient catheterization (44.2% to 59.9%; difference, 15.7 percentage points; 95% CI, 15.4-16.0 percentage points); and inpatient percutaneous coronary intervention (18.8% to 43.3%; difference, 24.5 percentage points; 95% CI, 24.2-24.7 percentage points). Coronary artery bypass graft surgery rates decreased from 14.4% to 10.2% (difference, 4.2 percentage points; 95% CI, 3.9-4.3 percentage points). There was heterogeneity by hospital and county in the mortality changes over time.

Conclusions and relevance: This study shows marked improvements in short-term mortality and readmissions, with an increase in in-hospital procedures and payments, for the increasingly smaller number of Medicare beneficiaries with AMI.


Conflict of interest statement

Conflict of Interest Disclosures: Dr Krumholz reported personal fees from UnitedHealth, IBM Watson Health, Element Science, Aetna, Facebook, Arnold & Porter, and the Ben C. Martin Law Firm; grants from the Centers for Medicare & Medicaid Services, Medtronic, Johnson & Johnson, and the Food and Drug Administration; and serving as founder of the personal health information platform Hugo outside the submitted work. Dr Normand reported a patent to 201810345624.5 pending. No other disclosures were reported.

Figures

Figure 1.
Figure 1.. Change in Adjusted Risk of 30-Day Acute Myocardial Infarction Mortality at the Patient Level Between 1995 and 2014
Points indicate year-specific risk-standardized 30-day mortality ratios. The line was smoothed using the locally estimated scatterplot smoothing (LOESS) method (local regression).
Figure 2.
Figure 2.. Change in Hospital-Specific Risk-Standardized 30-Day Acute Myocardial Infarction Mortality Rates Between 1995 and 2014
The size of each bar reflects the number of hospitals that filled in a particular interval of risk-standardized mortality rate as well as the distributions (ranges) of rates in 1995 and 2014. The curves represent distribution of the data. Mean (SD) risk-standardized 30-day mortality rates were 20.0% (2.0%) and 12.5% (1.2%) for 1995 and 2014, respectively (n = 2635 hospitals). Restricted to hospitals that had at least 1 case in both 1995 and 2014.
Figure 3.
Figure 3.. Difference in County-Specific 30-Day Risk-Standardized Acute Myocardial Infarction Mortality Rates Between 1995 to 1998 and 2011 to 2014
The difference was calculated as the percentage point between the 2011 to 2014 combined rate minus the 1995 to 1998 combined rate. Counties are shaded according to the difference in percentage points of the risk-standardized acute myocardial infarction mortality rates (percentage). Counties with negative values had mortality rates that were lower in 2011 to 2014 than in 1995 to 1998. Counties with the largest decline between 2011 to 2014 and 1995 to 1998 are shaded green, while those with the smallest decline or even increase in mortality between 2011 to 2014 and 1995 to 1998 are shaded red. Counties are shaded white if there were missing or insufficient data that precluded the calculation of mortality rates.
Figure 4.
Figure 4.. Changes in 30-Day All-Cause Readmissions, 1-Year Recurrent Acute Myocardial Infarction (AMI), In-Hospital Mortality, and Length of Stay
Symbols denote observed values and lines represent changes over time. Lines were smoothed using the locally estimated scatterplot smoothing (LOESS) method (local regression). Triangles indicate 30-day all-cause readmissions; circles, 1-year recurrent AMI; diamonds, in-hospital mortality; and squares, length of stay.

References

    1. Ellerbeck EF, Jencks SF, Radford MJ, et al. . Quality of care for Medicare patients with acute myocardial infarction: a four-state pilot study from the Cooperative Cardiovascular Project. JAMA. 1995;273(19):-. doi:10.1001/jama.1995.03520430045037 - DOI - PubMed
    1. Chen HY, Gore JM, Lapane KL, et al. . A 35-year perspective (1975 to 2009) into the long-term prognosis and hospital management of patients discharged from the hospital after a first acute myocardial infarction. Am J Cardiol. 2015;116(1):24-29. doi:10.1016/j.amjcard.2015.03.035 - DOI - PMC - PubMed
    1. Chen HY, Tisminetzky M, Lapane KL, et al. . Decade-long trends in 30-day rehospitalization rates after acute myocardial infarction. J Am Heart Assoc. 2015;4(11):e002291. doi:10.1161/JAHA.115.002291 - DOI - PMC - PubMed
    1. Gerber Y, Weston SA, Jiang R, Roger VL. The changing epidemiology of myocardial infarction in Olmsted County, Minnesota, 1995-2012. Am J Med. 2015;128(2):144-151. doi:10.1016/j.amjmed.2014.09.012 - DOI - PMC - PubMed
    1. Krumholz HM, Normand SL, Wang Y. Trends in hospitalizations and outcomes for acute cardiovascular disease and stroke, 1999-2011. Circulation. 2014;130(12):966-975. doi:10.1161/CIRCULATIONAHA.113.007787 - DOI - PMC - PubMed