. 2019 Jul;39(5):619-636.
doi: 10.1007/s10571-019-00667-7. Epub 2019 Mar 14.

Neuroprotective Role of Selected Antioxidant Agents in Preventing Cisplatin-Induced Damage of Human Neurons In Vitro

Affiliations

Neuroprotective Role of Selected Antioxidant Agents in Preventing Cisplatin-Induced Damage of Human Neurons In Vitro

Jelena Popović et al. Cell Mol Neurobiol. 2019 Jul.

Abstract

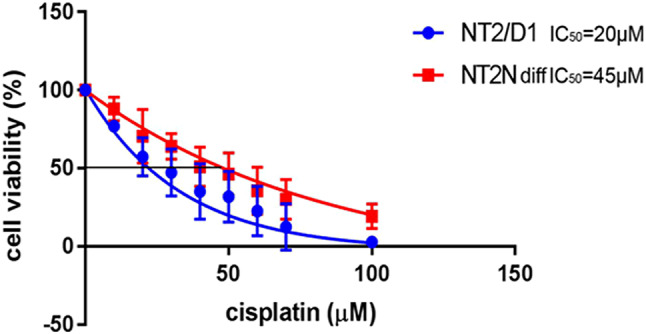
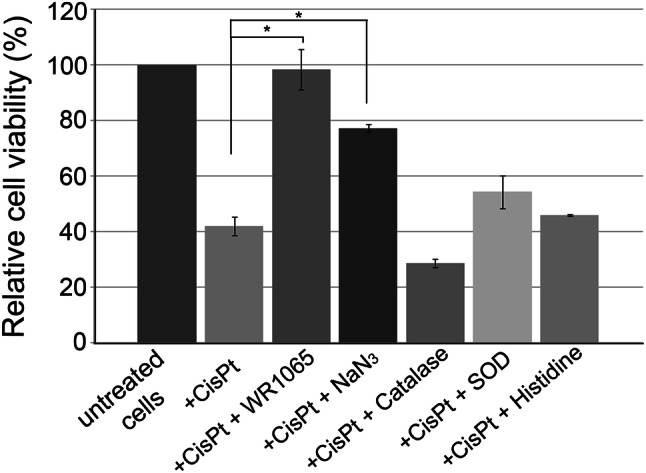
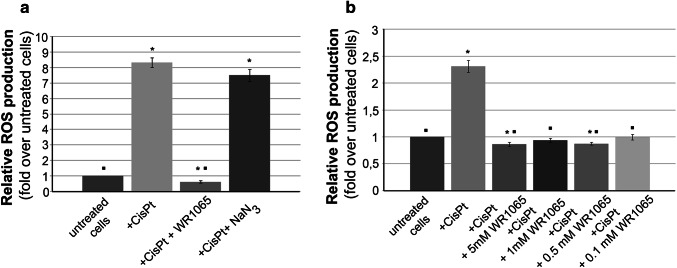
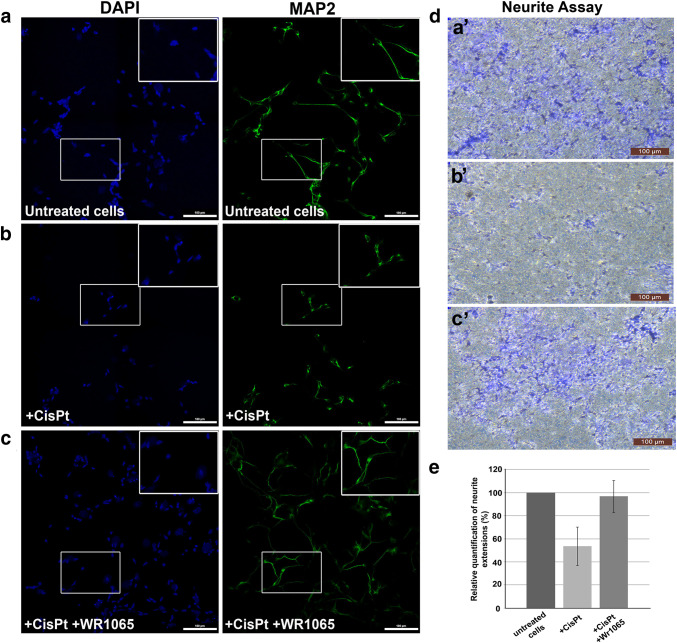
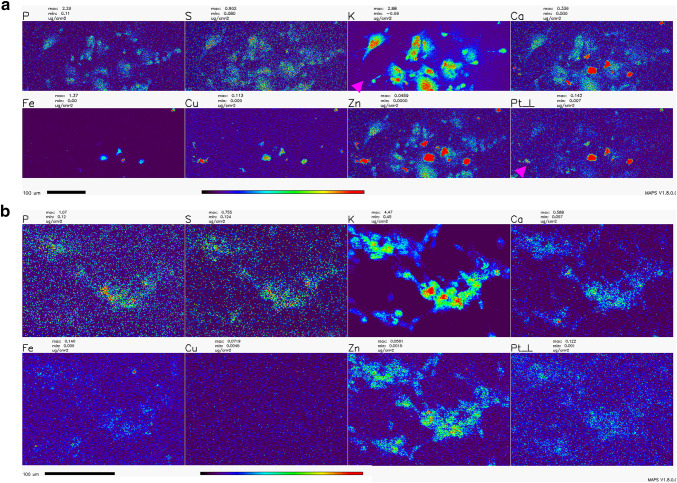
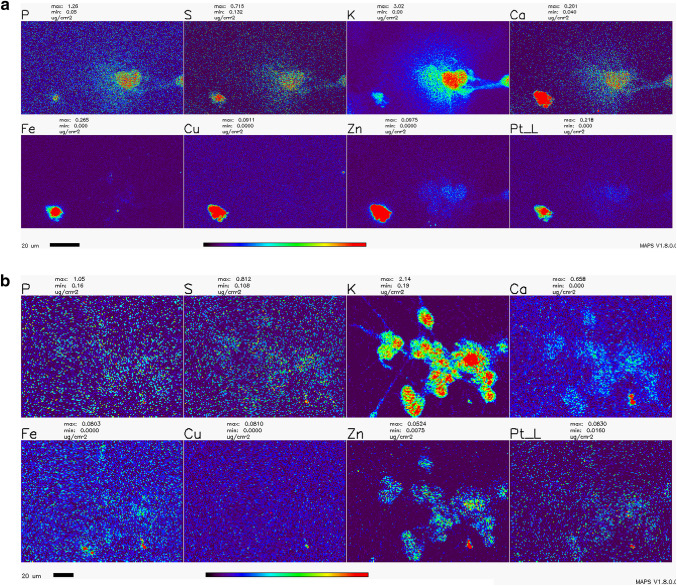
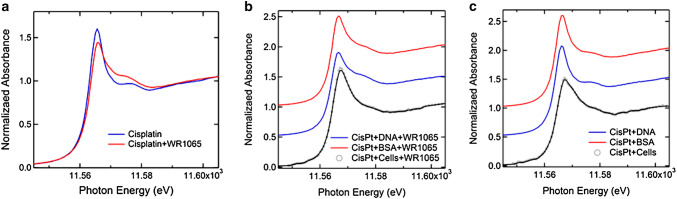
Chemotherapy-induced peripheral neuropathy (CIPN) is a side effect of platinum-based chemotherapy and decreases the quality of life of cancer patients. We compared neuroprotective properties of several agents using an in vitro model of terminally differentiated human cells NT2-N derived from cell line NT2/D1. Sodium azide and an active metabolite of amifostine (WR1065) increase cell viability in simultaneous treatment with cisplatin. In addition, WR1065 protects the non-dividing neurons by decreasing cisplatin caused oxidative stress and apoptosis. Accumulation of Pt in cisplatin-treated cells was heterogeneous, but the frequency and concentration of Pt in cells were lowered in the presence of WR1065 as shown by X-ray fluorescence microscopy (XFM). Transition metals accumulation accompanied Pt increase in cells; this effect was equally diminished in the presence of WR1065. To analyze possible chemical modulation of Pt-DNA bonds, we examined the platinum LIII near edge spectrum by X-ray absorption spectroscopy. The spectrum found in cisplatin-DNA samples is altered differently by the addition of either WR1065 or sodium azide. Importantly, a similar change in Pt edge spectra was noted in cells treated with cisplatin and WR1065. Therefore, amifostine should be reconsidered as a candidate for treatments that reduce or prevent CIPN.

Keywords: Amifostine; CIPN; Cisplatin; Neuroprotection; XFM.


Conflict of interest statement

The authors declare that they have no conflict of interest.

Figures

Fig. 1
Fig. 1
IC50 determination for undifferentiated (NT2/D1) and differentiated (NT2-N) cells. Undifferentiated and differentiated cells were exposed to increasing concentrations of cisplatin (from 10 to 100 µM) for 60 min and their viability was tested 48 h later by MTS assay
Fig. 2
Fig. 2
Relative viability of NT2-N cells upon treatment with cisplatin alone or in combination with different antioxidants. NT2-N cells were co-treated with IC50 concentration of cisplatin and 5 mM WR1065; 10 mM NaN3, 400 U catalase; 150 U SOD, or 10 mM histidine. Relative cell viability was calculated compared to untreated NT2-N cells which were set as 100%. Results are presented as the means ± S.E.M. of at least three independent experiments, each performed in six replicates. Mean values were compared with Student’s t test; *p ≤ 0.05
Fig. 3
Fig. 3
Effect of WR1065 and NaN3 on ROS production in NT2-N cells induced by cisplatin. The overall cisplatin-induced oxidative stress in NT2-N cells was quantified by intracellular DCF fluorescence. Relative ROS production was calculated compared to untreated NT2-N cells which were set as 1, and results are presented as fold over untreated cells. a NT2-N cells were co-treated with cisplatin and 5 mM WR1065 or 10 mM NaN3; b NT2-N cells were co-treated with cisplatin and different concentrations of WR1065. Results are presented as the means ± S.E.M. of at least three independent experiments. Mean values were compared using Student’s t test. Statistically significant differences (p ≤ 0.05) are indicated with an asterisk when samples were compared to control, or with a square when samples were compared to cisplatin exposed cells
Fig. 4
Fig. 4
Analysis of apoptosis in NT2-N cells. Western blots (a, b) and flow cytometry analysis of apoptosis (c, d). For Western blots untreated cells and cells exposed to cisplatin alone (+ CisPt) or in combination with WR1065 (+ CisPt + WR1065) were harvested and their total protein content isolated. a Analysis of caspase 3 cleavage; activated Caspase 3 fragments are detected as 19 kDa and 17 kDa molecular weight bands. b Analysis of cleaved PARP; carboxy-terminal catalytic domain of PARP released upon cleavage generated 89 kDa band. GAPDH was used as a control of equal protein loading. c NT2-N cells were exposed to cisplatin alone or in combination with WR1065 and analyzed by flow cytometry after 24 h. Whole cells selected by gating were stained by PI and Annexin V and separated into quadrants. Q1: PI+/Annexin-cells are necrotic; Q2: PI+/Annexin + cells are late apoptotic cells; Q3: PI-/Annexin-cells are alive; Q4: PI-/Annexin V + cells are in early apoptosis. d Two independent flow cytometry experiments were done with similar outcomes—average values and standard deviation are presented in the table for early and late apoptotic cells
Fig. 5
Fig. 5
NT2-N morphology and neurite outgrowth assay. Panels a to c show MAP2 immunocytochemistry of differentiated NT2-N cells – untreated control cells (a), cells treated with 40 µM cisplatin alone (b), cells co-treated with 40 µM cisplatin and 5 mM WR1065 (c). Cell nuclei were stained with DAPI (represented in blue) while MAP2 staining is shown in green. Boxed regions in a, b, and c are enlarged in upper right corner of each panel. Scale bars represent 100 microns. Neurite Outgrowth Assay (d, e): 105 NT2-N cells were seeded on each insert for Neurite Outgrowth Assay and allowed to extend neurites for 48 h. Then, cells were stained with Neurite Stain Solution for 30 min and the cell bodies were removed from the upper part of the insert. Neurite extensions were visualized using inverted microscope focused on the underside of the insert’s membrane (d: a’—untreated cells; b’—cells treated with 40 µM cisplatin; c’—cells treated with 40 µM cisplatin + 5 mM WR1065). Magnification 10×, scale bar 100 µm. e shows relative quantification of neurite extensions by spectrophotometry at 562 nm, according to manufacturer’s instructions. Relative quantification was calculated with untreated NT2-N cells value set at 100%. Results are presented as the means ± S.E.M. of three independent experiments with cells obtained from three independent NT2 cell differentiation experiments
Fig. 6
Fig. 6
Overview XFM scans of NT2-N cells treated with cisplatin with and without the addition of WR1065. a—cisplatin only; b—cisplatin and WR1065 co-treatment. Note the heterogeneity between cells and that cells with low K signal intensities have highest Pt pixel intensities (magenta arrowheads). The same group of cells also had high Ca, Fe, Cu and Zn signals. In addition, cells with an apparently high Pt signal are relatively abundant in cisplatin alone treatment (a), compared to cisplatin-WR1065 combined treatment (b). Scale bars are 100 microns, color bar indicates that per pixel concentrations for each element range from black (no signal) to red (highest signal for a given element). Concentration ranges per-pixel are indicated above each element’s map, e.g., Pt per-pixel concentrations based in top panel (cisplatin alone) range from 0.007 µg/cm2 (dark blue pixels) to ≥ 0.142 µg/cm2 (red pixels); corresponding span of Pt per-pixel signal intensities in cisplatin-WR1065 panel (bottom) is 0.001 (dark blue pixels) to ≥ 0.122 µg/cm2 (for the few red pixels in this image). For mean per pixel elemental concentrations see Table 1
Fig. 7
Fig. 7
Detailed XFM scans of NT2-N cells treated with cisplatin with and without addition of WR1065. a—cisplatin only; b—cisplatin and WR1065 co-treatment. Note the heterogeneity between cells and that cells with low K signal intensities the have highest Pt pixel intensities; the same cells have high Ca, Fe, Cu and Zn signals (most evident in cisplatin only—a). Scale bars are 20 microns, the color bar indicates that elemental concentrations for each element range from black pixels (no signal) to red pixels (highest signal for a given element). Concentration ranges are indicated above each element’s map, e.g., Pt concentration in a (cisplatin treatment) ranges from 0.000 µg/cm2 (black pixels) to ≥ 0.218 µg/cm2 (red pixels); in cisplatin-WR1065 treatment example (b), Pt signal goes from 0.016 µg/cm2 (dark blue pixels) to ≥ 0.063 µg/cm2 (red pixels). For mean elemental concentrations see Table 1. For a high detail scan of few cisplatin treated cells see Supplemental Fig. 3
Fig. 8
Fig. 8
X-ray spectroscopy of Pt LIII edge in samples prepared by mixing cisplatin alone or with WR1065 with complex biological molecules DNA and BSA or by treating whole NT2-N cells with cisplatin with or without WR1065. a Comparison of Pt edge in cisplatin alone with Pt edge in a mixture of cisplatin and WR1065. Energy shift ΔE = 0.35 ± 0.04 eV suggests a change in the chemical environment of Pt when cisplatin is mixed with WR1065. b Comparison of Pt edge in cisplatin and WR1065 treated cells vs. mixtures of cisplatin and WR1065 and salmon sperm DNA (ΔE = 0.70 eV) or BSA (ΔE = 0.40 eV). c Comparison of the Pt edge in cisplatin treated cells vs. mixtures of cisplatin and salmon sperm DNA (ΔE = 0.60 eV) or BSA (ΔE = 0.45 eV)

References

    1. Albers JW, Chaudhry V, Cavaletti G, Donehower RC (2014) Interventions for preventing neuropathy caused by cisplatin and related compounds. Cochrane Database Syst Rev. 10.1002/14651858.CD005228.pub4 - PubMed
    1. Anderson D, Phillips BJ (1999) Comparative in vitro and in vivo effects of antioxidants. Food Chem Toxicol 37:1015–1025 - PubMed
    1. Andrews PW (1984) Retinoic acid induces neuronal differentiation of a cloned human embryonal carcinoma cell line in vitro. Dev Biol 103:285–293 - PubMed
    1. Areti A, Yerra VG, Naidu V, Kumar A (2014) Oxidative stress and nerve damage: role in chemotherapy induced peripheral neuropathy. Redox Biol 2:289–295. 10.1016/j.redox.2014.01.006 - PMC - PubMed
    1. Avan A, Postma TJ, Ceresa C, Avan A, Cavaletti G, Giovannetti E, Peters GJ (2015) Platinum-induced neurotoxicity and preventive strategies: past, present, and future. Oncologist 20:411–432. 10.1634/theoncologist.2014-0044 - PMC - PubMed

MeSH terms