. 2019 Jun;111(6):1558-1570.
doi: 10.1111/mmi.14237. Epub 2019 Apr 6.

Systematic analysis of Type I-E Escherichia coli CRISPR-Cas PAM sequences ability to promote interference and primed adaptation

Affiliations

Systematic analysis of Type I-E Escherichia coli CRISPR-Cas PAM sequences ability to promote interference and primed adaptation

Olga Musharova et al. Mol Microbiol. 2019 Jun.

Abstract

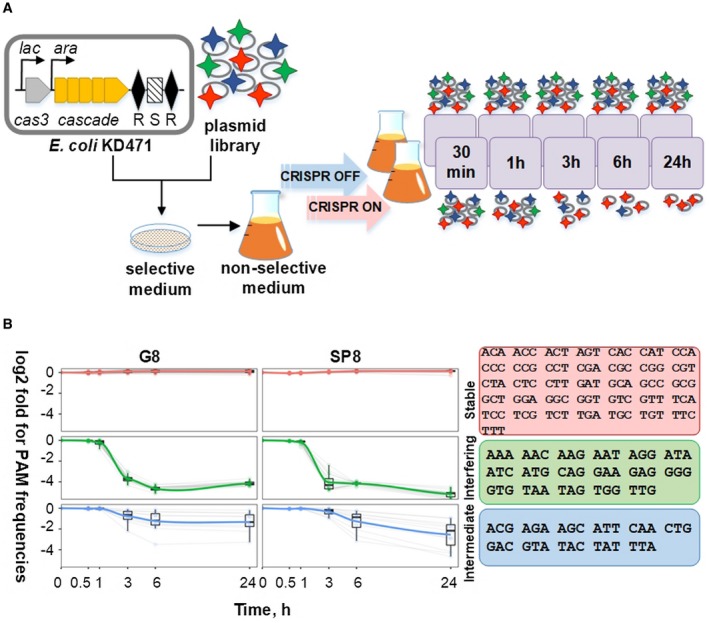
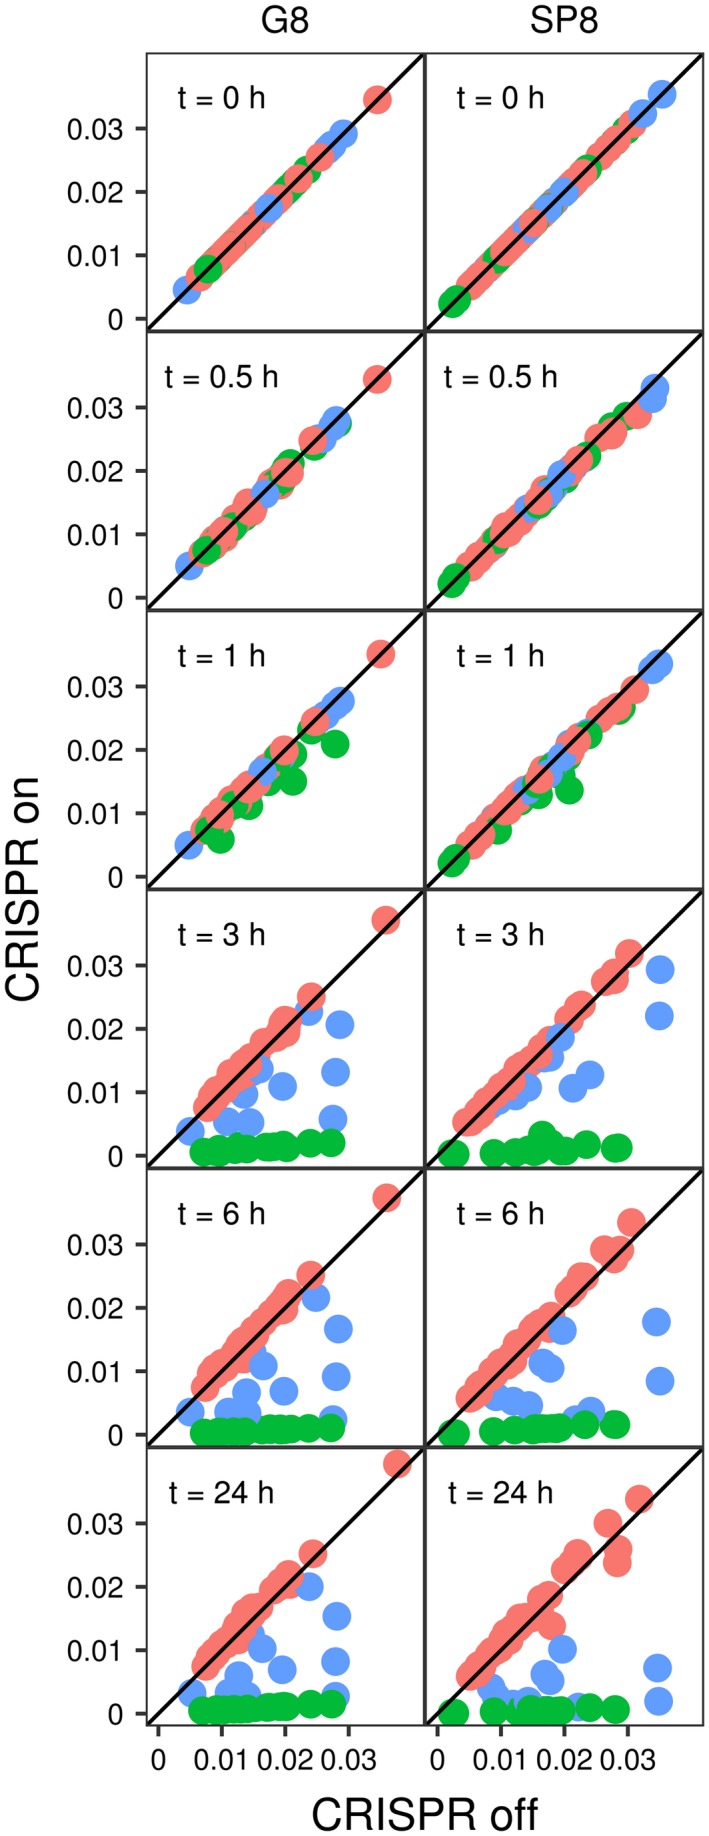
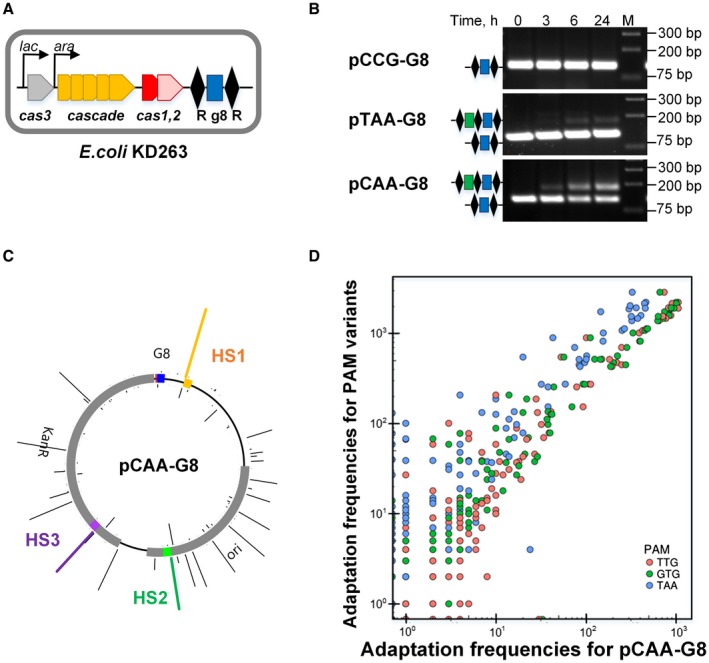
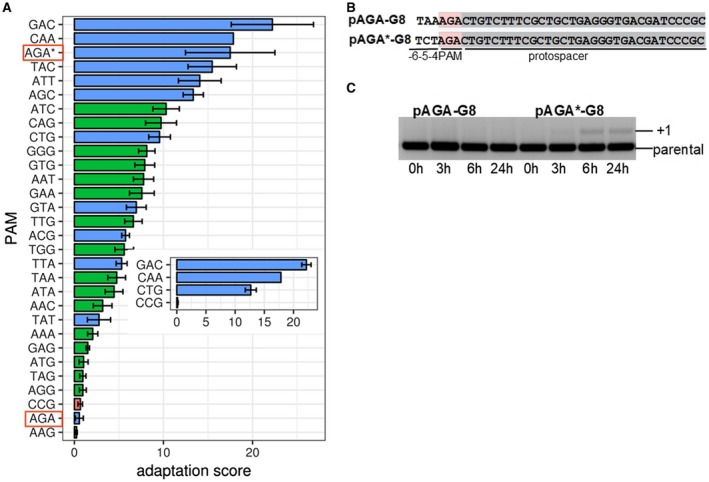
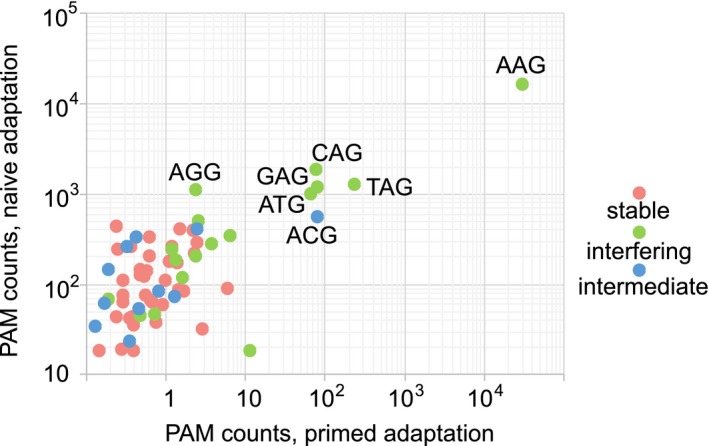
CRISPR interference occurs when a protospacer recognized by the CRISPR RNA is destroyed by Cas effectors. In Type I CRISPR-Cas systems, protospacer recognition can lead to «primed adaptation» - acquisition of new spacers from in cis located sequences. Type I CRISPR-Cas systems require the presence of a trinucleotide protospacer adjacent motif (PAM) for efficient interference. Here, we investigated the ability of each of 64 possible trinucleotides located at the PAM position to induce CRISPR interference and primed adaptation by the Escherichia coli Type I-E CRISPR-Cas system. We observed clear separation of PAM variants into three groups: those unable to cause interference, those that support rapid interference and those that lead to reduced interference that occurs over extended periods of time. PAM variants unable to support interference also did not support primed adaptation; those that supported rapid interference led to no or low levels of adaptation, while those that caused attenuated levels of interference consistently led to highest levels of adaptation. The results suggest that primed adaptation is fueled by the products of CRISPR interference. Extended over time interference with targets containing «attenuated» PAM variants provides a continuous source of new spacers leading to high overall level of spacer acquisition.


Conflict of interest statement

The authors declares that there is no conflict of interest regarding the publication of this article.

Figures

Figure 1
Figure 1
High‐throughput analysis of PAM sequences effect on CRISPR interference. A. On the top, an engineered E. coli cells with inducible expression of cas genes coding for Type I‐E interference machinery and lacking the cas1 and cas2 genes coding for the adaptation enzymes are schematically shown. The cells contain a CRISPR array with a single spacer (S) located between two repeats (R). The workflow of the PAM library experiment is presented. Cells are transformed with a library of plasmids containing a protospacer matching CRISPR array spacer and randomized trinucleotide at the PAM position (shown by colored stars). Transformants grown on selective medium are pooled and placed in nonselective medium without antibiotic required for plasmid maintenance. The cultures are divided and allowed to grow in the presence (CRISPR ON) on in the absence (CRISPR OFF) of cas gene expression inducers. At various time points, culture aliquots are removed, plasmid purified and the frequency of remaining PAM variants determined. B. Frequency change of PAM variants in SP8 and G8 protospacer plasmid libraries in induced cells over time. Based on their behavior, PAM variants are divided into stable, interfering and intermediate group. The error bars indicate the extent of variation observed for individual members within each group. Box plots show the range of frequencies for 75% of group members. Individual PAMs belonging to each group are listed at the right hand side of the figure. [Colour figure can be viewed at https://wileyonlinelibrary.com]
Figure 2
Figure 2
Dynamics of frequency change of SP8 and G8 protospacer plasmids with different PAM variants. Each dot represents the frequency of individual PAM variant plasmid frequency under CRISPR ON (vertical axis) and CRISPR OFF (horizontal axis) conditions at various times. Red dots indicate PAM variants belonging to the stable group, green – Interfering, and blue – intermediate group PAMs. For each panel, the frequency of dots located on black diagonal is the same in CRISPR ON and CRISPR OFF conditions. The dynamics of PAM variant behavior is also shown in an animation on Supporting Fig. S2B. Note that every dot remains in its group (does not change color) with time. [Colour figure can be viewed at https://wileyonlinelibrary.com]
Figure 3
Figure 3
In vivo analysis of adaptation from plasmids containing priming protospacers with selected PAM variants. A. E. coli KD263 cell containing inducible cas genes required for both interference and adaptation and a CRISPR array with a single G8 spacer located between two repeats (R) is shown. B. The results of PCR analysis of induced KD263 cultures harboring G8 protospacer plasmids with CCG, TAA and CAA PAM variants is presented. At indicated times post‐induction CRISPR arrays were amplified and resolved by agarose gel electrophoresis. Bands corresponding to initial and expanded CRISPR arrays are shown. C. Mapping of spacers acquired from the pCAA‐G8 PAM variant plasmid to the pT7blue‐Km backbone (see Supporting Fig. S3A for other PAM variant plasmids). The height of the bars corresponds to the number of HTS reads found for a particular position. The location of the priming G8 protospacer and its PAM is shown (blue and red, correspondingly). Hotspots HS1, HS2 and HS3 which were used for qPCR analysis are marked orange, green and purple respectively. D. Position‐dependent acquisition frequency of spacers in CRISPR arrays of cells carrying plasmids with TTG, GTG and TAA PAM variants by the G8 protospacer is plotted over the acquisition frequency observed in cells harboring a plasmid with the CAA PAM. [Colour figure can be viewed at https://wileyonlinelibrary.com]
Figure 4
Figure 4
Quantitative measurements of adaptation efficiency from priming protospacer with interfering and intermediate PAMs. A. The adaptation score (see Experimental procedures) or priming from G8 protospacer associated with different PAM variants. Mean values obtained from three independent measurements are shown along with standard deviations. Bars colored blue indicate intermediate group PAMs; green bars shown interfering PAMs. Red bar shows the result obtained with CCG PAM belonging to the stable group. The adaptation score of this variant is the same as that obtained with mock control (water instead of cell culture). Adaptation scores obtained with AGA PAM in the initial and changed context (panel B) are highlighted with red boxes. The adaptation score in changed context is additionally indicated by an asterisk. In the inset, the adaptation scores obtained with cells carrying several SP8 protospacer plasmids with indicated PAM variants are shown. B. Above, the sequence of G8 protospacer associated with the AGA PAM variant and upstream sequence in the plasmid from initial library is shown. Below, the sequence in a modified plasmid removing the off‐set AAG trinucleotide present in the initial sequence is presented. C. Dynamics of CRISPR arrays expansion in cells transformed with AGA PAM variant plasmids shown in B is presented. An agarose gel is shown. [Colour figure can be viewed at https://wileyonlinelibrary.com]
Figure 5
Figure 5
Comparative representation of trinucleotide usage in CRISPR interference, naïve and primed adaptation. The frequencies of trinucleotides corresponding to spacers acquired during naïve adaptation were plotted against their frequencies during primed adaptation in log10 scale. Colors of dots correspond to the three CRISPR interference groups – stable, intermediate or interfering – to which a trinucleotide belongs when attached to a priming protospacer. [Colour figure can be viewed at https://wileyonlinelibrary.com]

Similar articles

Cited by

References

    1. Barrangou, R. , Fremaux, C. , Deveau, H. , Richards, M. , Boyaval, P. , Moineau, S. , et al. (2007) CRISPR provides acquired resistance against viruses in prokaryotes. Science, 315(5819), 1709–1712. 10.1126/science.1138140 - DOI - PubMed
    1. Blosser, T.R. , Loeff, L. , Westra, E.R. , Vlot, M. , Künne, T. , Sobota, M. , et al. (2015) Two distinct DNA binding modes guide dual roles of a CRISPR‐Cas protein complex. Molecular Cell, 58(1), 60–70. 10.1016/j.molcel.2015.01.028 - DOI - PMC - PubMed
    1. Bozic, B. , Repac, J. and Djordjevic, M. (2019) Endogenous gene regulation as a predicted main function of type I‐E CRISPR/Cas system in E. coli . Molecules, 24(4), 784 10.3390/molecules24040784 - DOI - PMC - PubMed
    1. Brouns, S.J.J. , Jore, M.M. , Lundgren, M. , Westra, E.R. , Slijkhuis, R.J.H. , Snijders, A.P.L. , et al. (2008) Small CRISPR RNAs guide antiviral defense in prokaryotes. Science, 321(5891), 960–964. 10.1126/science.1159689 - DOI - PMC - PubMed
    1. Datsenko, K.A. and Wanner, B.L. (2000) One‐step inactivation of chromosomal genes in Escherichia coli K‐12 using PCR products. Proceedings of the National Academy of Sciences of the United States of America, 97(12), 6640–6645. 10.1073/pnas.120163297 - DOI - PMC - PubMed

Publication types

Substances