

Taking a deeper look: Quantifying the differences in fish assemblages between shallow and mesophotic temperate rocky reefs
- PMID: 30875385
- PMCID: PMC6420037
- DOI: 10.1371/journal.pone.0206778
Taking a deeper look: Quantifying the differences in fish assemblages between shallow and mesophotic temperate rocky reefs
Abstract
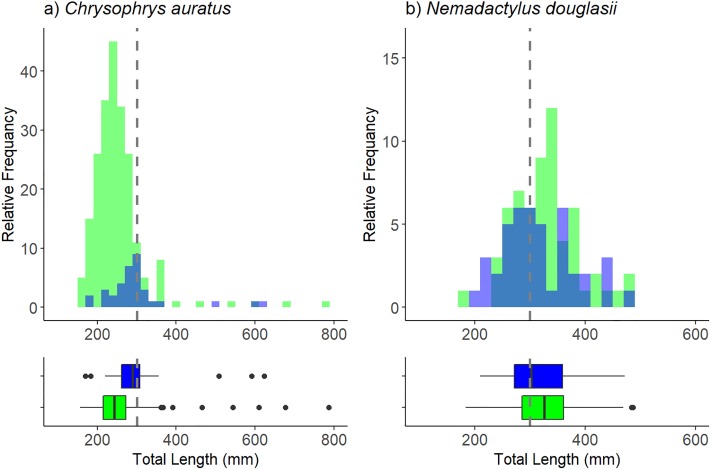
The spatial distribution of a species assemblage is often determined by habitat and climate. In the marine environment, depth can become an important factor as declining light and water temperature leads to changes in the biological habitat structure. To date, much of the focus of ecological fish research has been based on reefs in less than 40 m with little research on the ecological role of mesophotic reefs. We deployed baited remote underwater stereo video systems (stereo-BRUVS) on temperate reefs in two depth categories: shallow (20-40 m) and mesophotic (80-120 m), off Port Stephens, Australia. Sites were selected using data collected by swath acoustic sounder to ensure stereo-BRUVS were deployed on reef. The sounder also provided rugosity, slope and relief data for each stereo-BRUVS deployment. Multivariate analysis indicates that there are significant differences in the fish assemblages between shallow and mesophotic reefs, primarily driven by Ophthalmolepis lineolatus and Notolabrus gymnogenis only occurring on shallow reefs and schooling species of fish that were unique to each depth category: Atypichthys strigatus on shallow reefs and Centroberyx affinis on mesophotic reefs. While shallow reefs had a greater species richness and abundance of fish when compared to mesophotic reefs, mesophotic reefs hosted the same species richness of fishery-targeted species. Chrysophrys auratus and Nemodactylus douglassii are two highly targeted species in this region. While C. auratus was numerically more abundant on shallow reefs, mesophotic reefs provide habitat for larger fish. In comparison, N. douglassii were evenly distributed across all sites sampled. Generalized linear models revealed that depth and habitat type provided the most parsimonious model for predicting the distribution of C. auratus, while habitat type alone best predicted the distribution of N. douglassii. These results demonstrate the importance of mesophotic reefs to fishery-targeted species and therefore have implications for informing the management of these fishery resources on shelf rocky reefs.
Conflict of interest statement
The authors have declared that no competing interests exist.
Figures


Similar articles
-
Depth and benthic habitat influence shallow and mesophotic predatory fishes on a remote, high-latitude coral reef.PLoS One. 2022 Mar 24;17(3):e0265067. doi: 10.1371/journal.pone.0265067. eCollection 2022. PLoS One. 2022. PMID: 35324946 Free PMC article.
-
Conventional and technical diving surveys reveal elevated biomass and differing fish community composition from shallow and upper mesophotic zones of a remote United States coral reef.PLoS One. 2017 Nov 21;12(11):e0188598. doi: 10.1371/journal.pone.0188598. eCollection 2017. PLoS One. 2017. PMID: 29161314 Free PMC article.
-
Vertical structure of reef fish assemblages and light penetration reveal new boundaries of mesophotic ecosystems in the subtropical Southwestern Atlantic.Mar Environ Res. 2024 Jun;198:106527. doi: 10.1016/j.marenvres.2024.106527. Epub 2024 Apr 27. Mar Environ Res. 2024. PMID: 38688110
-
The ecology, behaviour and physiology of fishes on coral reef flats, and the potential impacts of climate change.J Fish Biol. 2013 Sep;83(3):417-47. doi: 10.1111/jfb.12203. J Fish Biol. 2013. PMID: 23991866 Review.
-
Function and stability of mesophotic coral reefs.Trends Ecol Evol. 2024 Jun;39(6):585-598. doi: 10.1016/j.tree.2024.01.011. Epub 2024 Feb 26. Trends Ecol Evol. 2024. PMID: 38413283 Review.
Cited by
-
ROV assessment of mesophotic fish and associated habitats across the continental shelf of the Amathole region.Sci Rep. 2021 Sep 13;11(1):18171. doi: 10.1038/s41598-021-97369-2. Sci Rep. 2021. PMID: 34518584 Free PMC article.
-
Upper mesophotic reef fish assemblages at Bahía de Banderas, Mexico.Biodivers Data J. 2024 Mar 11;12:e113125. doi: 10.3897/BDJ.12.e113125. eCollection 2024. Biodivers Data J. 2024. PMID: 38505125 Free PMC article.
-
eDNA metabarcoding shows highly diverse but distinct shallow, mid-water, and deep-water eukaryotic communities within a marine biodiversity hotspot.PeerJ. 2025 Apr 22;13:e19249. doi: 10.7717/peerj.19249. eCollection 2025. PeerJ. 2025. PMID: 40292110 Free PMC article.
-
Habitat selection and influence on hunting success in female Australian fur seals.Sci Rep. 2024 Nov 6;14(1):26982. doi: 10.1038/s41598-024-78643-5. Sci Rep. 2024. PMID: 39506103 Free PMC article.
-
Depth and benthic habitat influence shallow and mesophotic predatory fishes on a remote, high-latitude coral reef.PLoS One. 2022 Mar 24;17(3):e0265067. doi: 10.1371/journal.pone.0265067. eCollection 2022. PLoS One. 2022. PMID: 35324946 Free PMC article.
References
-
- Brown JH, Stevens GC, Kaufman DM. The geographic range: size, shape, boundaries, and internal structure. Annu Rev Ecol Syst. Annual Reviews. 1996;27: 597–623.
-
- Brokovich E, Einbinder S, Shashar N, Kiflawi M, Kark S. Descending to the twilight-zone: changes in coral reef fish assemblages along a depth gradient down to 65 m. Mar Ecol Prog Ser. 2008;371: 253–262.
-
- Malcolm HA, Jordan A, Smith SDA. Biogeographical and cross-shelf patterns of reef fish assemblages in a transition zone. Mar Biodivers. 2010;40: 181–193.
Publication types
MeSH terms
LinkOut - more resources
Full Text Sources
