Comparative Study
. 2019 Mar 16;393(10176):1101-1118.
doi: 10.1016/S0140-6736(18)32427-9. Epub 2019 Mar 12.

Progress in adolescent health and wellbeing: tracking 12 headline indicators for 195 countries and territories, 1990-2016

Affiliations
Comparative Study

Progress in adolescent health and wellbeing: tracking 12 headline indicators for 195 countries and territories, 1990-2016

Peter S Azzopardi et al. Lancet. .

Erratum in

  • Department of Error.
    [No authors listed] [No authors listed] Lancet. 2019 Mar 23;393(10177):1204. doi: 10.1016/S0140-6736(19)30578-1. Lancet. 2019. PMID: 30910303 Free PMC article. No abstract available.

Abstract

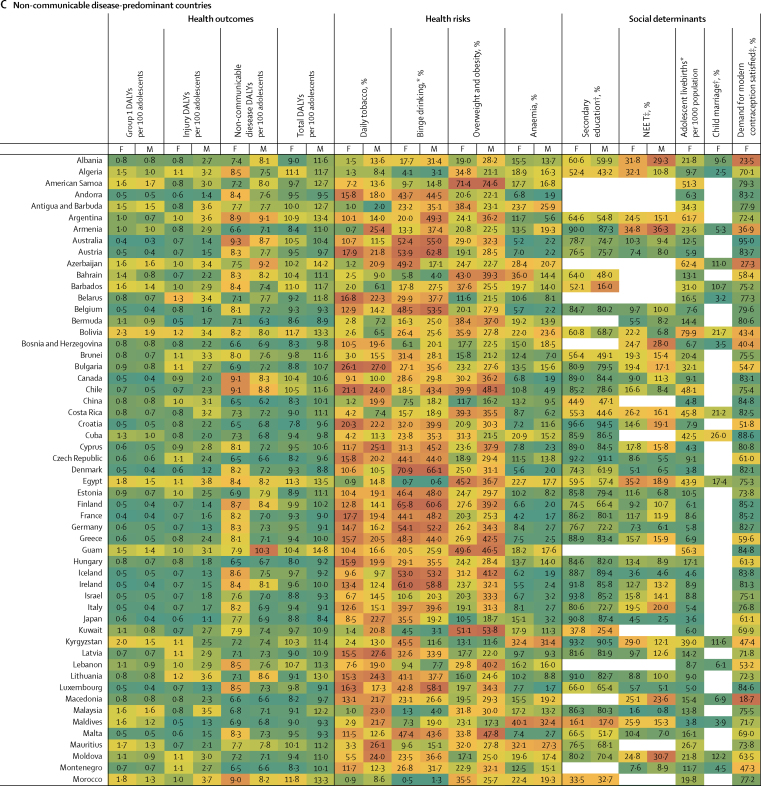
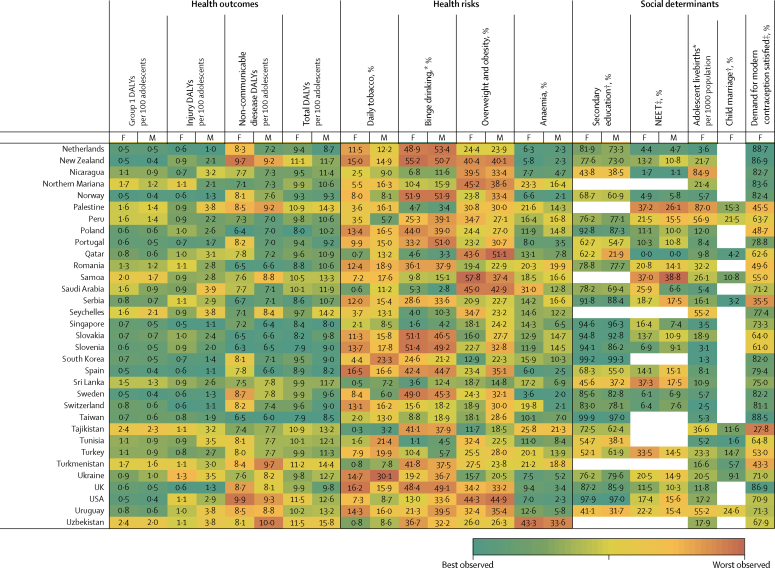
Background: Rapid demographic, epidemiological, and nutritional transitons have brought a pressing need to track progress in adolescent health. Here, we present country-level estimates of 12 headline indicators from the Lancet Commission on adolescent health and wellbeing, from 1990 to 2016.

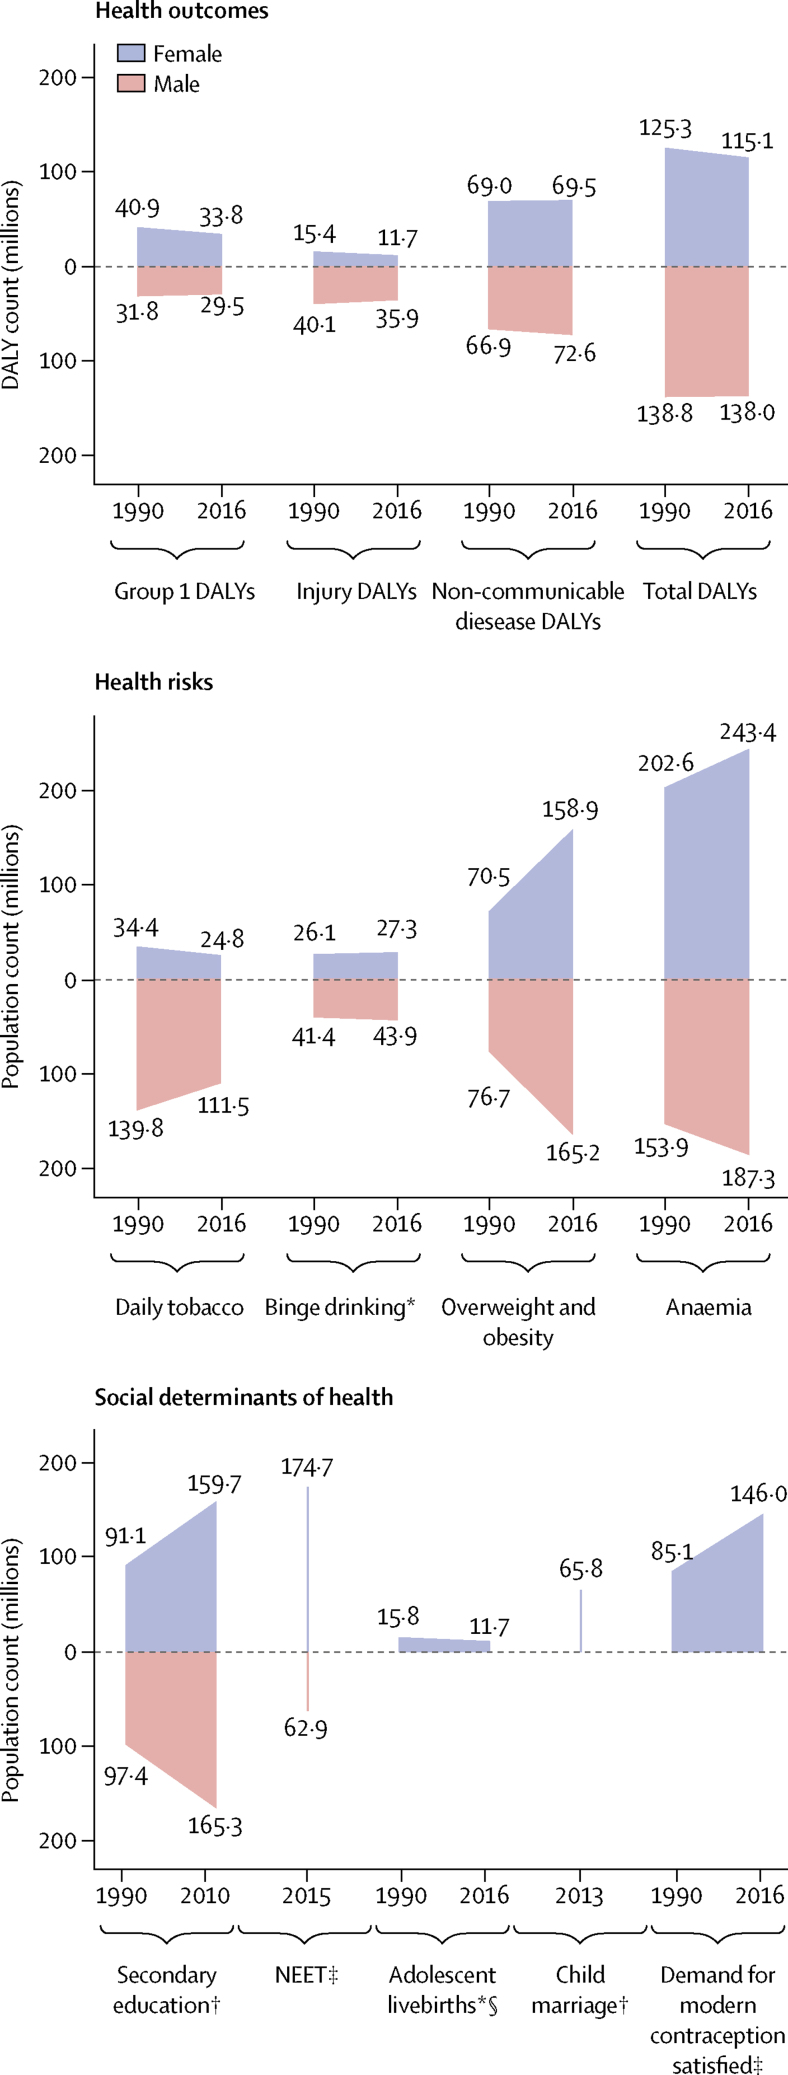
Methods: Indicators included those of health outcomes (disability-adjusted life-years [DALYs] due to communicable, maternal, and nutritional diseases; injuries; and non-communicable diseases); health risks (tobacco smoking, binge drinking, overweight, and anaemia); and social determinants of health (adolescent fertility; completion of secondary education; not in education, employment, or training [NEET]; child marriage; and demand for contraception satisfied with modern methods). We drew data from the Global Burden of Diseases, Injuries, and Risk Factors Study (GBD) 2016, International Labour Organisation, household surveys, and the Barro-Lee education dataset.

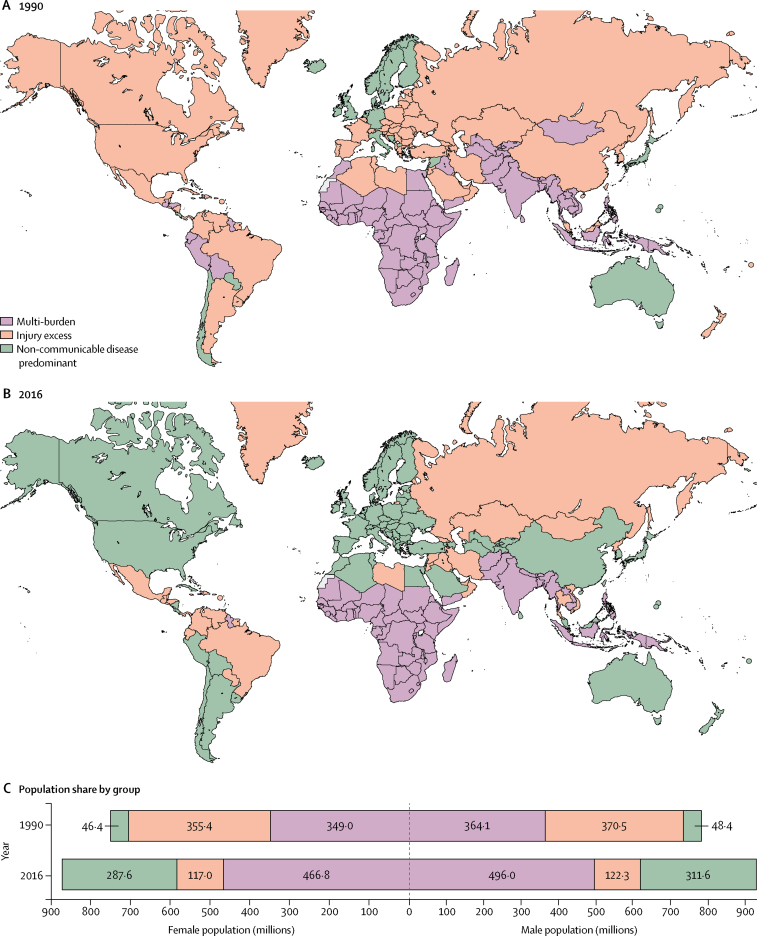
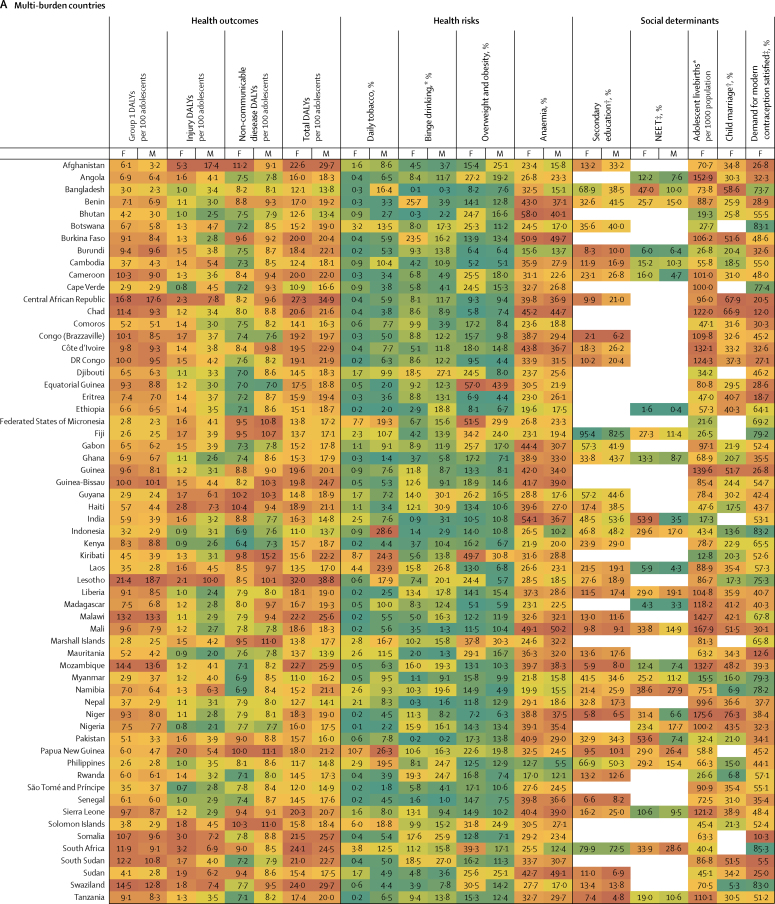
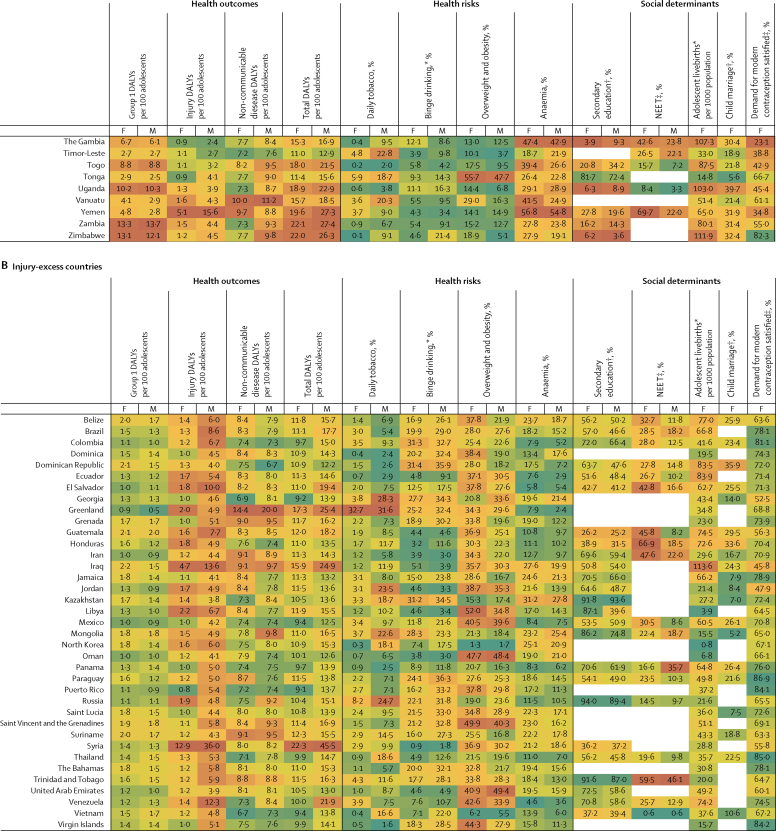
Findings: From 1990 to 2016, remarkable shifts in adolescent health occurred. A decrease in disease burden in many countries has been offset by population growth in countries with the poorest adolescent health profiles. Compared with 1990, an additional 250 million adolescents were living in multi-burden countries in 2016, where they face a heavy and complex burden of disease. The rapidity of nutritional transition is evident from the 324·1 million (18%) of 1·8 billion adolescents globally who were overweight or obese in 2016, an increase of 176·9 million compared with 1990, and the 430·7 million (24%) who had anaemia in 2016, an increase of 74·2 million compared with 1990. Child marriage remains common, with an estimated 66 million women aged 20-24 years married before age 18 years. Although gender-parity in secondary school completion exists globally, prevalence of NEET remains high for young women in multi-burden countries, suggesting few opportunities to enter the workforce in these settings.

Interpretation: Although disease burden has fallen in many settings, demographic shifts have heightened global inequalities. Global disease burden has changed little since 1990 and the prevalence of many adolescent health risks have increased. Health, education, and legal systems have not kept pace with shifting adolescent needs and demographic changes. Gender inequity remains a powerful driver of poor adolescent health in many countries.

Funding: Australian National Health and Medical Research Council, and the Bill & Melinda Gates Foundation.


Figures

Figure 1
Figure 1
Adolescent health country groupings in 1990 (A) and 2016 (B) with population distribution of adolescents in the three groups at both timepoints, by sex (C)
Figure 2
Figure 2
Global counts for 12 indicators of adolescent health in 1990 and 2016, by sex Data are DALY counts in millions, or population in millions. Each indicator is shown at two timepoints, except for NEET and child marriage because insufficient data were available. Counts for NEET, child marriage, and secondary education are estimated using group-specific prevalences (on the basis of available data) and applied to total denominator counts. Data are for adolescents aged 10–24 years, unless otherwise stated. DALYs=disability-adjusted life-years. NEET=not in education, employment, or training. *For individuals aged 15–19 years. †For individual aged 20–24 years. ‡For individuals aged 15–24 years. §Counts for livebirths are incident births, and do not include girls aged 15–19 years who gave birth before 2016.
Figure 3
Figure 3
Multi-burden (A), injury-excess (B), and non-communicable disease-predominant (C) country-specific estimates of the 12 indicators for adolescent health and wellbeing, by sex Data are most recent country-level estimates for each indicator (2010 for education [except New Zealand, 2005], median of 2013 for child marriage, median of 2015 for NEET, and 2016 for all others), blank spaces indicate missing data. Health outcomes are DALYs per 100 adolescents, and health risks and social determinants are prevalences, unless otherwise stated. Data are for adolescents aged 10–24 years, unless otherwise stated. For each indicator and sex, countries are shaded on a scale from green (best value observed) to red (worst value observed); for most indicators green signifies the lowest value with the exception of secondary education and demand for contraception satisfied for which it signifies the highest value. DALYs=disability-adjusted life-years. F=females. M=males. NEET=not in education, employment, or training. *For individuals aged 15–19 years. †For individual aged 20–24 years. ‡For individuals aged 15–24 years.
Figure 3
Figure 3
Multi-burden (A), injury-excess (B), and non-communicable disease-predominant (C) country-specific estimates of the 12 indicators for adolescent health and wellbeing, by sex Data are most recent country-level estimates for each indicator (2010 for education [except New Zealand, 2005], median of 2013 for child marriage, median of 2015 for NEET, and 2016 for all others), blank spaces indicate missing data. Health outcomes are DALYs per 100 adolescents, and health risks and social determinants are prevalences, unless otherwise stated. Data are for adolescents aged 10–24 years, unless otherwise stated. For each indicator and sex, countries are shaded on a scale from green (best value observed) to red (worst value observed); for most indicators green signifies the lowest value with the exception of secondary education and demand for contraception satisfied for which it signifies the highest value. DALYs=disability-adjusted life-years. F=females. M=males. NEET=not in education, employment, or training. *For individuals aged 15–19 years. †For individual aged 20–24 years. ‡For individuals aged 15–24 years.
None

Comment in

References

    1. Patton GC, Sawyer SM, Santelli JS. Our future: a Lancet commission on adolescent health and wellbeing. Lancet. 2016;387:2423–2478. - PMC - PubMed
    1. Patton GC, Olsson CA, Skirbekk V. Adolescence and the next generation. Nature. 2018;554:458–466. - PubMed
    1. Sawyer S, Azzopardi P, Wickremarathne D, Patton G. The age of adolescence. Lancet Child Adolesc Health. 2018;2:223–228. - PubMed
    1. Temmerman M, Khosla R, Bhutta ZA, Bustreo F. Towards a new global strategy for women's, children's and adolescents' health. BMJ. 2015;351:h4414. - PubMed
    1. WHO . World Health Organization; Geneva: 2017. Global Accelerated Action for the Health of Adolescents (AA-HA!): guidance to support country implementation.http://apps.who.int/iris/bitstream/handle/10665/255415/9789241512343-eng...

Publication types

MeSH terms