. 2019 Apr 16;50(4):1099-1114.e10.
doi: 10.1016/j.immuni.2019.02.006. Epub 2019 Mar 12.

Anti-commensal IgG Drives Intestinal Inflammation and Type 17 Immunity in Ulcerative Colitis

Affiliations

Anti-commensal IgG Drives Intestinal Inflammation and Type 17 Immunity in Ulcerative Colitis

Tomas Castro-Dopico et al. Immunity. .

Abstract

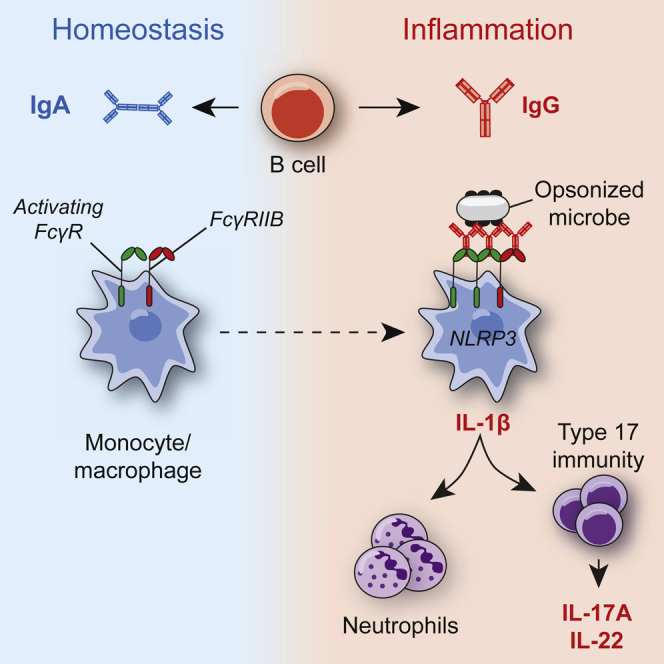
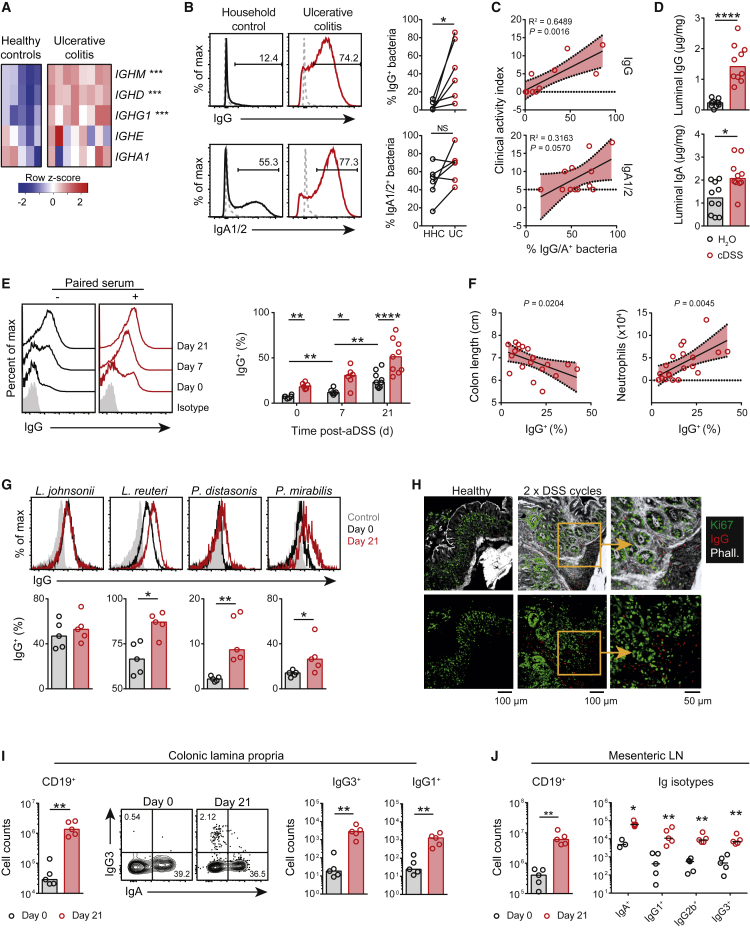
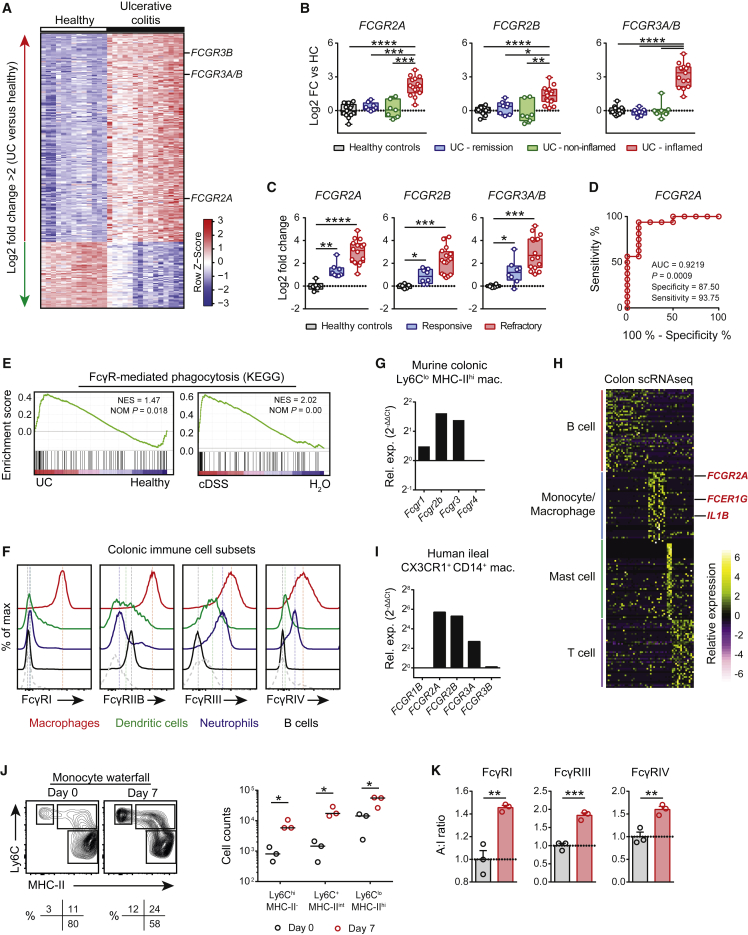
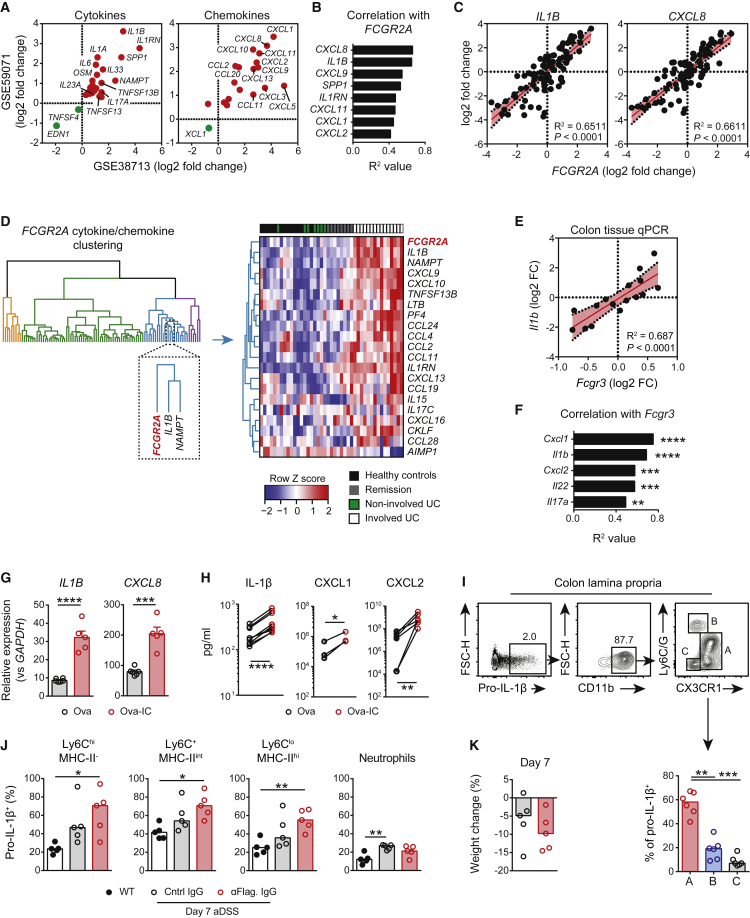
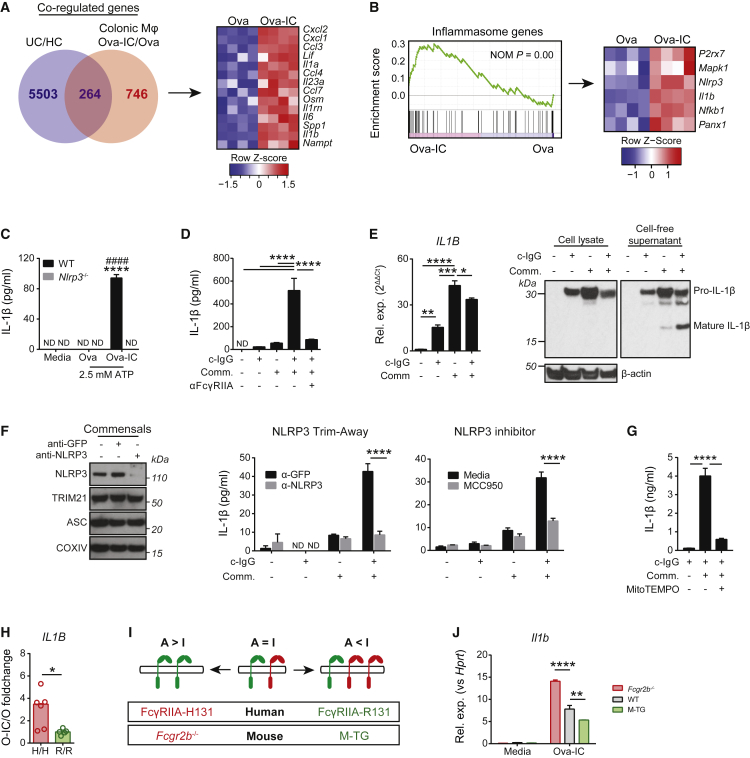
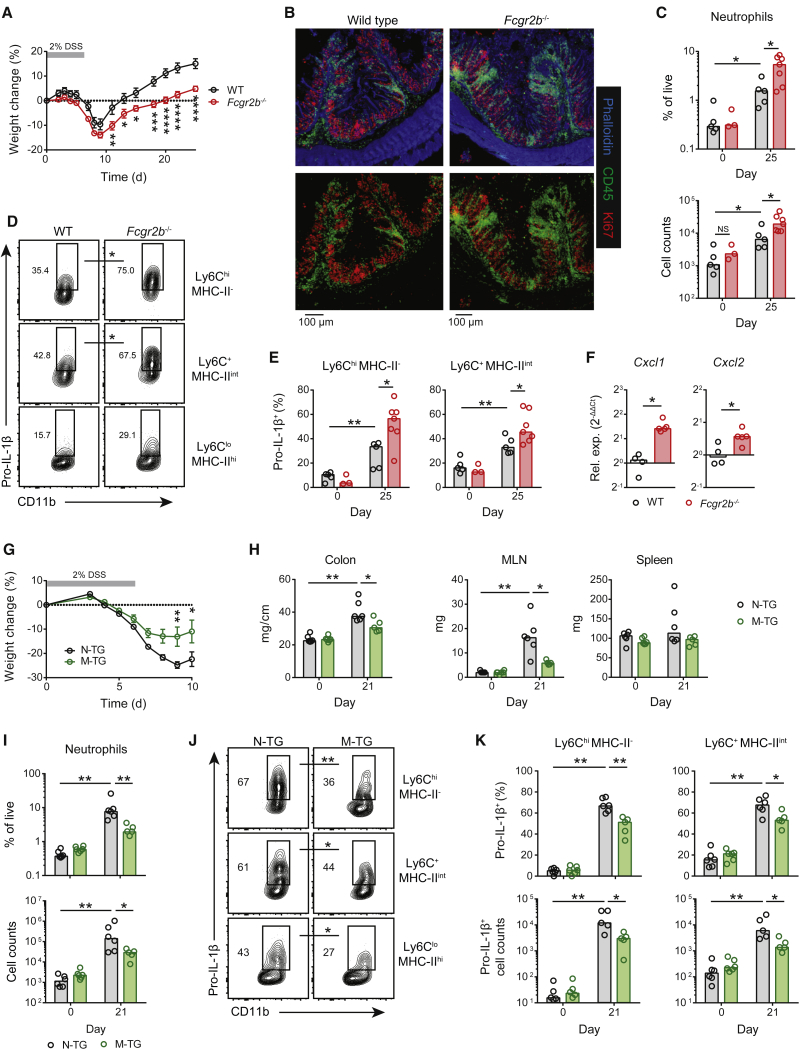
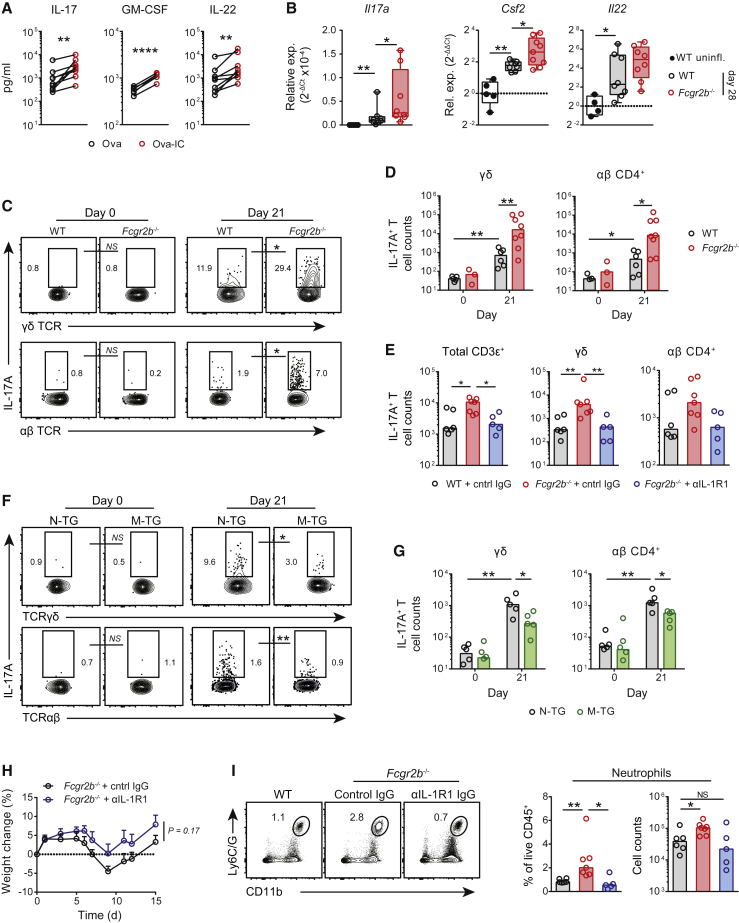
Inflammatory bowel disease is a chronic, relapsing condition with two subtypes, Crohn's disease (CD) and ulcerative colitis (UC). Genome-wide association studies (GWASs) in UC implicate a FCGR2A variant that alters the binding affinity of the antibody receptor it encodes, FcγRIIA, for immunoglobulin G (IgG). Here, we aimed to understand the mechanisms whereby changes in FcγRIIA affinity would affect inflammation in an IgA-dominated organ. We found a profound induction of anti-commensal IgG and a concomitant increase in activating FcγR signaling in the colonic mucosa of UC patients. Commensal-IgG immune complexes engaged gut-resident FcγR-expressing macrophages, inducing NLRP3- and reactive-oxygen-species-dependent production of interleukin-1β (IL-1β) and neutrophil-recruiting chemokines. These responses were modulated by the FCGR2A genotype. In vivo manipulation of macrophage FcγR signal strength in a mouse model of UC determined the magnitude of intestinal inflammation and IL-1β-dependent type 17 immunity. The identification of an important contribution of IgG-FcγR-dependent inflammation to UC has therapeutic implications.

Keywords: Fcγ receptors; IL-1β; IgG; inflammatory bowel disease; type 17 immunity.


Figures

None
Graphical abstract
Figure 1
Figure 1
Anti-commensal IgG Is Associated with the Magnitude of Intestinal Inflammation (A) Analysis of human Ig heavy-chain gene transcripts in healthy and UC colonic biopsies. Data were derived from Gene Expression Omnibus (GEO) dataset GEO: GSE9452. (B) IgG- and IgA1- and IgA2-bound SYBR greenhi microbes in UC and household healthy control (HHC) stool samples were analyzed as household pairs (n = 6 per group). (C) Correlation of pooled IgG- and IgA1- and IgA2-bound bacterial levels with clinical activity index (CAI) (n = 12). (D) Murine colon luminal IgG and IgA levels following two cycles of DSS administration (cDSS) and normalized to total protein content (n = 10 per group). Medians are indicated. (E) Quantification of IgG-bound bacteria in stool after a single acute course of 6-day 2% DSS administration (aDSS) or H2O with (red) and without (black) paired serum pre-incubation (n = 6–9 per group). Medians are indicated. (F) Correlation of IgG-bound commensals (no serum) from pooled control and colitic mice at day 21 after aDSS with markers of colonic inflammation; length and neutrophil count (n = 20) are shown. In (D)–(F), data are pooled from two independent experiments. (G) Opsonization of commensal bacterial species with day 21 aDSS serum or healthy control serum (day 0) (n = 5 per group). Medians are indicated. Data are representative of two independent experiments. (H) Confocal image of control or inflamed colons from cDSS-treated mice (red, IgG; green, Ki67; white, phalloidin). Data representative of three independent experiments. (I and J) Quantification of IgG- and IgA-expressing IgM B cell subsets in murine colons (I) and colon-draining MLN (J) at day 21 after aDSS administration versus controls (day 0) (n = 5 per group). For absolute cell-count quantification plots, medians are indicated. Data are representative of three independent experiments. p values were calculated via limma with multiple correction using the Benjamini-Hochberg (BH) procedure (A), ratio paired t test (B), linear regression analysis (C and F), or the nonparametric Mann-Whitney U test (D, E, G, I, and J). p < 0.05, ∗∗p < 0.01, ∗∗∗p < 0.001, ∗∗∗∗p < 0.0001. See also Figure S1 and Table S1.
Figure 2
Figure 2
Activating FcγR Signaling in Intestinal Inflammation (A) Analysis of the top significantly differentially expressed genes (log2 FC > 2) in human active UC mucosal biopsies compared with controls. Data are from GEO: GSE38713. (B) FCGR enrichment in inflamed active UC (n = 15) compared with healthy control (n = 13), remission (n = 8), and non-inflamed mucosal biopsies (n = 7). Data are from GEO: GSE38713. (C) FCGR expression in colonic biopsies from UC patients refractory (n = 16) or responsive (n = 8) to infliximab treatment and healthy controls prior to treatment initiation (n = 6). Data are from GEO: GSE16879. Minimum to maximum box-and-whisker plots are shown in (B) and (C). (D) Area under the receiver operator curve (AUROC) analysis for FCGR2A expression in infliximab-refractory mucosal biopsies compared with infliximab-responsive biopsies. Data were derived as in (C). (E) Gene-set enrichment analysis (GSEA) of the KEGG FcγR-mediated phagocytosis pathway in UC and healthy colonic biopsies (left) and cDSS-inflamed and healthy murine colons (bottom). Data are from GEO: GSE38713 (UC = 15, HC = 13) and GEO: GSE42768 (cDSS = 5, H2O = 5). (F) FcγR expression by murine colonic leukocytes at day 7 after aDSS. Data are representative of 3 independent experiments. (G) qPCR of FcγR mRNA expression in flow-sorted murine colonic CX3CR1+Ly6CloMHC-IIhi macrophages, as identified in (F). Data are representative of 2 independent experiments. (H) Single-cell RNA-seq of immune cell subsets in healthy human colon. Data are from GEO: GSE81861. The heatmap illustrates the top 50 cell-type-specific markers ranked by AUROC score. (I) qPCR of FcγR mRNA expression in flow-sorted human ileal CD14+CX3CR1+SSCint macrophages. (J) Colonic “monocyte waterfall” subset quantification by flow cytometry at day 7 after aDSS versus controls (n = 3 per group). Flow plots of CD11b+CX3CR1+ waterfall subsets (left) and quantification of absolute cell counts for the indicated subsets (right) are shown. For absolute cell counts, medians are indicated. Data are representative of 3 independent experiments. (K) FcγR quantification of CX3CR1+Ly6CloMHC-IIhi macrophages, as shown in (J), by flow cytometry. Means ± SEM are indicated and normalized to the A:I ratio of control-treated mice. Data are representative of two independent experiments. p values were calculated via limma with multiple correction using the BH procedure (A–C), AUROC analysis (D and H), or Student’s two-tailed t test (J and K). p < 0.05, ∗∗p < 0.01, ∗∗∗p < 0.001, ∗∗∗∗p < 0.0001. See also Figure S2 and Table S2.
Figure 3
Figure 3
Mucosal FcγR Expression Correlates with IL-1β and CXCL8 (A) Log2 fold-change comparison of differentially expressed cytokine and chemokine genes across two independent UC cohorts. Data are from GEO: GSE38713 (UC = 15, HC = 13) and GEO: GSE59071 (UC = 74, HC = 11). (B and C) Correlation summary of FCGR2A expression with UC-associated cytokine and chemokine gene transcripts (B) and correlation with IL1B and CXCL8 (C) in n = 85 mucosal biopsies. Data are from GEO: GSE59071. (D) Hierarchical clustering of cytokine and chemokine and FCGR2A expression in healthy controls and non-inflamed and inflamed UC patients. Data are derived from GEO: GSE38713. (E and F) Correlation of Fcgr3 expression with Il1b (E) and candidate-gene (F) expression in whole inflamed colonic tissue by qPCR (n = 16). Data are representative of two independent experiments. (G) IL1B and CXCL8 expression in healthy human LPMC stimulated with Ova or Ova-IC for 16 h (n = 5 per condition). Means ± SEM are indicated. Data are representative of two independent experiments. (H) IL-1β, CXCL1, and CXCL2 in supernatants of inflamed murine LPMCs stimulated with Ova or Ova-IC for 16 h (n = 3-9). Paired samples represent LPMCs from a single mouse. Data are pooled from two independent experiments. (I) Flow-cytometry profiling of pro-IL-1β-expressing cells at day 14 after aDSS (n = 6). Medians are indicated. Data are representative of three independent experiments. (J) Pro-IL-1β expression by colonic CX3CR1+ MNP subsets and neutrophils in Rag2−/− mice treated with control or anti-flagellin-enriched serum IgG and 7-day aDSS or uninflamed H2O-treated controls (n = 5 per group). Medians are indicated. (K) Day 7 weight loss for aDSS-treated mice shown in (J) (n = 5 per group). Medians are indicated. p values were calculated via limma with multiple correction using the BH procedure (A), linear regression analysis (B, C, E, and F), Student’s two-tailed t test (G), ratio paired t test (H and I), or the Kruskal-Wallis test with Dunn’s multiple-comparisons test (J). p < 0.05, ∗∗p < 0.01, ∗∗∗p < 0.001, ∗∗∗∗p < 0.0001. See also Figure S3.
Figure 4
Figure 4
IgG-Induced IL-1β Production by Human Macrophages (A) Venn diagram of significant co-expressed genes between UC and Ova-IC-stimulated colonic macrophages (left) and IC-induced UC-associated cytokines and chemokines (right), as determined by sdef. Human UC data are from GEO: GSE38713 (UC = 15, HC = 13). For macrophage stimulation, n = 4 per condition. (B) GSEA of inflammasome genes (left) and heatmap of selected core enrichment genes (right) in flow-sorted murine intestinal CX3CR1+Ly6CloMHC-IIhi macrophages stimulated with Ova and Ova-IC for 4 h (n = 4 per condition). (C) IL-1β production by WT and Nlrp3−/− BMDMs primed with Ova and Ova-IC for 4 h followed by 30 min of ATP stimulation (∗∗∗∗, WT versus Nlrp3−/− Ova-IC; ####, WT Ova versus Ova-IC) (n = 3 per condition). Means ± SEM are indicated. Data are representative of three independent experiments. ND, not detected. (D) IL-1β ELISA of human MDMs stimulated with plate-coated IgG (c-IgG) and intestinal commensals (Comm.) for 24 h ± anti-FcγRIIA IgG-blocking antibody (n = 3 per condition). Means ± SEM are indicated. Data are representative of two independent experiments. (E) qPCR of IL1B mRNA (left, n = 3 per condition) and western blot of IL-1β in cell lysates and cell-free supernatants (right) from human MDMs as stimulated in (D). For qPCR (left), means ± SEM are indicated. Data are representative of two independent experiments. (F) The effect of NLRP3 inhibition on IgG-induced MDM IL-1β production. Western blot (left) and IL-1β production (left, ELISA) by human MDMs stimulated as in (D) after NLRP3 “Trim-Away” or ± NLRP3 inhibitor MCC950 (right, ELISA) (n = 3 per condition). Means ± SEM are indicated. (G) IL-1β production by human MDMs stimulated as in (D) ± mitochondrial ROS inhibitor mitoTEMPO (n = 3 per condition). Means ± SEM are indicated. Data are representative of 2 independent experiments. (H) Fold change in IL1B expression in Ova-IC-stimulated MDMs, normalized to R/R fold change (n = 6 per group). Data are pooled from 3 independent experiments. Medians are indicated. (I) Schematic of FcγR A:I ratios with FCGR2A SNP (dbSNP: rs1801274) and murine transgenic models. (J) Il1b induction in WT, Fcgr2b−/−, and M-TG BMDMs stimulated with Ova and Ova-IC for 3 h (n = 3 per condition). Means ± SEM are indicated. Data are representative of 3 independent experiments. p values were calculated via the standard DESeq2 method with multiple correction using the BH procedure (A and B), two-way ANOVA with Tukey’s multiple comparisons test (C, F, and J), one-way ANOVA with Tukey’s multiple-comparisons test (D, E, and G), or parametric Student’s t test (H). p < 0.05, ∗∗p < 0.01, ∗∗∗p < 0.001, ∗∗∗∗p < 0.0001. See also Figure S4.
Figure 5
Figure 5
MNP FcγR A:I Ratio Modulates Intestinal Inflammation (A) Weight loss in co-housed sex-matched WT (black circles, n = 8) and Fcgr2b−/− (red circles, n = 9) mice after a single 6-day course of 2% DSS. Means ± SEM are indicated. Data are representative of 3 independent experiments. (B) Confocal microscopy of colonic CD45+ leukocytes in mice treated as in (A). Data are representative of 2 independent experiments. (C) Flow-cytometric quantification of colonic neutrophil frequency (top) and absolute neutrophil counts (bottom) in WT and Fcgr2b−/− colons at day 25 after aDSS (n = 5–7 per group) or in healthy controls (day 0) (n = 3–5 per group). Medians are indicated. Data are representative of 3 independent experiments. (D) Pro-IL-1β expression by colonic CD11b+CX3CR1+ MNPs at day 25 after aDSS (n = 5–7 per group). (E) Frequency of pro-IL-1β expression within the Ly6ChiMHC-II monocyte and Ly6C+MHC-IIint macrophage populations as shown in aDSS (n = 5–7 per group) versus controls (day 0) (n = 3–5 per group). Medians are indicated. Data are representative of 3 independent experiments. (F) Chemokine mRNA levels in flow-sorted Ly6CloMHC-IIhi colonic macrophages at day 21 after aDSS (n = 4–5 per group). Data normalized to WT mRNA levels. Medians are indicated. (G and H) Weight loss (G) and clinical colonic and lymphoid organ features (H) of co-housed sex-matched M-TG (green circles, n = 5 or 6) and N-TG littermate controls (black circles, n = 6) after aDSS or in healthy controls (day 0 in H). Means ± SEM (weight loss) and medians (colon, MLN, and spleen weight) are indicated. Data are representative of 3 independent experiments. (I) Flow-cytometric quantification of colonic neutrophil frequency (top) and absolute neutrophil count (bottom) in N-TG and M-TG mice at day 21 after aDSS (n = 6 per group) versus controls (day 0) (n = 5–6 per group). Medians are indicated. (J) Pro-IL-1β expression by colonic CX3CR1+ MNP subsets in N-TG and M-TG mice treated as in (I) (n = 5 or 6 per group). (K) Frequency (top) and absolute cell count (bottom) of pro-IL-1β-expressing MNP subsets in N-TG and M-TG mice treated as in (I). Medians are indicated. Data are representative of two independent experiments. p values calculated using a two-way ANOVA with Bonferroni’s multiple comparisons test (A and G), or the nonparametric Mann-Whitney U test (C-F, H-K). p < 0.05, ∗∗p < 0.01, ∗∗∗p < 0.001, ∗∗∗∗p < 0.0001. See also Figure S5.
Figure 6
Figure 6
MNP FcγR A:I Ratio Modulates Intestinal Type 17 Immunity (A) Type-17-associated cytokine production by day-14 LPMCs stimulated with Ova and Ova-IC for 16 h (n = 5–9). Paired samples represent cells isolated from the same mouse. Data are pooled from 2 independent experiments. (B) qPCR of type 17 cytokines in WT and Fcgr2b−/− whole colonic tissue after cDSS versus controls (n = 4–9 per group). Data are normalized to uninflamed healthy colon. Medians are indicated. Data are representative of 2 independent experiments. (C) Flow-cytometry plots of colonic IL-17A-expressing T cell subsets in co-housed sex-matched WT and Fcgr2b−/− mice at day 21 after aDSS (n = 6–8 per group) versus controls (day 0) (n = 3–5 per group). (D) Quantification of absolute numbers of colonic IL-17A-producing T cells shown in (C). Medians are indicated. Data are representative of 3 independent experiments. (E) Quantification of absolute numbers of colonic IL-17A-producing T cell subsets in co-housed WT and Fcgr2b−/− mice at day 15 after aDSS and weekly treatment with anti-IL-1R1 IgG-blocking antibody or control IgG (n = 5–7 per group). Medians are indicated. Data are representative of two independent experiments. (F) Colonic IL-17A-expressing T cell subsets in M-TG and N-TG littermate controls at day 21 after aDSS (n = 5 or 6 per group) versus controls (n = 5 or 6 per group). Data are representative of two independent experiments. (G) Quantification of absolute cell counts of colonic IL-17A-producing T cell subsets as shown in (F). Medians are indicated. (H) Weight loss of Fcgr2b−/− mice treated with control or anti-IL-1R1 IgG antibodies after aDSS treatment (n = 5–7 per group). Mean ± SEM are indicated. Data are representative of two independent experiments. (I) Colonic neutrophil infiltration in WT and Fcgr2b−/− mice treated as in (H) (n = 5–7 per group). Medians are indicated. p values were calculated with a ratio paired t test (A), the nonparametric Mann-Whitney U test (B–G and I), or a two-way ANOVA (H). p < 0.05, ∗∗p < 0.01, ∗∗∗p < 0.001, ∗∗∗∗p < 0.0001. See also Figure S6.

Comment in

Dataset use reported in

Similar articles

Cited by

References

    1. Abraham C., Cho J.H. Functional consequences of NOD2 (CARD15) mutations. Inflamm. Bowel Dis. 2006;12:641–650. - PubMed
    1. Aibar S., González-Blas C.B., Moerman T., Huynh-Thu V.A., Imrichova H., Hulselmans G., Rambow F., Marine J.C., Geurts P., Aerts J. SCENIC: single-cell regulatory network inference and clustering. Nat. Methods. 2017;14:1083–1086. - PMC - PubMed
    1. Arijs I., De Hertogh G., Lemaire K., Quintens R., Van Lommel L., Van Steen K., Leemans P., Cleynen I., Van Assche G., Vermeire S. Mucosal gene expression of antimicrobial peptides in inflammatory bowel disease before and after first infliximab treatment. PLoS ONE. 2009;4:e7984. - PMC - PubMed
    1. Arijs I., Li K., Toedter G., Quintens R., Van Lommel L., Van Steen K., Leemans P., De Hertogh G., Lemaire K., Ferrante M. Mucosal gene signatures to predict response to infliximab in patients with ulcerative colitis. Gut. 2009;58:1612–1619. - PubMed
    1. Asano K., Matsushita T., Umeno J., Hosono N., Takahashi A., Kawaguchi T., Matsumoto T., Matsui T., Kakuta Y., Kinouchi Y. A genome-wide association study identifies three new susceptibility loci for ulcerative colitis in the Japanese population. Nat. Genet. 2009;41:1325–1329. - PubMed

Publication types

MeSH terms