. 2019 May 10:301:62-75.
doi: 10.1016/j.jconrel.2019.03.010. Epub 2019 Mar 13.

Dual-drug loaded nanoparticles of Epigallocatechin-3-gallate (EGCG)/Ascorbic acid enhance therapeutic efficacy of EGCG in a APPswe/PS1dE9 Alzheimer's disease mice model

Affiliations

Dual-drug loaded nanoparticles of Epigallocatechin-3-gallate (EGCG)/Ascorbic acid enhance therapeutic efficacy of EGCG in a APPswe/PS1dE9 Alzheimer's disease mice model

Amanda Cano et al. J Control Release. .

Abstract

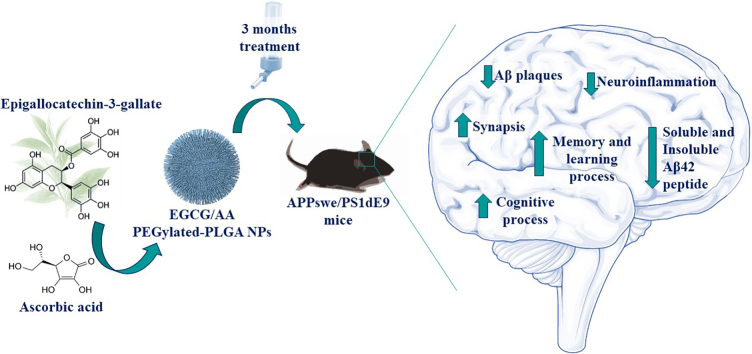
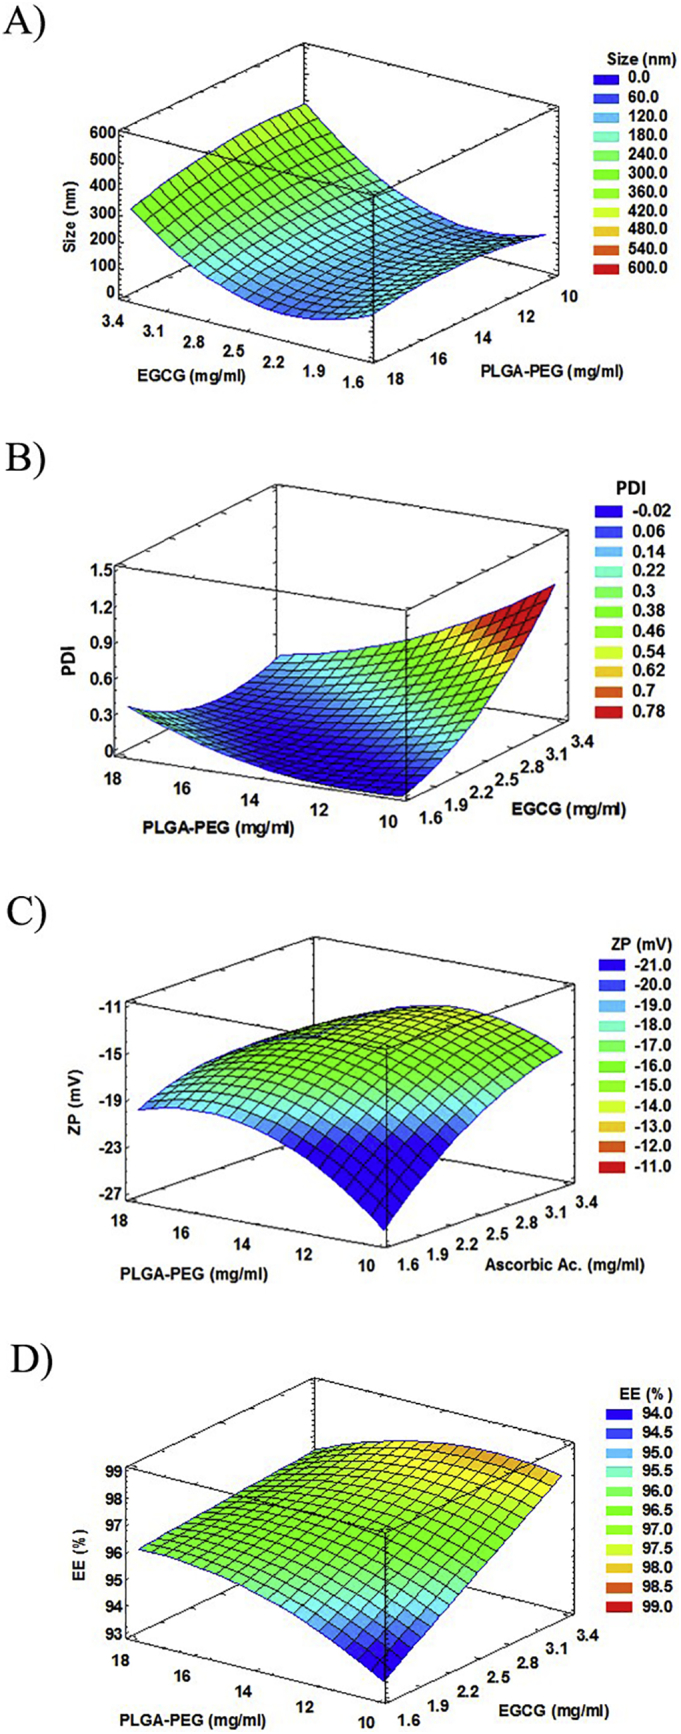
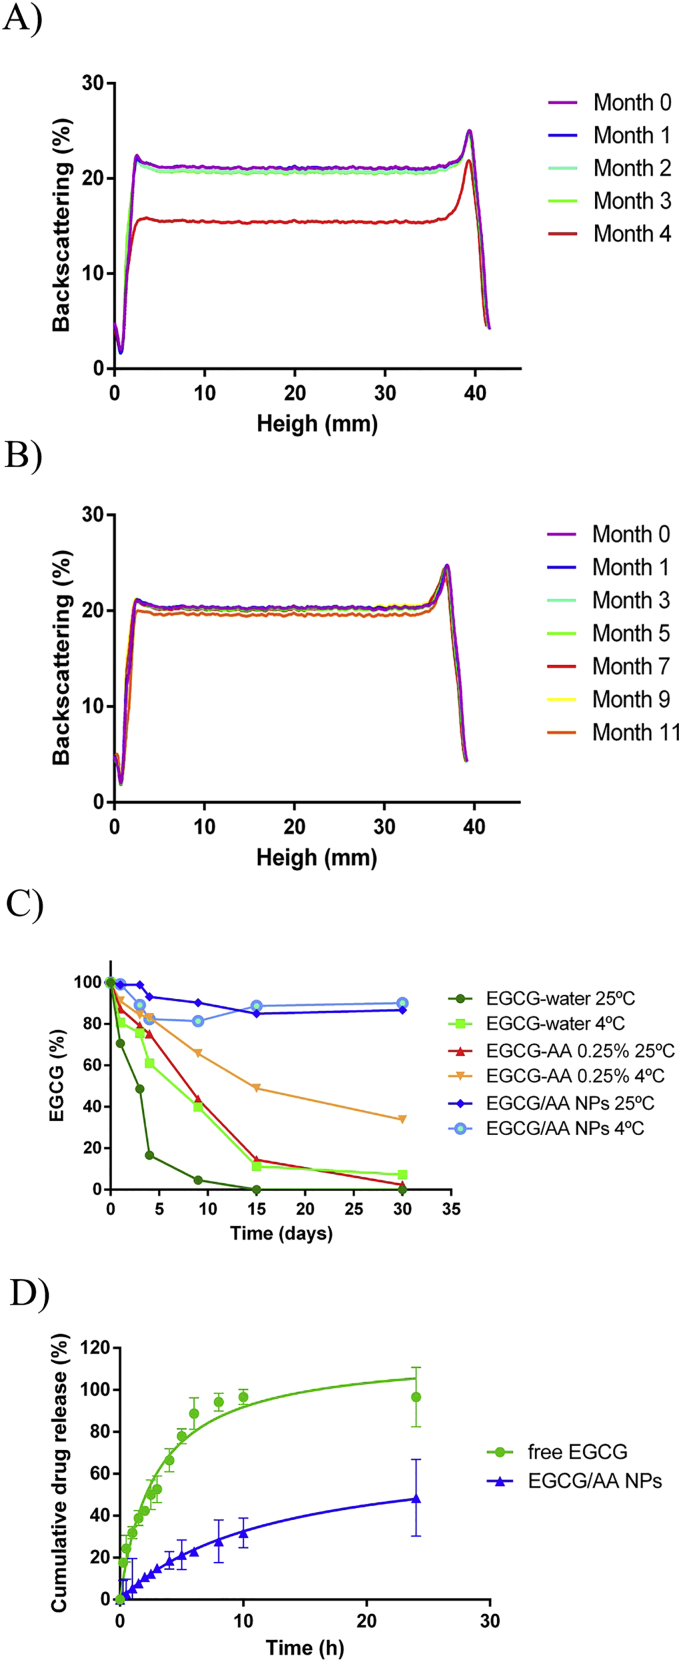
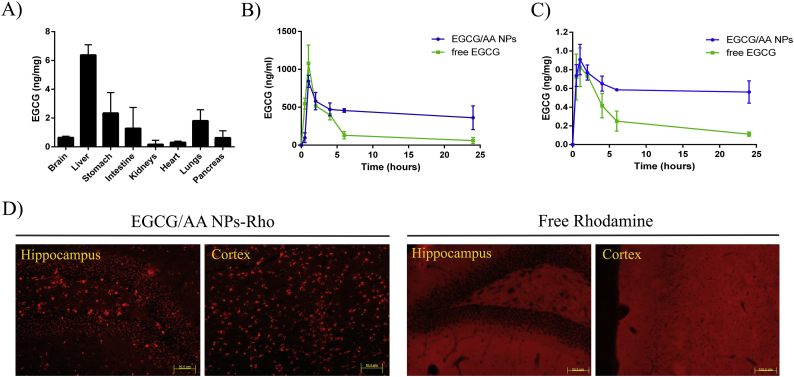
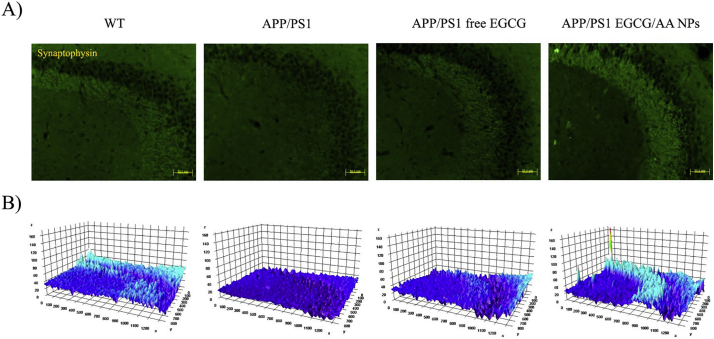
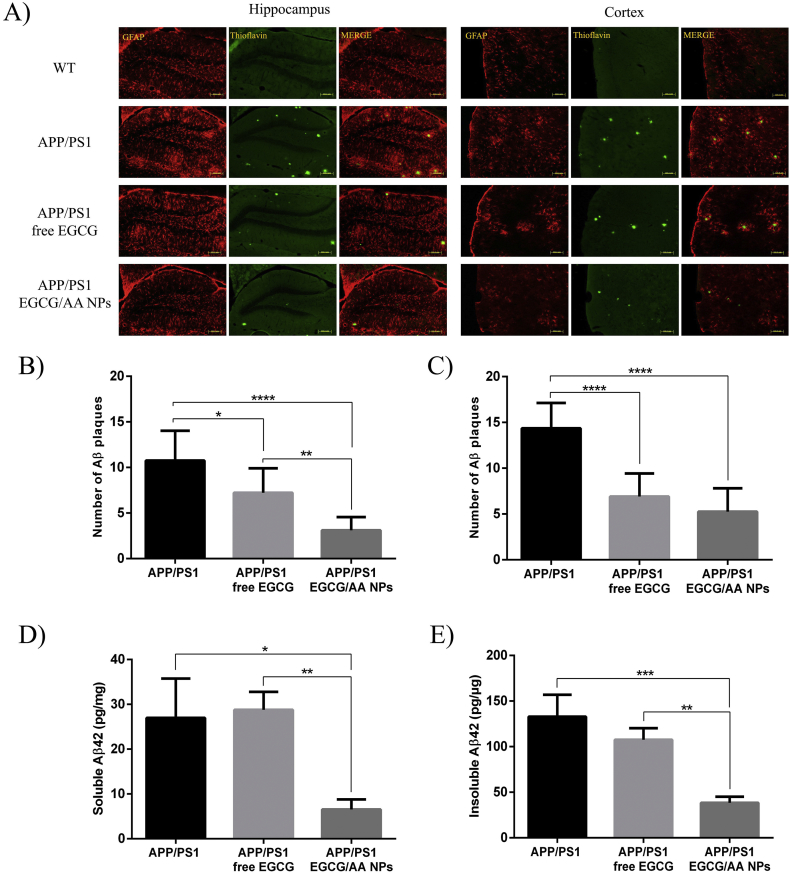
Epigallocatechin-3-gallate (EGCG) is a candidate for treatment of Alzheimer's disease (AD) but its inherent instability limits bioavailability and effectiveness. We found that EGCG displayed increased stability when formulated as dual-drug loaded PEGylated PLGA nanoparticles (EGCG/AA NPs). Oral administration of EGCG/AA NPs in mice resulted in EGCG accumulation in all major organs, including the brain. Pharmacokinetic comparison of plasma and brain accumulation following oral administration of free or EGCG/AA NPs showed that, whilst in both cases initial EGCG concentrations were similar, long-term (5-25 h) concentrations were ca. 5 fold higher with EGCG/AA NPs. No evidence was found that EGCG/AA NPs utilised a specific pathway across the blood-brain barrier (BBB). However, EGCG, empty NPs and EGCG/AA NPs all induced tight junction disruption and opened the BBB in vitro and ex vivo. Oral treatment of APPswe/PS1dE9 (APP/PS1) mice, a familial model of AD, with EGCG/AA NPs resulted in a marked increase in synapses, as judged by synaptophysin (SYP) expression, and reduction of neuroinflammation as well as amyloid β (Aβ) plaque burden and cortical levels of soluble and insoluble Aβ(1-42) peptide. These morphological changes were accompanied by significantly enhanced spatial learning and memory. Mechanistically, we propose that stabilisation of EGCG in NPs complexes and a destabilized BBB led to higher therapeutic EGCG concentrations in the brain. Thus EGCG/AA NPs have the potential to be developed as a safe and strategy for the treatment of AD.

Keywords: APP/PS1 mice; Alzheimer's disease; EGCG; Epigallocatechin gallate; PLGA-PEG; Polymeric nanoparticles.


Figures

Unlabelled Image
Graphical abstract
Fig. 1
Fig. 1
Results of EGCG/AA NPs optimization study. (A) Response surface of size at fixed value of AA 2.5 mg/ml. Optimized value 124.8 ± 5.2 nm. (B) Response surface of PDI at fixed value of AA 2.5 mg/ml. Optimized value 0.054 ± 0.013. (C) Response surface of ZP at fixed value of EGCG 2.5 mg/ml. Optimized value −15.1 ± 1.7 mV. (D) Response surface of EGCG EE at fixed value of AA 2.5 mg/ml. Optimized value 97.1 ± 2.4 (%).
Fig. 2
Fig. 2
Stability and in vitro drug release results. (A) Backscattering profile of EGCG/AA NPs at 25 °C showed nanovehicle instability after 4 months. (B) Backscattering profile of EGCG/AA NPs stored at 4 °C did not show any instability for up to 11 months. (C) EGCG chemical stability in different solutions, formulations and storage temperatures. EGCG showed a significant increase in the stability after the addition of AA to the medium and its incorporation into PEGylated PLGA NPs. (D) In vitro drug release of EGCG/AA NPs and free EGCG. In each condition 25 mg of EGCG were dialysed in a total volume of 150 ml. Thus 0.167 mg/ml was 100% of the maximal equilibrium concentration. Cumulative drug release from EGCG/AA NPs at 24 h = 48.6%. Data shown was from triplicate experiments.
Fig. 3
Fig. 3
In vivo biodistribution and pharmacokinetics of EGCG/AA NPs. 3 months-old C57BL/6 WT mice were treated with a single oral dose of EGCG/AA NPs and EGCG/AA NPs-Rho 40 mg/kg. (A) Histograms show biodistribution of EGCG in brain, liver, stomach, intestine, kidneys, heart, lungs and pancreas of mice after 24 h of EGCG/AA NPs administration. Data expressed as EGCG amount per mg of tissue. Mean administered volume of EGCG/AA NPs was 448 μl (1.120 mg). Mean brain EGCG concentration was 0.6 ng/ml. With mean brain weight of 470 mg this represented 0.025% of administered EGCG. (B) Plasma and (C) brain pharmacokinetic profile of EGCG following single oral dose administration of free EGCG or EGCG/AA NPs (40 mg/kg). Data expressed as EGCG amount per ml of plasma and EGCG amount per mg of tissue, respectively. (D) Rhodamine detection in the dentatus gyrus of the hippocampus and the cortex of mice treated with EGCG/AA NPs-Rho (40 mg/kg) or free Rhodamine (2.7 mg/kg). Scale bar 50 μm.
Fig. 4
Fig. 4
Effect of EGCG formulations on in vitro models (A) Flux of 15, 50, 150 and 500 μg/ml of EGCG/AA NPs-Rho across primary rat BMVECs within the initial 2 h. Data are showed as mean ± SD. At 1440 min values of each data set showed statistical difference to each of the other groups (p < 0.001, ANOVA). (B) FITC-dextran flux across primary rat BMVECs in the presence of 1.5, 5, 15, 50, 150 and 500 μg/ml EGCG, EGCG/AA NPs and equivalent amounts of empty NPs. Flux rates in the absence of drug were normalised to 1. Data are showed as mean ± SEM. (C) Normalised TEER real time measurement of BMVCEs monolayer in response to 1.5, 5, 15, 50, 150 and 500 μg/ml EGCG, EGCG/AA NPs and equivalent amounts of empty NPs (added at 2 h). Shown are mean ± SEM. (D) Claudin-5 (green) and DNA (blue) staining of BMVECs monolayer after exposure to 1.5, 5, 15, 50, 150 and 500 μg/ml EGCG, EGCG/AA NPs and equivalent amounts of empty NPs for 1 h. Scale bar 10 μm. (E) Evans Blue/Albumin leakage response in ex vivo rat brains treated on the indicated side with 1.5, 5, 15, 50, 150 and 500 μg/ml EGCG, EGCG/AA NPs or equivalent amounts of empty NPs for 1 h. (For interpretation of the references to color in this figure legend, the reader is referred to the web version of this article.)
Fig. 5
Fig. 5
Effect of EGCG treatments on SYN expression. 3 months-old APP/PS1 mice were orally treated with EGCG/AA NPs or free EGCG 40 mg/kg/day for 3 months. At 6 months, animals were sacrificed by perfusion with 4% PFA and brains were cut with a cryostat. SYN immunostaining was performed on 20 μm coronal sections. (A) SYN staining of CA3 hippocampus region. Scale bar 50 μm. (B) 3D surface mapping analysis of SYN staining. Interactive 3D surface Plot v 2.4, Image J. Zones with synaptic labeling of the EGCG/AA NPs treated mice exhibited a tridimensional relief and color intensity higher to those of the WT group.
Fig. 6
Fig. 6
Effect of EGCG treatments on neuroinflammation and Aβ plaque/peptide burden. (A) 3 months-old APP/PS1 mice were orally treated with EGCG/AA NPs or free EGCG 40 mg/kg/day for 3 months. At 6 months, animals were sacrificed by perfusion with 4% PFA and brains were cut with a cryostat. GFAP and ThS immunostaining was performed on 20 μm coronal sections. Dentate gyrus of hippocampus and cortex area are shown. Scale bar 100 μm. Images of ThS staining of 100 μm coronal sections of perfused animals were used for Aβ plaques depositions count. Histograms show Aβ plaques depositions count at (B) hippocampus and (C) cortex area. In ELISA kit, animals were sacrificed by cervical dislocation, and brain cortices were homogenized. Histograms show (D) soluble and (E) insoluble amounts of Aβ(1–42) peptide expressed as pg/mg of total protein. ANOVA analysis of data is included in the table S2 of the supplementary material.
Fig. 7
Fig. 7
Behavioural tests results. 3 months-old APP/PS1 mice were orally treated with EGCG/AA NPs or free EGCG 40 mg/kg/day for 3 months and then subjected to MWM and NOR tests. (A, B) Histograms shows the escape latency of learning process (statistics at the end of the training phase) (A) and of the test day (B) of WT, non-treated APP/PS1 and treated APP/PS1 mice. (C, D) Histograms show the time expended in the target quadrant (C) and the time expended at border area (D) the test day. (E) Histograms show the time percentage of investigation of the novel object by WT, non-treated APP/PS1 and treated APP/PS1 mice in the NOR test. ANOVA analysis of data is included in the table S3 of the Supplementary material.

References

    1. Cummings J., Isaacson R., Schmitt F., Velting D. A practical algorithm for managing Alzheimer’s disease: what, when, and why? Ann. Clin. Transl. Neurol. 2015;2(3):307–323. - PMC - PubMed
    1. Association A Alzheimer’ s disease facts and figures. Alzheimers Dement. 2017;13(4):325–373.
    1. Ferri C., Prince M., Brayne C., Brodaty H., Fratiglioni L., Hall K., et al. Global prevalence of dementia: a Delphi consensus study. Lancet. 2010;366(9503):2112–2117. - PMC - PubMed
    1. Prince M., Comas-Herrera A., Knapp M., Guerchet M., Karagiannidou M. 2016. World Alzheimer Report 2016: Improving Healthcare for People Living with Dementia.
    1. Ballard C., Gauthier S., Corbett A., Brayne C., Aarsland D., Jones E. Alzheimer’s disease. Lancet. 2011;377(9770):1019–1031. - PubMed

Publication types

MeSH terms