. 2019 May 7;9(5):1613-1622.
doi: 10.1534/g3.118.200847.

A Diallel of the Mouse Collaborative Cross Founders Reveals Strong Strain-Specific Maternal Effects on Litter Size

Affiliations

A Diallel of the Mouse Collaborative Cross Founders Reveals Strong Strain-Specific Maternal Effects on Litter Size

John R Shorter et al. G3 (Bethesda). .

Abstract

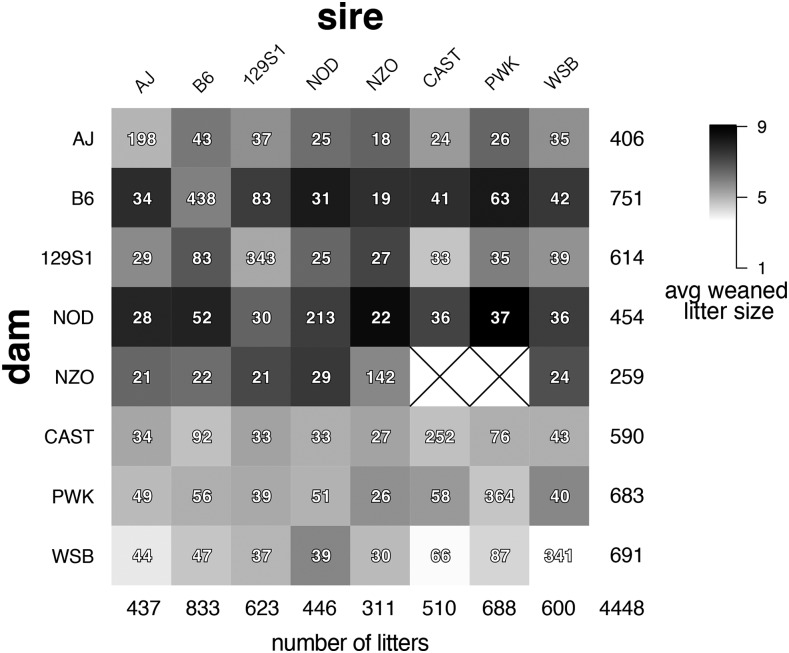
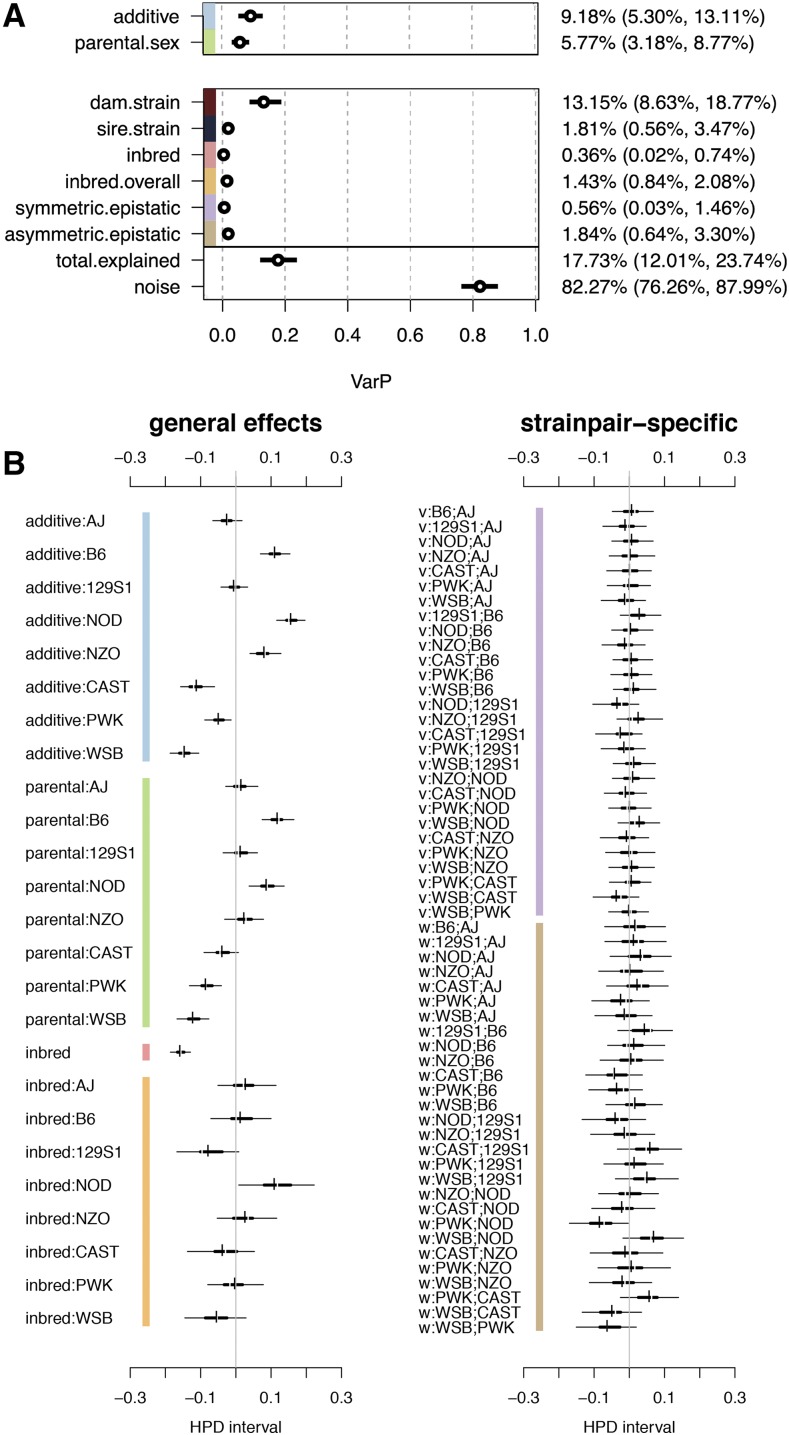
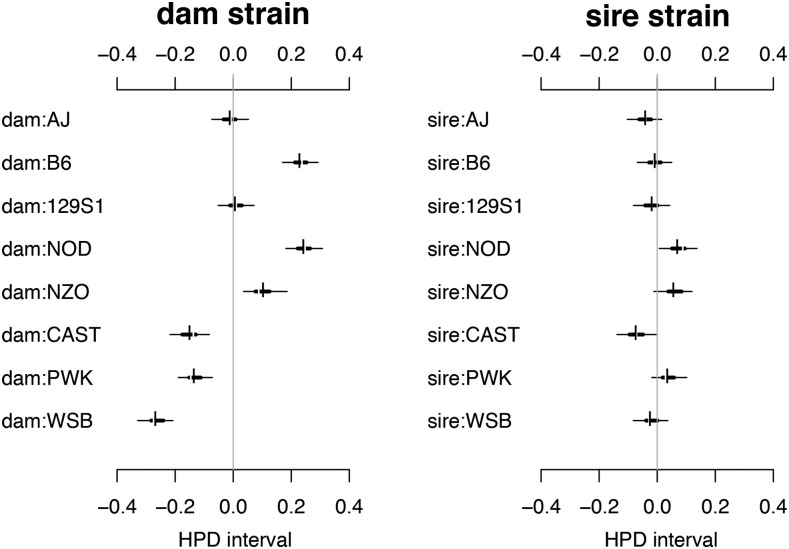
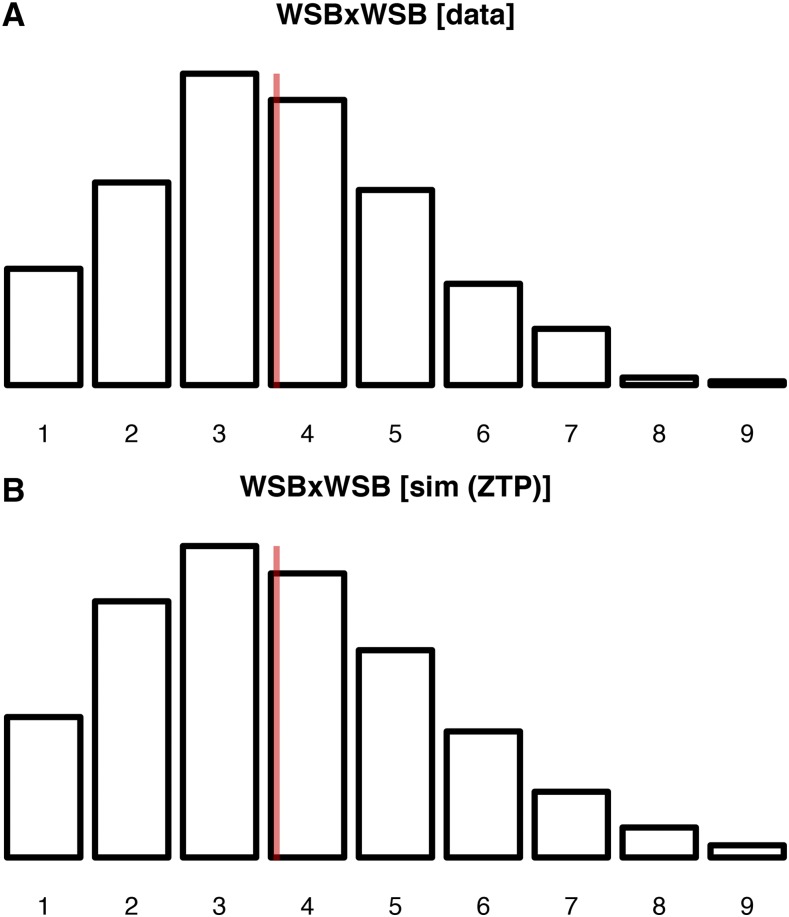
Reproductive success in the eight founder strains of the Collaborative Cross (CC) was measured using a diallel-mating scheme. Over a 48-month period we generated 4,448 litters, and provided 24,782 weaned pups for use in 16 different published experiments. We identified factors that affect the average litter size in a cross by estimating the overall contribution of parent-of-origin, heterosis, inbred, and epistatic effects using a Bayesian zero-truncated overdispersed Poisson mixed model. The phenotypic variance of litter size has a substantial contribution (82%) from unexplained and environmental sources, but no detectable effect of seasonality. Most of the explained variance was due to additive effects (9.2%) and parental sex (maternal vs. paternal strain; 5.8%), with epistasis accounting for 3.4%. Within the parental effects, the effect of the dam's strain explained more than the sire's strain (13.2% vs. 1.8%), and the dam's strain effects account for 74.2% of total variation explained. Dams from strains C57BL/6J and NOD/ShiLtJ increased the expected litter size by a mean of 1.66 and 1.79 pups, whereas dams from strains WSB/EiJ, PWK/PhJ, and CAST/EiJ reduced expected litter size by a mean of 1.51, 0.81, and 0.90 pups. Finally, there was no strong evidence for strain-specific effects on sex ratio distortion. Overall, these results demonstrate that strains vary substantially in their reproductive ability depending on their genetic background, and that litter size is largely determined by dam's strain rather than sire's strain effects, as expected. This analysis adds to our understanding of factors that influence litter size in mammals, and also helps to explain breeding successes and failures in the extinct lines and surviving CC strains.

Keywords: BayesDiallel; F1 cross; MPP; Multiparent Advanced Generation Inter-Cross (MAGIC); additive heritability; fertility; multiparental populations; variance projection; zero-truncated Poisson.


Figures

Figure 1
Figure 1
Diallel crossing scheme and weaned pup distribution. The number of litters observed per cross is given by the integers, with the largest sample sizes, along the diagonal, corresponding to the production of inbred parental strains. Column and row sums are given along the bottom row and rightmost column, respectively. A total of 4,448 litters were evaluated for this analysis, resulting in a total of 24,782 weaned pups. The shading within each box corresponds to the average number of weaned pups per litter in each cross, with averages ranging from 3.6 to 9.1 pups per litter. Litters for which no pups survived until weaning were not included in our analysis. The symbol “×” is used to indicate incompatible crosses that do not produce any litters.
Figure 2
Figure 2
Diallel effects and variance contributions for weaned litter size. (A) Variance contributions of distinct effect classes, reported as posterior means and 95% HPDs of variance projections (VarPs) on weaned litter size. (B) Diallel effects, including (left) strain-specific additive, parental sex, and inbred effects, and (right) epistatic effects between each pairwise cross. For each parameter, thin and thick horizontal lines represent 95% and 50% highest posterior density (HPD) intervals of effects, respectively, and vertical break and dash give posterior median and mean, respectively. The effects are in relation to an overall mean litter size of 5.46 (95% HPD: 5.00-6.10). The gray vertical lines indicate zero. Effects are shown as the log, or latent, scale effects on the mean litter size attributable to each strain or strainpair and inheritance group, where values are centered at 0 for each random effect class. Intervals that exclude zero have non-negligible effects on the mean litter size. Labels with “v” or “w” refer to symmetric or asymmetric epistatic effects, respectively. Colored bars indicate corresponding variance classes in (A) and (B).
Figure 3
Figure 3
Dam.strain and sire.strain variance contributions and estimates of effects on weaned litter size. These effects are a reparameterization of additive and parental.sex effects from the previous analysis. Estimates for the maternal (“dam.strain”) and paternal (“sire.strain”) effects on litter size, as calculated from the additive and parental sex parameters in Figure 2, with HPD intervals defined correspondingly.
Figure 4
Figure 4
Comparison of observed data and (pseudo-)randomly generated data for the WSB×WSB inbreds. (A) Distribution of the litter diallel data for WSB×WSB (nlitters = 341, npups = 1,244). (B) Frequencies expected from a zero-truncated Poisson distribution with mean=3.648 (or λ=3.542, same as in A). The vertical red lines indicate the mean values.
Figure 5
Figure 5
Latent and data scale comparison. An example illustrating zero-truncated Poisson regression of count data, with overdispersion, giving values drawn from pseudorandom normal variables drawn from N(mean=1.265,sd=0.311), showing how the continuous latent scale values [top], which correspond to the scale of the linear predictor, map onto their expected (data) scale value (through the inverse link, f(x)=ex) [middle], and how the mean expected (data) scale value corresponds to the observed (data) scale values (integers) from ZTPois(λ=3.542) [bottom]. These values were chosen to resemble the real distribution shown in Figure 4. The vertical red lines correspond to the mean of the values shown in each respective frame.

References

    1. Avalos E., Smith C., 1987. Genetic improvement of litter size in pigs. Anim. Sci. 44: 153–163.
    1. Aylor D. L., Valdar W., Foulds-Mathes W., Buus R. J., Verdugo R. A., et al. , 2011. Genetic analysis of complex traits in the emerging collaborative cross. Genome Res. 21: 1213–1222. 10.1101/gr.111310.110 - DOI - PMC - PubMed
    1. Bandy T., Eisen E., 1984. Prenatal and postnatal effects in mouse lines selected for body weight and litter size: performance of postnatal dams and growth of progeny. J. Anim. Sci. 59: 896–907. 10.2527/jas1984.594896x - DOI
    1. Beauchamp G., Kacelnik A., 1990. On the fitness functions relating parental care to reproductive value. J. Theor. Biol. 146: 513–522. 10.1016/S0022-5193(05)80376-5 - DOI
    1. Bogue M. A., Grubb S. C., Walton D. O., Philip V. M., Kolishovski G., et al. , 2018. Mouse phenome database: an integrative database and analysis suite for curated empirical phenotype data from laboratory mice. Nucleic Acids Res. 46: D843–D850. 10.1093/nar/gkx1082 - DOI - PMC - PubMed

Publication types