. 2019 May 7;9(5):1429-1436.
doi: 10.1534/g3.119.400101.

Imperfect Linkage Disequilibrium Generates Phantom Epistasis (& Perils of Big Data)

Affiliations

Imperfect Linkage Disequilibrium Generates Phantom Epistasis (& Perils of Big Data)

Gustavo de Los Campos et al. G3 (Bethesda). .

Abstract

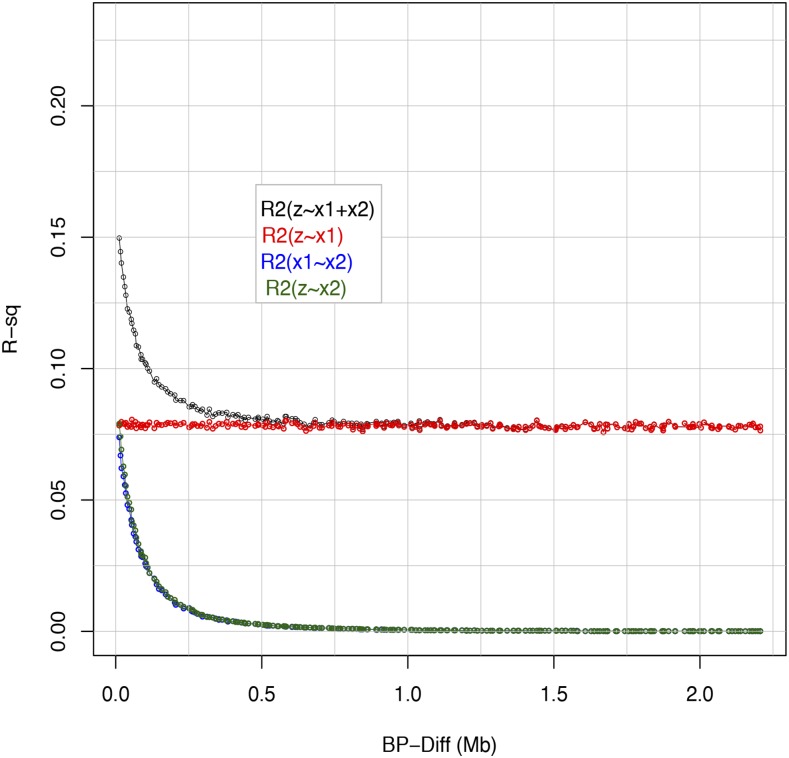
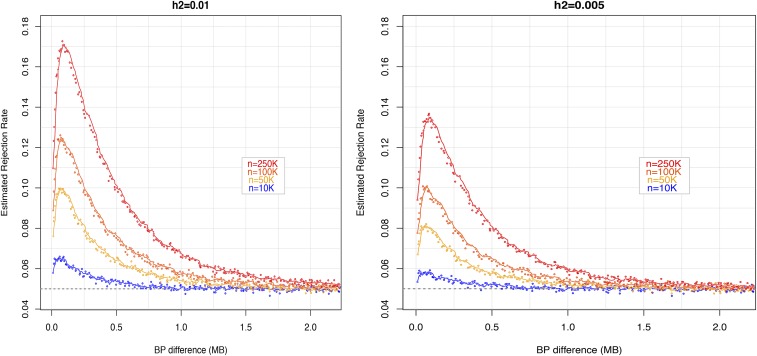
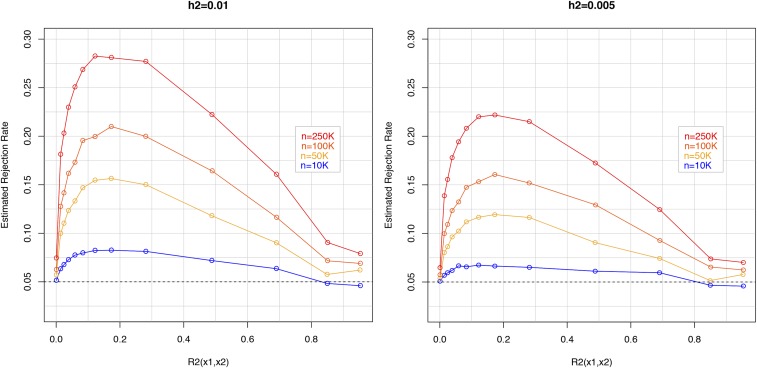
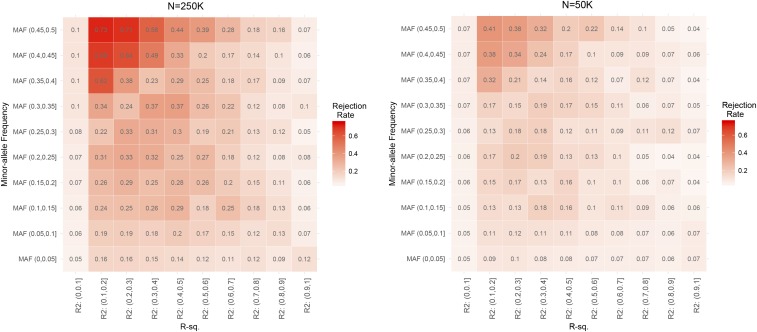
The genetic architecture of complex human traits and diseases is affected by large number of possibly interacting genes, but detecting epistatic interactions can be challenging. In the last decade, several studies have alluded to problems that linkage disequilibrium can create when testing for epistatic interactions between DNA markers. However, these problems have not been formalized nor have their consequences been quantified in a precise manner. Here we use a conceptually simple three locus model involving a causal locus and two markers to show that imperfect LD can generate the illusion of epistasis, even when the underlying genetic architecture is purely additive. We describe necessary conditions for such "phantom epistasis" to emerge and quantify its relevance using simulations. Our empirical results demonstrate that phantom epistasis can be a very serious problem in GWAS studies (with rejection rates against the additive model greater than 0.28 for nominal p-values of 0.05, even when the model is purely additive). Some studies have sought to avoid this problem by only testing interactions between SNPs with R-sq. <0.1. We show that this threshold is not appropriate and demonstrate that the magnitude of the problem is even greater with large sample size, intermediate allele frequencies, and when the causal locus explains a large amount of phenotypic variance. We conclude that caution must be exercised when interpreting GWAS results derived from very large data sets showing strong evidence in support of epistatic interactions between markers.

Keywords: Big Data; GWAS; apparent epistasis; epistasis; imperfect LD; linkage disequilibrium; missing heritability; phantom epistasis.


Figures

Figure 1
Figure 1
Average R-squared between pairs of loci and proportion of variance of the QTL genotype explained by the two markers, R2(zix1i+x2i), vs. distance between the QTL (zi) and the distal marker (x2i). Marker x1i was always adjacent to the QTL.
Figure 2
Figure 2
Empirical rejection rates vs. distance between the QTL and the distal marker, by proportion of variance explained by the QTL (left and right panels) and sample size (curves). In the simulations, a single QTL (zi) had an additive effect that explained either 1% (left) or 0.5% (right) of the phenotypic variance. The empirical model considered two SNPs with no causal effect. One of them (x1i) was adjacent to the QTL and the other one (x2i) was placed at increasing distance from the pair (x1i,zi). Rejection of the null hypothesis (no interaction between x1i and x2i) was conducted at a 0.05 significance level. Empirical rejection rates above 0.05 are indicative of phantom epistasis.
Figure 3
Figure 3
Empirical rejection rates vs. R-squared between the proximal and distal marker, by proportion of variance explained by the QTL (left and right panels) and sample size (curves). The simulation setting here was the same as that in Figure 2: a single QTL (zi) had an additive effect that explained either 1% (left) or 0.5% (right) of the phenotypic variance. The empirical model considered two SNPs with no causal effect. One of them (x1i) was adjacent to the QTL and the other one (x2i) was placed at increasing distance from the pair (x1i,zi). Rejection of the null hypothesis (no interaction between x1i and x2i) was conducted at a 0.05 significance level. Empirical rejection rates above 0.05 are indicative of phantom epistasis.
Figure 4
Figure 4
Heatmap of empirical rejection rates by sample size (left and right panels), minor allele frequency (average of the two SNPs) and R-squared between the two SNPs involved in the interaction. The simulation setting here was the same as the one used to produce the results of Figures 2 and 3. The results in the figure correspond to an additive QTL that explained 1% of the variance and a sample size of either 250K (left) or 50K (right).

References

    1. Aschard H., 2016. A Perspective on Interaction Effects in Genetic Association Studies. Genet. Epidemiol. 40: 678–688. 10.1002/gepi.21989 - DOI - PMC - PubMed
    1. Bulmer M. G., 1971. The Effect of Selection on Genetic Variability. Am. Nat. 105: 201–211. 10.1086/282718 - DOI
    1. Cordell H. J., 2002. Epistasis: What It Means, What It Doesn’t Mean, and Statistical Methods to Detect It in Humans. Hum. Mol. Genet. 11: 2463–2468. 10.1093/hmg/11.20.2463 - DOI - PubMed
    1. Cordell H. J., 2009. Detecting Gene-Gene Interactions That Underlie Human Diseases. Nat. Rev. Genet. 10: 392–404. 10.1038/nrg2579 - DOI - PMC - PubMed
    1. de los Campos G., Gianola D., Rosa G. J., Weigel K. A., Crossa J., 2010. Semi-Parametric Genomic-Enabled Prediction of Genetic Values Using Reproducing Kernel Hilbert Spaces Methods. Genet. Res. (Camb) 92: 295–308. 10.1017/S0016672310000285 - DOI - PubMed

Publication types