. 2019 May 3;294(18):7348-7359.
doi: 10.1074/jbc.RA118.004297. Epub 2019 Mar 15.

Crystal structure of the TreS:Pep2 complex, initiating α-glucan synthesis in the GlgE pathway of mycobacteria

Affiliations

Crystal structure of the TreS:Pep2 complex, initiating α-glucan synthesis in the GlgE pathway of mycobacteria

Ali A Kermani et al. J Biol Chem. .

Abstract

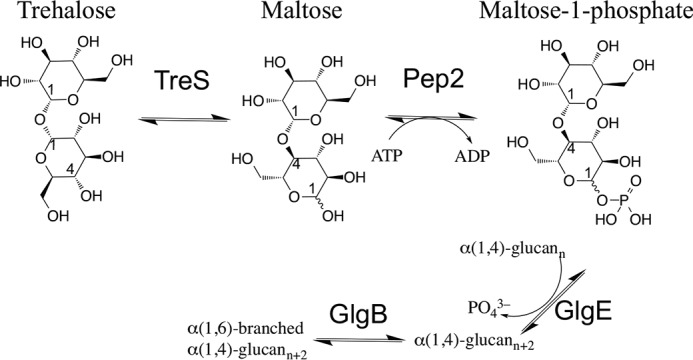
A growing body of evidence implicates the mycobacterial capsule, the outermost layer of the mycobacterial cell envelope, in modulation of the host immune response and virulence of mycobacteria. Mycobacteria synthesize the dominant capsule component, α(1→4)-linked glucan, via three interconnected and potentially redundant metabolic pathways. Here, we report the crystal structure of the Mycobacterium smegmatis TreS:Pep2 complex, containing trehalose synthase (TreS) and maltokinase (Pep2), which converts trehalose to maltose 1-phosphate as part of the TreS:Pep2-GlgE pathway. The structure, at 3.6 Å resolution, revealed that a diamond-shaped TreS tetramer forms the core of the complex and that pairs of Pep2 monomers bind to opposite apices of the tetramer in a 4 + 4 configuration. However, for the M. smegmatis orthologues, results from isothermal titration calorimetry and analytical ultracentrifugation experiments indicated that the prevalent stoichiometry in solution is 4 TreS + 2 Pep2 protomers. The observed discrepancy between the crystallized complex and the behavior in the solution state may be explained by the relatively weak affinity of Pep2 for TreS (Kd 3.5 μm at mildly acidic pH) and crystal packing favoring the 4 + 4 complex. Proximity of the ATP-binding site in Pep2 to the complex interface provides a rational basis for rate enhancement of Pep2 upon binding to TreS, but the complex structure appears to rule out substrate channeling between the active sites of TreS and Pep2. Our findings provide a structural model for the trehalose synthase:maltokinase complex in M. smegmatis that offers critical insights into capsule assembly.

Keywords: X-ray crystallography; analytical ultracentrifugation; capsule; enzyme catalysis; immune evasion; maltose kinase; mycobacteria; pathogenesis; protein complex; trehalose; trehalose synthase; α-glucan.


Conflict of interest statement

The authors declare that they have no conflicts of interest with the contents of this article

Figures

Figure 1.
Figure 1.
Schematic diagram of the GlgE pathway of mycobacterial α-glucan synthesis. Conversion of trehalose to maltose 1-phosphate proceeds through isomerization (TreS) and phosphorylation (Pep2) of the disaccharide (generated using ChemBioDraw).
Figure 2.
Figure 2.
Architecture of the M. smegmatis TreS:Pep2 complex. A, view of the TreS tetramer, illustrating juxtaposition of the C-terminal β-sandwich domains (hues of magenta) at the apices of the tetramer. The tetramer shown is from the first of two complex copies in the asymmetric unit (complex 1) with chain identifiers A–D. B, assembly of the TreS:Pep2 complex in the orientation of A, with TreS and Pep2 subunits shown in blue and green ribbons, respectively. Spheres indicate the location of the active sites, as derived from the superposition with substrate-bound homologous structures. Capital letters designate the chain identifiers in complex 1. C, top view of the assembly shown in B, with Pep2 subunits rendered as molecular surfaces. The rotation relative to B is indicated. D, illustration of the relative spatial positions of the active sites of TreS and Pep2. The line in magenta shows the linear distance (53 Å) between the disaccharide-binding sites, and the openings of the actives sites to solvent are marked.
Figure 3.
Figure 3.
Structure of M. smegmatis Pep2 and topology of its N-terminal lobe. A, ribbon diagram of the M. smegmatis Pep2 (MsPep2) monomer. The conserved and unique regions in the N-terminal lobe are shown in hues of blue, matching the color scheme of the topology diagram in C. Spheres in gray indicate the binding sites of nucleotide and maltose, as derived from secondary structure-matched superposition with GDP-bound aminoglycoside 2″-phosphotransferase IIIa (PDB code 3TDW (38)) and maltose-bound M. tuberculosis Pep2 (PDB code 4O7P (21)), respectively. B, ribbon diagram of B. subtilis methylribose kinase (PDB code 2PUL (22)), the closest structural neighbor of Pep2 according to DALI (23) (RMSD 3.9 Å for 262 aligned Cα positions, 12% identity). C, topology diagram of the N-terminal lobe of MsPep2. D, superposition of MsPep2 chains I, J, L, and M with respect to residues 198–400. E, superposition of MsPep2 with M. tuberculosis Pep2 (MtPep2) (PDB code 4O7O (21), gray ribbon). Secondary structure labels referring to MtPep2 are preceded by the prefix Mtb. The Cα traces deviate following strand β7, where the backbone of MsPep2 (magenta) traverses to the other end of the canonical β-sheet (β8), whereas the backbone of MtPep2 (yellow) extends to the adjacent, NCS-related copy of Pep2 in a domain swap-mediated dimerization.
Figure 4.
Figure 4.
Contact surfaces between TreS and Pep2. A, side view of the TreS:Pep2 interface for chain I of MsPep2. The surface of TreS is colored gray and in hues of magenta (indicating the C-terminal β-sandwich domain of TreS). MsPep2 is colored in hues of blue (N-terminal lobe) and orange (C-terminal lobe). Contact surfaces between TreS and Pep2 are colored green (on TreS) and yellow (on Pep2) according to burial of solvent-exposed surface (calculated using PISA (39)). B, area (green) on the molecular surface of TreS contacted by chain I of MsPep2 as seen from the position of the Pep2 subunit. The dashed line indicates the boundary between the C-terminal β-sandwich and the TIM-barrel domains of TreS. C, area on Pep2 (chain I) contacted by TreS, as seen from the viewpoint of the latter. Areas in yellow and green contact TreS chains B and A, respectively.
Figure 5.
Figure 5.
Probing binding between M. smegmatis TreS and Pep2 by isothermal titration calorimetry and sedimentation equilibrium analysis of the M. smegmatis TreS:Pep2 complex. A and B, proteins were in sodium phosphate buffer at pH values of 6.5, 7.5, and 8.5. The starting concentration of TreS in the reaction chamber was 75 μm, and Pep2 was titrated up to nominal molar ratio of ∼1.5. A, trace of the injections at pH 6.5 and plot of integrated peak areas versus concentration ratio [Pep2]/[TreS], with the fit representing a single-site binding model. B, fit of a two-site binding model to the data in A. C, 1:1 molar mixture of M. smegmatis TreS and Pep2 was analyzed at three different protein concentrations ([TreS] = 3.75, 2.5, and 1.25 μm) and three rotation speeds (8000, 9000, and 10,000 rpm). Data points are shown as open symbols, and solid lines represent the best fit (top panel) and residuals (lower panel), respectively. The fitted mass was 372,823 Da, compared with a calculated mass of 370,407 Da for a complex of 4 TreS + 2 Pep2. Data shown illustrate the fit for the highest protein concentration (see also Fig. S5).
Figure 6.
Figure 6.
Activity of M. smegmatis Pep2 as a function of pH and in presence/absence of M. smegmatis TreS. Activity of Pep2 was analyzed, coupling generation of ADP to depletion of NADH (see under “Experimental procedures”). A, pH dependence of activity in the presence of 20 mm maltose. B, Pep2 activity at pH 6.0 as a function of maltose concentration (0.3 mm ATP) and adding TreS at molar ratios as indicated. C and D, probing the effect of M. smegmatis TreS on Pep2 activity at pH 7.5 and 6.0, respectively, with maltose at 20 mm. Data in A–D were fitted to the Michaelis-Menten equation (vi = Vmax [S]/(KM + [S])). Error bars are omitted where they appear smaller than the corresponding data point marker.
Figure 7.
Figure 7.
Probing M. tuberculosis TreS:Pep2 complex formation with amino acid substitutions at the binding interface. A, location of the substitution sites Msm Pro-303 (Mtb Pro-311) and Msm Arg-312 (Mtb Arg-320), with a close-up view on the right. Pep2 is shown with a translucent molecular surface (blue and orange ribbon), and TreS is shown as a ribbon only (gray and purple). Residue numbers refer to the Msm sequences, with corresponding Mtb residue numbers in parentheses. Selected secondary structure elements are labeled, with letters T and P indicating TreS and Pep2, respectively. B, size-exclusion profiles of Mtb TreS (WT, P511W, and R320E) and of Mtb Pep2 in the absence of their complex partners. Void volume and position of markers ferritin (11.4 ml) and albumin (14.8 ml, 13 ml) are indicated. C–E, size-exclusion profiles of Mtb TreS (WT, P511W, and R320E) in the presence of an equimolar amount of Mtb Pep2 superimposed over the elution traces of free TreS of B. For the ease of comparing separate runs, the absorbance signals were scaled such that the maximal absorbance is indicated as 1.0. To facilitate a direct comparison between the elution behavior of TreS:Pep2 complex (orange) to that of the constituent proteins, the elution traces of Pep2 (gray) and of the relevant forms of TreS (WT or mutant) of B appear again in C–E (blue).
Figure 8.
Figure 8.
Illustration of the two-site binding model for binding of four copies of Pep2 to the TreS tetramer. Binding of the first copy of Pep2 at an unoccupied apical binding site (Site 1) is governed by Kd, 1 and does not influence affinity for binding of the first copy at the opposite apex (Site 1′). Hence, Sites 1 and 1′ have identical dissociation constants. Binding of the second copy of Pep2 may encounter steric constraints imposed by the previously bound copy, and therefore, the affinity for binding the second copy, Kd, 2, at Site 2 (or Site 2′) is different.

References

    1. Mishra A. K., Driessen N. N., Appelmelk B. J., and Besra G. S. (2011) Lipoarabinomannan and related glycoconjugates: structure, biogenesis and role in Mycobacterium tuberculosis physiology and host–pathogen interaction. FEMS Microbiol. Rev. 35, 1126–1157 10.1111/j.1574-6976.2011.00276.x - DOI - PMC - PubMed
    1. Stokes R. W., Norris-Jones R., Brooks D. E., Beveridge T. J., Doxsee D., and Thorson L. M. (2004) The glycan-rich outer layer of the cell wall of Mycobacterium tuberculosis acts as an antiphagocytic capsule limiting the association of the bacterium with macrophages. Infect. Immun. 72, 5676–5686 10.1128/IAI.72.10.5676-5686.2004 - DOI - PMC - PubMed
    1. Geurtsen J., Chedammi S., Mesters J., Cot M., Driessen N. N., Sambou T., Kakutani R., Ummels R., Maaskant J., Takata H., Baba O., Terashima T., Bovin N., Vandenbroucke-Grauls C., Nigou J., et al. (2009) Identification of mycobacterial α-glucan as a novel ligand for DC-SIGN: involvement of mycobacterial capsular polysaccharides in host immune modulation. J. Immunol. 183, 5221–5231 10.4049/jimmunol.0900768 - DOI - PubMed
    1. Sambou T., Dinadayala P., Stadthagen G., Barilone N., Bordat Y., Constant P., Levillain F., Neyrolles O., Gicquel B., Lemassu A., Daffé M., and Jackson M. (2008) Capsular glucan and intracellular glycogen of Mycobacterium tuberculosis: biosynthesis and impact on the persistence in mice. Mol. Microbiol. 70, 762–774 10.1111/j.1365-2958.2008.06445.x - DOI - PMC - PubMed
    1. Romero M. M., Basile J. I., López B., Ritacco V., Barrera L., Sasiain Mdel C., and Alemán M. (2014) Outbreaks of Mycobacterium tuberculosis MDR strains differentially induce neutrophil respiratory burst involving lipid rafts, p38 MAPK and Syk. BMC Infect. Dis. 14, 262 10.1186/1471-2334-14-262 - DOI - PMC - PubMed

Publication types

MeSH terms

LinkOut - more resources