. 2019 Mar 15;2(2):e201800207.
doi: 10.26508/lsa.201800207. Print 2019 Apr.

Dependence on Myb expression is attenuated in myeloid leukaemia with N-terminal CEBPA mutations

Affiliations

Dependence on Myb expression is attenuated in myeloid leukaemia with N-terminal CEBPA mutations

Giacomo Volpe et al. Life Sci Alliance. .

Abstract

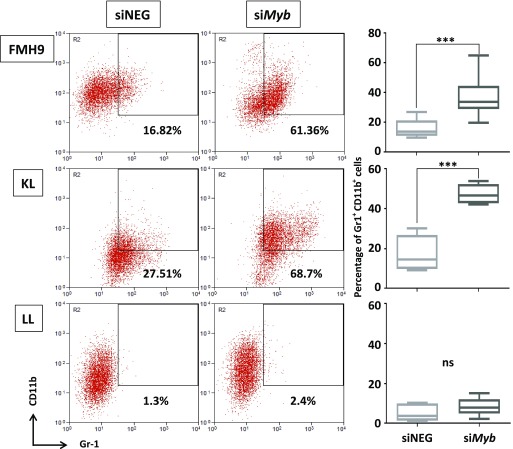
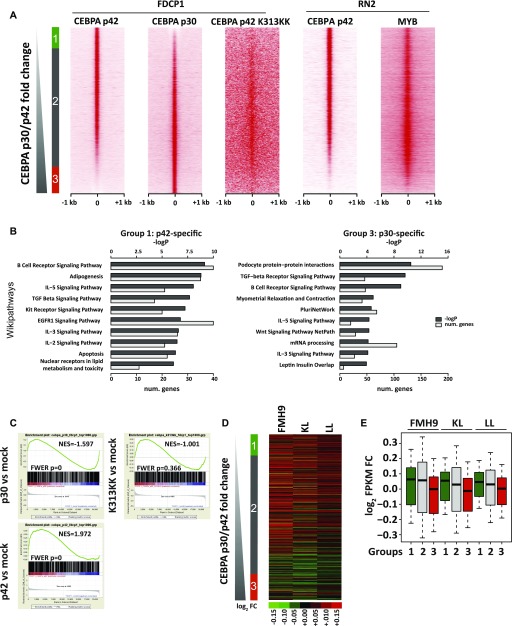
Mutations at the N- or C-terminus of C/EBPα are frequent in acute myeloid leukaemia (AML) with normal karyotype. Here, we investigate the role of the transcription factor Myb in AMLs driven by different combinations of CEBPA mutations. Using knockdown of Myb in murine cell lines modelling the spectrum of CEBPA mutations, we show that the effect of reduced Myb depends on the mutational status of the two Cebpa alleles. Importantly, Myb knockdown fails to override the block in myeloid differentiation in cells with biallelic N-terminal C/EBPα mutations, demonstrating for the first time that the dependency on Myb is much lower in AML with this mutational profile. By comparing gene expression following Myb knockdown and chromatin immunoprecipitation sequencing data for the binding of C/EBPα isoforms, we provide evidence for a functional cooperation between C/EBPα and Myb in the maintenance of AML. This co-dependency breaks down when both alleles of CEBPA harbour N-terminal mutations, as a subset of C/EBPα-regulated genes only bind the short p30 C/EBPα isoform and, unlike other C/EBPα-regulated genes, do so without a requirement for Myb.


Conflict of interest statement

The authors declare no conflicts of interest.

Figures

Figure 1.
Figure 1.. Myb expression is required for the proliferation of CEBPA biallelic mutant cell lines.
(A) Scatter plot depicting the abundance of MYB transcript in subgroups of patients from the Verhaak et al (2009) dataset, characterised by the molecular abnormalities indicated in the graph. Statistical significance presented in this plot has been calculated using non-parametric the Kruskal–Wallis test. (B) Bar plot representing Myb mRNA quantification by quantitative RT-PCR in FMH9, KL, and LL cell lines, normalised against B2m house-keeping gene results. Statistical analysis was performed using t test (**P < 0.01 and *P < 0.05). (C) Quantitative RT-PCR of Myb transcript abundance in FMH9, KL, and LL cells 24 h post-transfection with Myb siRNA. Expression is normalised to B2m and standardised to the control samples. Error bars represent the SEM and numbers are plotted as mean ± SEM. Each plot is representative of six independent experiments (***P < 0.001 and *P < 0.05). (D) Bar plot indicating the cell viability and relative proliferation of FMH9, KL, and LL cells after Myb siRNA transfection relative to the corresponding negative control (***P < 0.001 and **P < 0.01, *P < 0.05). This plot represents an average of six independent experiments. (E) Flow cytometric analysis of cellular proliferation by CFSE incorporation in FMH9, KL, and LL cells after Myb siRNA transfection relative to the corresponding negative control. Continuous lines indicate cells transfected with the negative control siRNA, whereas dashed lines indicate siMyb-transfected cells. The statistical analysis was performed using t test on the geometric means of fluorescence intensity for each time point comparing siNEG versus siMyb-treated cells, as indicated by the colour-matched bar on top of every peak (**P < 0.01 and *P < 0.05). Each histogram is representative of six independent experiments. (F) Flow cytometric analysis of the cell cycle in FMH9, KL, and LL cells was performed by staining with 7-AAD at 48 h after Myb siRNA transfection and compared with the negative control. Percentages of cells in G0/G1 are indicated in each histogram. Each plot is indicative of six independent experiments. (G) Representative bar plot showing apoptosis analysis performed by Annexin V staining 72 h post Myb siRNA transfection in FMH9, KL, and LL cells (***P < 0.001 and **P < 0.01). Each bar plot represents an average of six independent experiments.
Figure S1.
Figure S1.
(A) Phenotypic characterisation of CD11b, Gr-1, Flt3, and Kit surface marker expression in FMH9, KL, and LL cells. (B) Related to Fig 1D. Bar plot depicting the siNEG/siMyb proliferation ratio comparison between FMH9 control and CEBPA-mutant cell lines. These data represent an average of six independent experiments. Statistical analysis was performed using t test (***P < 0.001, **P < 0.01). (C) Related to Fig 1E. Bar plots representing the average of CFSE geometric mean intensities (as indicated by the bar on top of every peak in Fig 1E) of FMH9, KL, and LL cells and their relative changes upon siMyb-mediated knockdown. Filled bars represent siNEG-treated cells, whereas empty bars indicated siMyb-treated cells. Geometric mean intensities have been calculated using FlowJo software and have been used to perform statistical analysis using the t test (**P < 0.01, *P < 0.05). These data represent an average of six independent experiments.
Figure S2.
Figure S2.. Related to Fig 1F and G.
(A) Phenotypic two-dimensional dot-plots representing the percentage of FMH9, KL, and LL cells in the G0/G1, S, and G2/M phases of the cell cycles and their changes in response to Myb siRNA-mediated down-regulation. The percentage of each population is indicated in every histogram. (B) Bar plots depicting the changes in the percentages of FMH9, KL, and LL cells in the G0/G1, S, and G2/M phases of the cell cycle as shown in the top panel. These data represent an average of six independent experiments. Statistical analysis was performed using t test (***P < 0.001, **P < 0.01). (C) Representative histograms showing cell cycle profile changes in response to Myb siRNA-mediated knockdown in FMH9, KL, and LL. The percentage of cells in G0/G1 and apoptotic/necrotic cells is indicated in each histogram. This panel is indicative of six independent experiments.
Figure S3.
Figure S3.. Related to Fig 1G.
(A) Two-dimensional dot-plots representing the percentage of Annexin V+ cells in FMH9, KL, and LL cells in response to Myb siRNA-mediated down-regulation. Each dot plot is representative of six independent experiments. (B) Bar plots showing quantitative PCR analysis of Bcl2 and Bim expression in FMH9, KL, and LL cells in response to Myb knockdown in four independent experiments. Expression is normalised to β2m and standardised to the siNEG-treated samples for every cell line. Error bars represent the standard error or the mean. Statistical analysis was performed using t test (*P < 0.05).
Figure 2.
Figure 2.. Suppression of Myb expression overrides myeloid differentiation block in FMH9, KL but not in LL cells.
Two-dimensional flow cytometric dot plot representing the analysis of CD11b and Gr-1 myeloid surface markers expression in FMH9, KL, and LL transfected with either Myb siRNA or the corresponding control. The percentage of double-positive cells is indicated in every plot. The box plots in the right panel shows an average of six independent experiments. Statistical significance was calculated using t test (***P < 0.001).
Figure S4.
Figure S4.. Related to Fig 3.
(A) University of California at Santa Cruz (UCSC) genome browser screenshots of RNA-Seq performed in FMH9, KL, and LL cells with siMyb and siNEG treatment at differentially regulated genes. Profiles scaled to 1% GAPDH. (B) Absolute (top) and siNEG-relative (bottom) FPKM quantification of expression levels of genes are shown.
Figure 3.
Figure 3.. Myb down-regulation causes concomitant differential regulation of leukaemia gene expression programmes in both FMH9 and KL but not LL cells.
(A) Spearman correlation clustering of steady-state, control scrambled negative siRNA-transfected FMH9, KL, and LL cells. (B) Venn diagram overlaps of differentially expressed genes in FMH9, KL, and LL cell lines following Myb knockdown. Left and right: significantly down- and up-regulated genes, respectively. (C) Hierarchical clustering of log2 fold changes resulting from siMyb treatment in FMH9, KL, and LL cells. (D) Average siMyb/siNEG log2 fold changes for leukaemia-relevant GO classes. (E) RT-qPCR gene expression analysis of differentiation, apoptosis, and cell cycle genes post control and siMyb transfection. Relative expression values are presented as ± SEM. Statistical analysis was performed using t test (***P < 0.001, **P < 0.01, and *P < 0.05). Each bar plot represents an average of six independent experiments.
Figure S5.
Figure S5.. Related to Fig 3.
(A) Boxplot showing FPKM gene expression levels of genes differentially regulated in FMH9, KL, and LL cells following Myb knockdown. (B) Heat maps showing gene expression fold changes at individual genes from GO categories depicted in Fig 3D. The detailed list of genes from each pathway/group is provided in Table S2.
Figure S6.
Figure S6.. Related to Fig 4.
(A) Cebpa transcript abundances in FDCP1 cells transfected with mock, p30, and p42 C/EBPα isoforms measured by RNA-Seq, relative to B2m. (B) Cebpa transcript abundances in FMH9, KL, and LL cells measured by quantitative RT-PCR, relative to B2m. This bar plot represents an average of six independent experiments. Statistical analysis was performed using t test (***P < 0.001, **P < 0.01, *P < 0.05). (C) UCSC genome browser screenshot of C/EBPα p30, p42, and K313KK ChIP-Seq datasets in the FDCP1 cell line at the Runx1 gene locus. (D) Stacked percentage bar plots showing genomic annotation of C/EBPα p30, p42, and K313KK ChIP-seq peaks in the FDCP1 cell line.
Figure 4.
Figure 4.. p42 C/EBPα binding is linked with gene activation increased following Myb knockdown, whereas p30 C/EBPα binding correlates with gene repression independently of Myb.
(A) Heat maps sorted by C/EBPα p30/p42 tag count fold change of ChIP-seq signals for C/EBPα p42, C/EBPα p42 K313KK, and C/EBPα p30 isoforms in the FDCP1 cell line, as well as for Myb and C/EBPα p42 in the RN2 cell line. (B) GO analyses of p42 and p30 C/EBPα-specific peaks (left, right). (C) Gene set enrichment analyses of C/EBPα p30, C/EBPα p42, and C/EBPα p42-K313KK binding versus cognate-induced fold change (top left, top right, and bottom left, respectively). (A, D) Heat map showing siMyb/siNEG gene expression fold change in FMH9, KL, and LL cells sorted by C/EBPα p30/p42 ChIP-seq tag count fold change as in (A). (A, D, E) Box plots showing quantification of gene expression fold changes from (D) for the nearest genes from groups 1, 2, and 3 defined in (A). Means indicated.
Figure S7.
Figure S7.. Differential p42, p30 C/EBPα binding with CEBP, MYB motifs and co-localisation with active and repressive transcriptional hallmarks.
(A) Plots showing motif discovery results (x-axis, motif rank; y-axis, −logP) in p42-specific peaks (top) and p-30 specific peaks (bottom). (B) Heat maps showing matches of top p42-specific (top) and p30-specific motifs ranked by p30/p42 C/EBPα ChIP-Seq tag count fold change as in Fig 4A. (A, C) RN2 ChIP-Seq tag counts for transcription factors known to bind motifs from (A) as well p300 sorted as in (C) and Fig 4A. (D) Heat map showing MEL ChIP-Seq tag counts for transcription factors known to bind motifs from Fig S5A, as well as co-activators and co-repressors sorted by p30/p42 C/EBPα tag count fold change as in Fig 4A.

Similar articles

Cited by

References

    1. Ashburner M, Ball CA, Blake JA, Botstein D, Butler H, Cherry JM, Davis AP, Dolinski K, Dwight SS, Eppig JT, et al. (2000) Gene ontology: Tool for the unification of biology. The gene ontology consortium. Nat Genet 25: 25–29. 10.1038/75556 - DOI - PMC - PubMed
    1. Bayley R, Blakemore D, Cancian L, Dumon S, Volpe G, Ward C, Almaghrabi R, Gujar J, Reeve N, Raghavan M, et al. (2018) MYBL2 supports DNA double strand break repair in hematopoietic stem cells. Cancer Res 78: 5767–5779. 10.1158/0008-5472.CAN-18-0273 - DOI - PubMed
    1. Bereshchenko O, Mancini E, Moore S, Bilbao D, Mansson R, Luc S, Grover A, Jacobsen SE, Bryder D, Nerlov C (2009) Hematopoietic stem cell expansion precedes the generation of committed myeloid leukemia-initiating cells in C/EBPalpha mutant AML. Cancer Cell 16: 390–400. 10.1016/j.ccr.2009.09.036 - DOI - PubMed
    1. Bernard O, Li M, Reid HH (1991) Expression of two different forms of fibroblast growth factor receptor 1 in different mouse tissues and cell lines. Proc Natl Acad Sci U S A 88: 7625–7629. 10.1073/pnas.88.17.7625 - DOI - PMC - PubMed
    1. Bogni A, Cheng C, Liu W, Yang W, Pfeffer J, Mukatira S, French D, Downing JR, Pui CH, Relling MV (2006) Genome-wide approach to identify risk factors for therapy-related myeloid leukemia. Leukemia 20: 239–246. 10.1038/sj.leu.2404059 - DOI - PubMed

Publication types