. 2019 May 1;29(5):2261-2278.
doi: 10.1093/cercor/bhz038.

No Evidence that Predictions and Attention Modulate the First Feedforward Sweep of Cortical Information Processing

Affiliations

No Evidence that Predictions and Attention Modulate the First Feedforward Sweep of Cortical Information Processing

Josipa Alilović et al. Cereb Cortex. .

Abstract

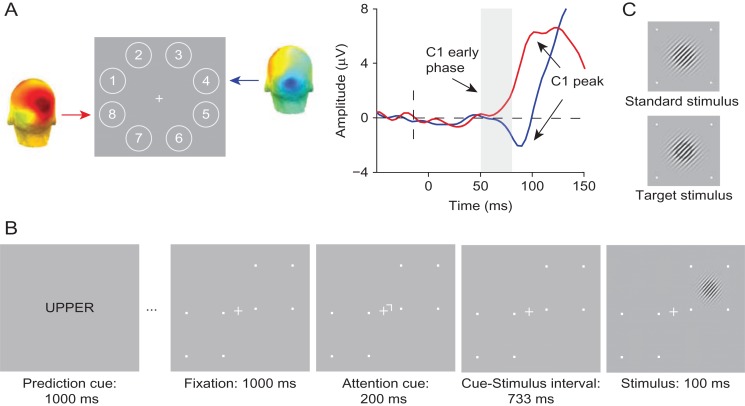
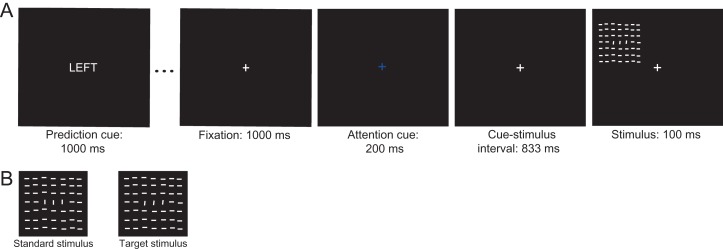
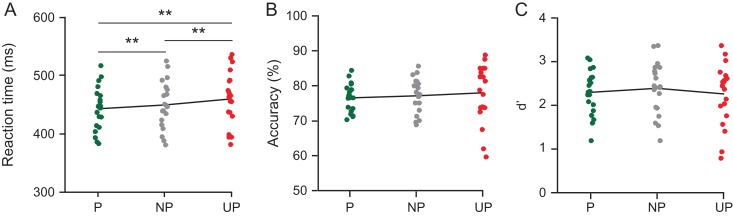
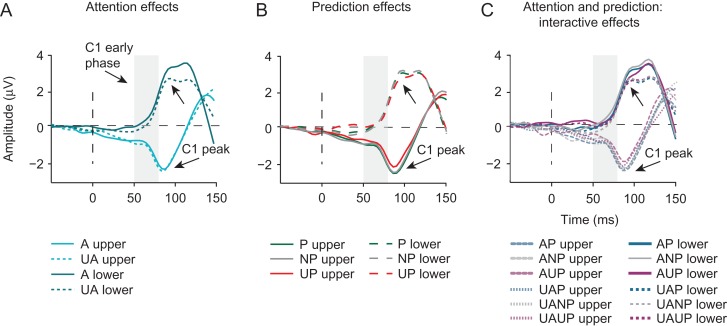
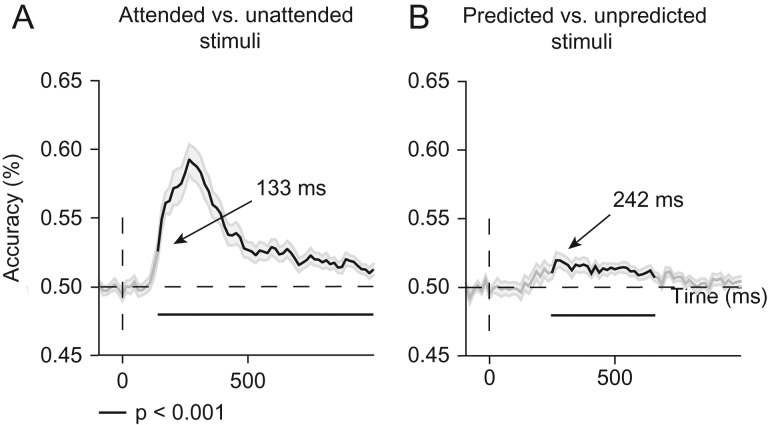
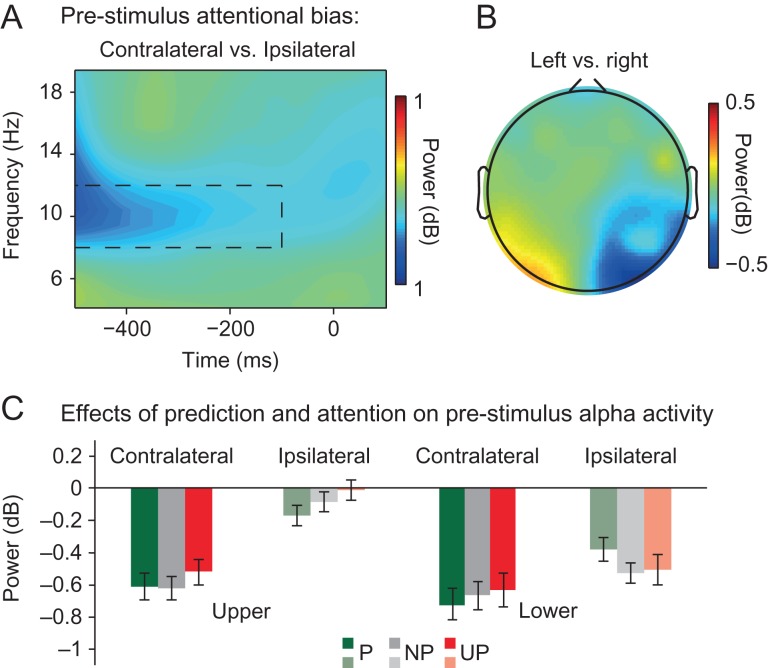
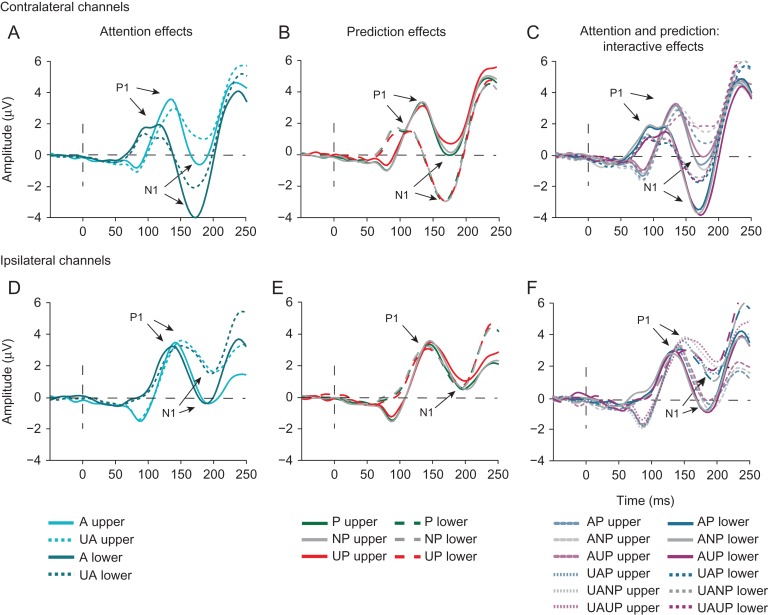
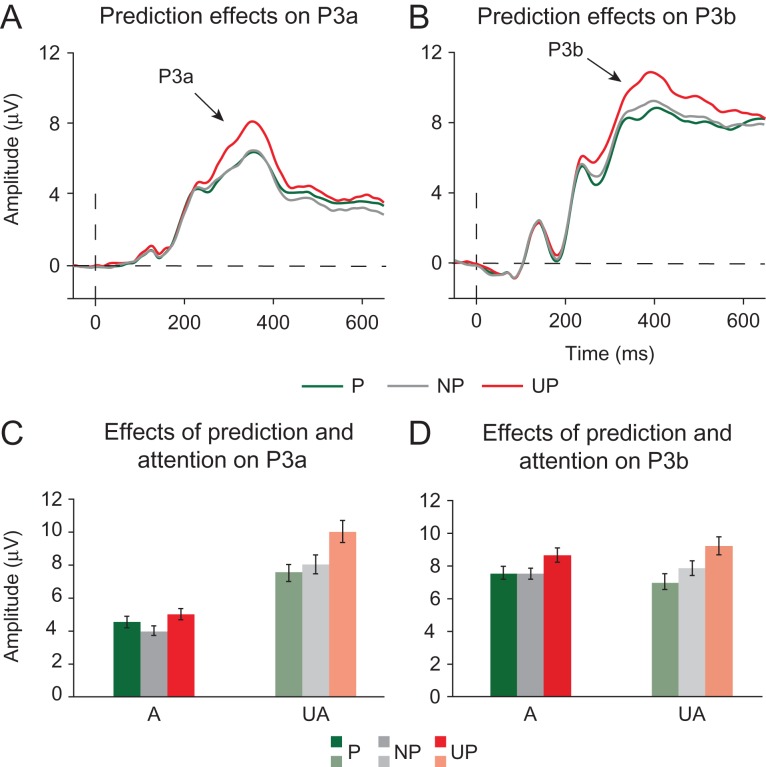
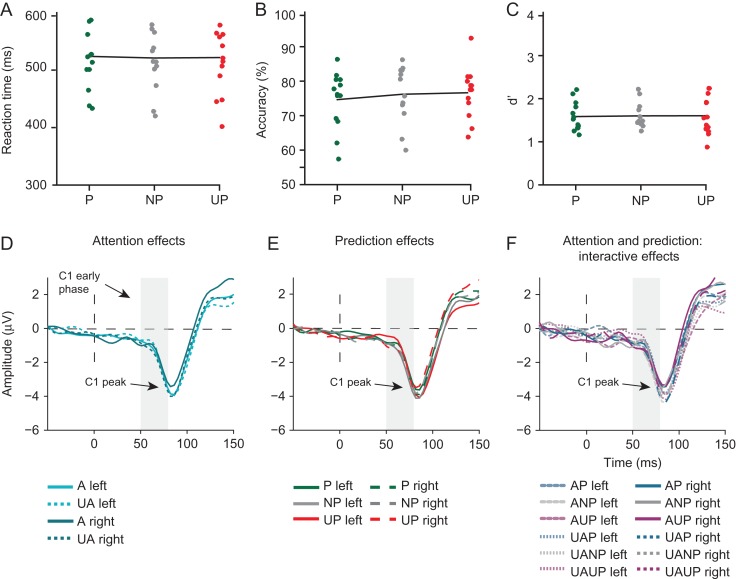
Predictive coding models propose that predictions (stimulus likelihood) reduce sensory signals as early as primary visual cortex (V1), and that attention (stimulus relevance) can modulate these effects. Indeed, both prediction and attention have been shown to modulate V1 activity, albeit with fMRI, which has low temporal resolution. This leaves it unclear whether these effects reflect a modulation of the first feedforward sweep of visual information processing and/or later, feedback-related activity. In two experiments, we used electroencephalography and orthogonally manipulated spatial predictions and attention to address this issue. Although clear top-down biases were found, as reflected in pre-stimulus alpha-band activity, we found no evidence for top-down effects on the earliest visual cortical processing stage (<80 ms post-stimulus), as indexed by the amplitude of the C1 event-related potential component and multivariate pattern analyses. These findings indicate that initial visual afferent activity may be impenetrable to top-down influences by spatial prediction and attention.

Keywords: first feedforward; human electrophysiology; prediction; spatial attention; sweep.


Figures

Figure 1.
Figure 1.
Experimental tasks and stimuli of Experiment 1. (A) In the probe session, stimuli were presented at eight locations around fixation to determine two diagonally opposite locations at which stimuli elicited a robust C1 for a given individual (numbers only shown for display purposes). For a representative subject, shown are the corresponding C1 topographies for an upper location (Location 4) and a lower location (Location 8) averaged over the 50–80 ms post-stimulus period. On the right, the corresponding ERP waveforms are shown. As depicted in the figure, stimuli presented at the upper location elicited a C1 of negative polarity (blue line), whereas stimuli presented at lower location elicited a C1 of positive polarity (red line). (B) The spatial cuing task used in the experimental sessions. Each block of the task started with a prediction cue (the word “UPPER”, “LOWER”, or “NEUTRAL”), which signaled the likely location of a stimulus in the upcoming block of 20 trials with 75% (upper or lower cue) or 50% (neutral cue) validity. In each trial, a spatial cue instructed participants to covertly direct their attention to the cued location, which was followed after a fixed delay, by a stimulus, a Gabor patch, at either the cued (attended), or the non-cued (unattended) location. Participants were asked to press a left mouse button if they detected a target, which could only appear at the cued location. Target stimuli appeared on 25% trials and were Gabor patches with a black ring superimposed. The trial sequence shown above is an example of a trial in which a non-target stimulus appears at the location that is both more likely (predicted) and relevant (attended). (C) Standard and target stimuli used in Experiment 1.
Figure 2.
Figure 2.
Experimental tasks and stimuli of Experiment 2. (A) Example of a trial of the spatial cueing task. Each block of 20 trials started with the presentation of a prediction cue (the word “LEFT”, “RIGHT”, or “NEUTRAL”) signaling the likelihood that a stimulus would occur at the upper left or right location in that block. Each trial started with the presentation of an attention-directing cue, which instructed participants to covertly direct their attention to the cued location (centrally presented fixation cross in red or blue signaling right or left location, respectively). After a fixed interval, the cue was followed by a stimulus, a texture stimulus, at the cued or uncued location. Participants had to press the left mouse button in case of a target stimulus at the cued location. The depicted sequence shows an example of a predicted attended trial in which a target stimulus is presented at the more likely and relevant location. (B) Target stimuli appeared on 25% of trials and were texture stimuli with the foreground region (three vertically-oriented lines in the center of a stimulus) tilted towards the left or right with respect to the foreground region. On a standard stimulus, the foreground region formed a 90° degrees angle with respect to the background lines.
Figure 3.
Figure 3.
Effects of prediction on behavioral performance in Experiment 1. (A) Speed of responses decreased linearly with increasing stimulus predictability: Participants responded significantly faster to predicted than to non-predicted and unpredicted stimuli, as well as to non-predicted compared with unpredicted stimuli (**P < 0.01), confirming that our prediction manipulation was successful. Prediction did not significantly influence accuracy (B) or d′ (C).
Figure 4.
Figure 4.
Effects of prediction and attention on the first feedforward sweep of cortical information processing. Shown are grand-average ERPs measured at individually determined C1 peak electrodes, separately for upper and lower visual field stimuli and locked to stimulus onset. (A) Attention (collapsed across prediction conditions), did not modulate the early phase of the C1. The C1 peak, slightly later in time, was significantly larger for attended (A) versus unattended (UA) stimuli, but only for stimuli presented in the lower-field, likely reflecting overlap from the P1 attention effect at lateral posterior scalp regions. (B) Prediction (collapsed across attention conditions) also did not modulate the early phase of the C1 (50–80 ms post-stimulus), but did influence the amplitude of the C1 peak. Specifically, the C1 peak in the unpredicted (UP) condition was significantly lower in amplitude than the C1 peak in the non-predicted (NP) and predicted (P) conditions. This is contrary to what one would expect based on predictive processing accounts that postulate that unpredicted stimuli should elicit greater sensory activity (i.e., prediction errors). Moreover, this finding was not supported by Bayesian analyses, which provided stronger evidence for the hypothesis that prediction does not modulate C1 peak amplitude. (C) Attention and prediction in interaction did not modulate the early phase of the C1 or its peak amplitude.
Figure 5.
Figure 5.
Effects of attention and prediction on the sharpness of stimulus location representations. (A) Classification accuracy for attended versus unattended stimuli collapsed across upper and lower locations and prediction conditions. Attention modulated patterns of neural activity between 130 and 990 ms post-stimulus (black lines mark two-tailed cluster P < 0.001 after 1000 iterations). (B) Classification accuracy for predicted versus unpredicted stimuli collapsed across upper and lower locations and attention conditions. Predictions modulated neural activity patterns between 242 and 650 ms (black lines mark two-tailed cluster P < 0.001 after 1000 iterations). Shaded areas on both figures are ±SEM. These multivariate findings corroborate the univariate ERP findings, as they do not reveal any effects of attention and prediction before 80 ms.
Figure 6.
Figure 6.
Effects of top-down attention and prediction on pre-stimulus alpha power. (A) Shown are differences in average power values across time as a function of frequency at electrodes contralateral vs. ipsilateral to the cued (attended) stimulus location (PO3/7 and PO4/8). Attention (collapsed over prediction conditions and upper and lower locations) was associated with reduced pre-stimulus (−500 to −100 ms) alpha power (8–12 Hz) (marked by the black dashed rectangle) over contra- compared with ipsilateral posterior scalp regions. (B) The scalp distribution of pre-stimulus alpha power in a −500 to −100 ms window over posterior sites as a function of cue direction: left versus right (collapsed over upper and lower locations). As can be seen, spatial attention was associated with a lateralization of pre-stimulus alpha activity over lateral posterior scalp regions. (C) Prediction modulated the effect of attention on pre-stimulus alpha lateralization (i.e., the magnitude of pre-stimulus alpha power at electrodes contralateral versus ipsilateral to the attended stimulus location (PO3/7 and PO4/8)), but only when locations in the lower-field were attended. Specifically, alpha power was only higher over ipsilateral than over sites contralateral to predicted lower-field locations.
Figure 7.
Figure 7.
Effects of attention and prediction on later stages of visual information processing indexed by the P1 and N1 ERP components. (A, D) Attention was also associated with a larger contralateral P1 and bilateral N1. (B, E) Predictions did not modulate P1 and N1 amplitudes. (C, F) Prediction did marginally modulate the N1 peak in interaction with attention.
Figure 8.
Figure 8.
Effects of attention and prediction on post-perceptual stages of information processing as indexed by the P3a and P3b components. (A) Prediction modulated the size of the P3a novelty response (~300–400 ms post-stimulus) in the expected way: the P3a was higher to unpredicted (UP) compared with predicted (P) and non-predicted (NP) stimuli. (B) Prediction also modulated the size of the P3b component (~340–440 ms post-stimulus), such that the amplitude of the P3b was inversely related to the stimulus probability. (C) Post-perceptual effects of prediction also depended on attention. The P3a response was highest to unpredicted stimuli at both attended and unattended locations. (D) The amplitude of the P3b response scaled inversely with stimulus predictability at attended and unattended locations. The largest P3b response was again observed to unpredicted stimuli, however, non-predicted stimuli elicited a smaller P3b than predicted stimuli.
Figure 9.
Figure 9.
Effects of attention and prediction on behavioral performance and the C1 in Experiment 2. There was no behavioral benefit of stimulus predictability on reaction times (C), accuracy (D) or d’ (E). (F) Attention did not modulate C1 amplitude (neither in the early time window, nor at the peak). (G) Prediction also did not modulate the C1 (neither in the early time window nor at the peak). (H) Prediction and attention in interaction did not modulate the amplitude of the C1 (neither in the early time window nor at the peak). A: attended; UA: unattended; P: predicted; NP: non-predicted; UP: unpredicted.

References

    1. Alink A, Schwiedrzik CM, Kohler A, Singer W, Muckli L. 2010. Stimulus predictability reduces responses in primary visual cortex. J Neurosci. 30(8):2960–2966. 10.1523/JNEUROSCI.3730-10.2010. - DOI - PMC - PubMed
    1. Arnal LH, Giraud AL. 2012. Cortical oscillations and sensory predictions. Trends Cogn Sci. 16(7):390–398. 10.1016/j.tics.2012.05.003. - DOI - PubMed
    1. Auksztulewicz R, Friston KJ, Nobre AC. 2017. Task relevance modulates the behavioural and neural effects of sensory predictions. PLoS Biol. 15(12):1–27. 10.1371/journal.pbio.2003143. - DOI - PMC - PubMed
    1. Bastos AM, Usrey WM, Adams RA, Mangun GR, Fries P, Friston KJ. 2012. Canonical microcircuits for predictive coding. Neuron. 76(4):695–711. 10.1016/j.neuron.2012.10.038. - DOI - PMC - PubMed
    1. Bauer M, Stenner M-P, Friston KJ, Dolan RJ. 2014. Attentional modulation of alpha/beta and gamma oscillations reflect functionally distinct processes. J Neurosci. 34(48):16117–16125. 10.1523/JNEUROSCI.3474-13.2014. - DOI - PMC - PubMed

Publication types