

Association Between Earliest Amyloid Uptake and Functional Connectivity in Cognitively Unimpaired Elderly
- PMID: 30877785
- PMCID: PMC6458901
- DOI: 10.1093/cercor/bhz020
Association Between Earliest Amyloid Uptake and Functional Connectivity in Cognitively Unimpaired Elderly
Abstract
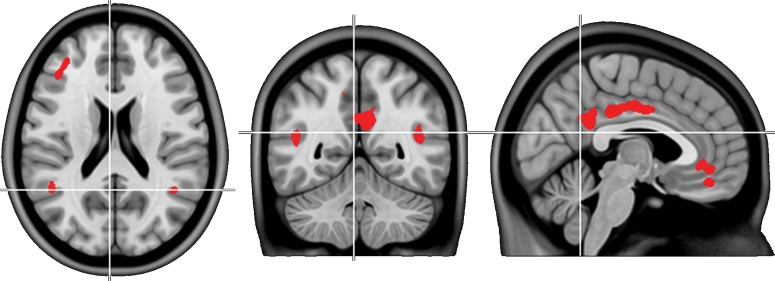
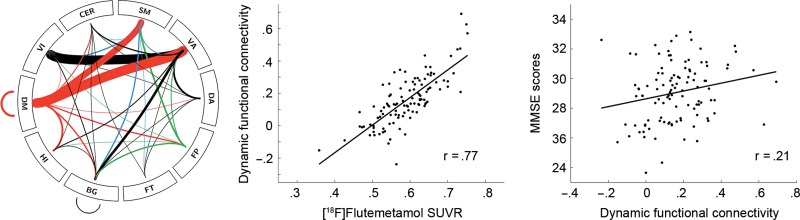
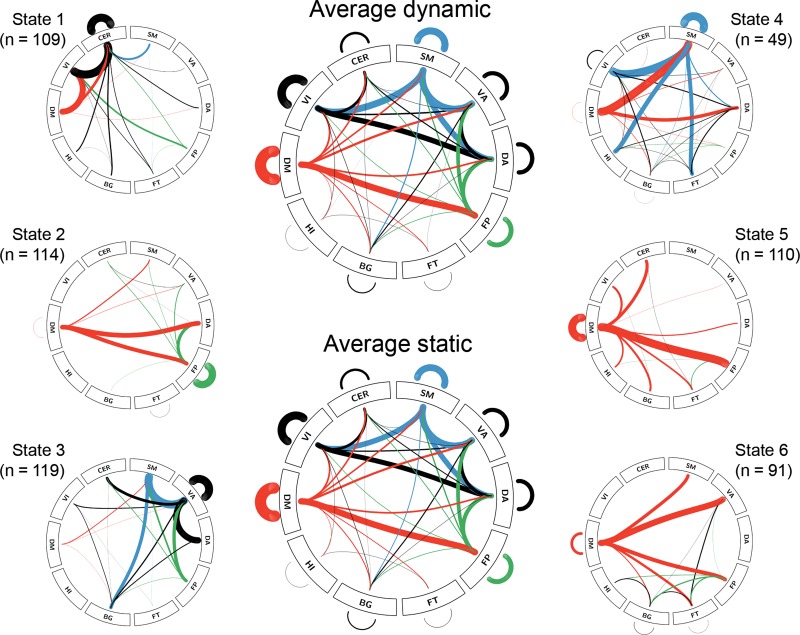
Alterations in cognitive performance have been noted in nondemented subjects with elevated accumulation of amyloid-β (Aβ) fibrils. However, it is not yet understood whether brain function is already influenced by Aβ deposition during the very earliest stages of the disease. We therefore investigated associations between [18F]Flutemetamol PET, resting-state functional connectivity, gray and white matter structure and cognitive performance in 133 cognitively normal elderly that exhibited normal global Aβ PET levels. [18F]Flutemetamol uptake in regions known to accumulate Aβ fibrils early in preclinical AD (i.e., mainly certain parts of the default-mode network) was positively associated with dynamic but not static functional connectivity (r = 0.77). Dynamic functional connectivity was further related to better cognitive performance (r = 0.21-0.72). No significant associations were found for Aβ uptake with gray matter volume or white matter diffusivity. The findings demonstrate that the earliest accumulation of Aβ fibrils is associated with increased functional connectivity, which occurs before any structural alterations. The enhanced functional connectivity may reflect a compensatory mechanism to maintain high cognitive performance in the presence of increasing amyloid accumulation during the earliest phases of AD.
Keywords: Alzheimer’s disease; [18 f]flutemetamol; dynamic connectivity; resting-state fMRI.
© The Author(s) 2019. Published by Oxford University Press.
Figures
Similar articles
-
GABA and glutamate moderate beta-amyloid related functional connectivity in cognitively unimpaired old-aged adults.Neuroimage Clin. 2019;22:101776. doi: 10.1016/j.nicl.2019.101776. Epub 2019 Mar 12. Neuroimage Clin. 2019. PMID: 30927605 Free PMC article.
-
Amyloid burden accelerates white matter degradation in cognitively normal elderly individuals.Hum Brain Mapp. 2019 May;40(7):2065-2075. doi: 10.1002/hbm.24507. Epub 2019 Jan 3. Hum Brain Mapp. 2019. PMID: 30604903 Free PMC article.
-
Reductions in the white-gray functional connectome in preclinical Alzheimer's disease and their associations with amyloid and cognition.Alzheimers Dement. 2024 Dec;20(12):8317-8330. doi: 10.1002/alz.14334. Epub 2024 Oct 23. Alzheimers Dement. 2024. PMID: 39439365 Free PMC article.
-
A review of the default mode network in aging and dementia based on molecular imaging.Rev Neurosci. 2012 Feb 28;23(3):263-8. doi: 10.1515/revneuro-2012-0029. Rev Neurosci. 2012. PMID: 22752783 Review.
-
A Systematic Review of the Association between Amyloid-β and τ Pathology with Functional Connectivity Alterations in the Alzheimer Dementia Spectrum Utilizing PET Scan and rsfMRI.Dement Geriatr Cogn Dis Extra. 2021 May 6;11(2):78-90. doi: 10.1159/000516164. eCollection 2021 May-Aug. Dement Geriatr Cogn Dis Extra. 2021. PMID: 34178011 Free PMC article.
Cited by
-
The fractional amplitude of low-frequency fluctuations signals related to amyloid uptake in high-risk populations-A pilot fMRI study.Front Aging Neurosci. 2022 Jul 29;14:956222. doi: 10.3389/fnagi.2022.956222. eCollection 2022. Front Aging Neurosci. 2022. PMID: 35966783 Free PMC article.
-
Genetic, vascular and amyloid components of cerebral blood flow in a preclinical population.J Cereb Blood Flow Metab. 2023 Oct;43(10):1726-1736. doi: 10.1177/0271678X231178993. Epub 2023 May 26. J Cereb Blood Flow Metab. 2023. PMID: 37231665 Free PMC article.
-
Disruption in functional networks mediated tau spreading in Alzheimer's disease.Brain Commun. 2024 Jun 13;6(4):fcae198. doi: 10.1093/braincomms/fcae198. eCollection 2024. Brain Commun. 2024. PMID: 38978728 Free PMC article.
-
GABA and glutamate moderate beta-amyloid related functional connectivity in cognitively unimpaired old-aged adults.Neuroimage Clin. 2019;22:101776. doi: 10.1016/j.nicl.2019.101776. Epub 2019 Mar 12. Neuroimage Clin. 2019. PMID: 30927605 Free PMC article.
-
The Azalea Hypothesis of Alzheimer Disease: A Functional Iron Deficiency Promotes Neurodegeneration.Neuroscientist. 2024 Oct;30(5):525-544. doi: 10.1177/10738584231191743. Epub 2023 Aug 20. Neuroscientist. 2024. PMID: 37599439 Free PMC article. Review.
References
-
- Amieva H, Mokri H, Le Goff M, Meillon C, Jacqmin-Gadda H, Foubert-Samier A, Orgogozo JM, Stern Y, Dartigues JF. 2014. Compensatory mechanisms in higher-educated subjects with Alzheimer’s disease: a study of 20 years of cognitive decline. Brain. 137:1167–1175. - PubMed
Publication types
MeSH terms
Substances
LinkOut - more resources
Full Text Sources
