. 2019 Dec 17;29(12):4982-5008.
doi: 10.1093/cercor/bhz039.

Premotor Cortex Provides a Substrate for the Temporal Transformation of Information During the Planning of Gait Modifications

Affiliations

Premotor Cortex Provides a Substrate for the Temporal Transformation of Information During the Planning of Gait Modifications

Toshi Nakajima et al. Cereb Cortex. .

Abstract

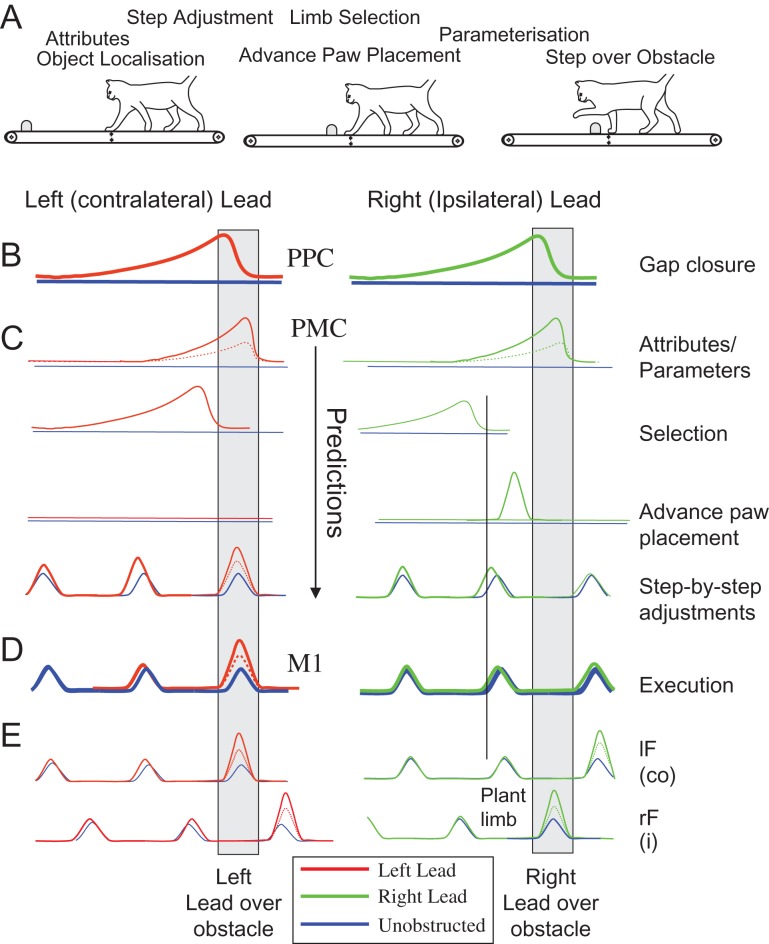
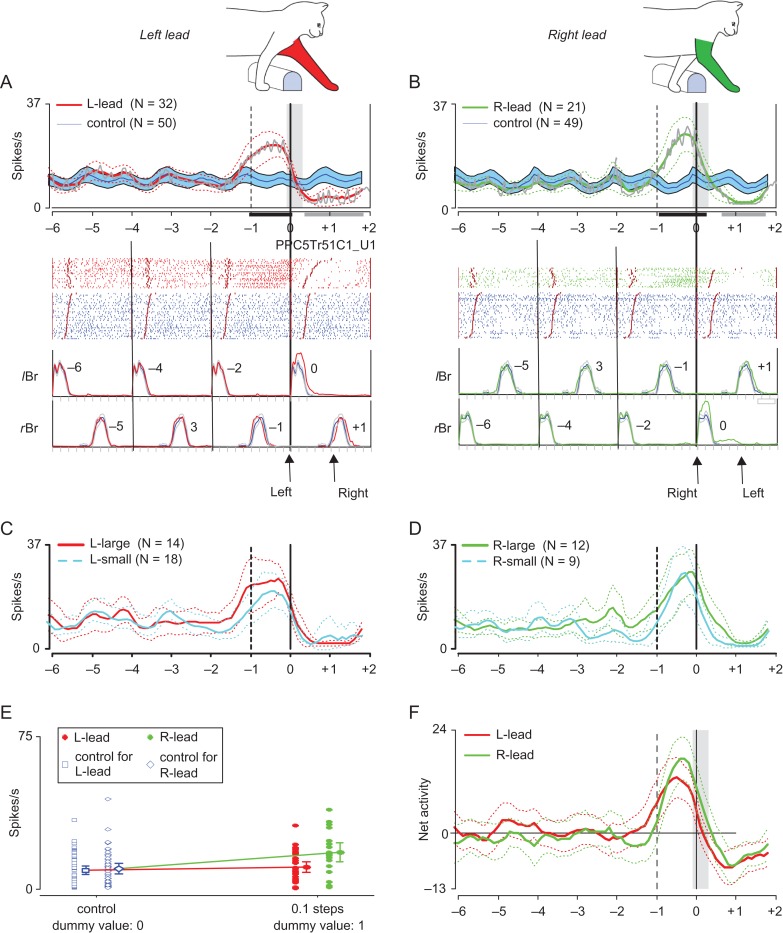
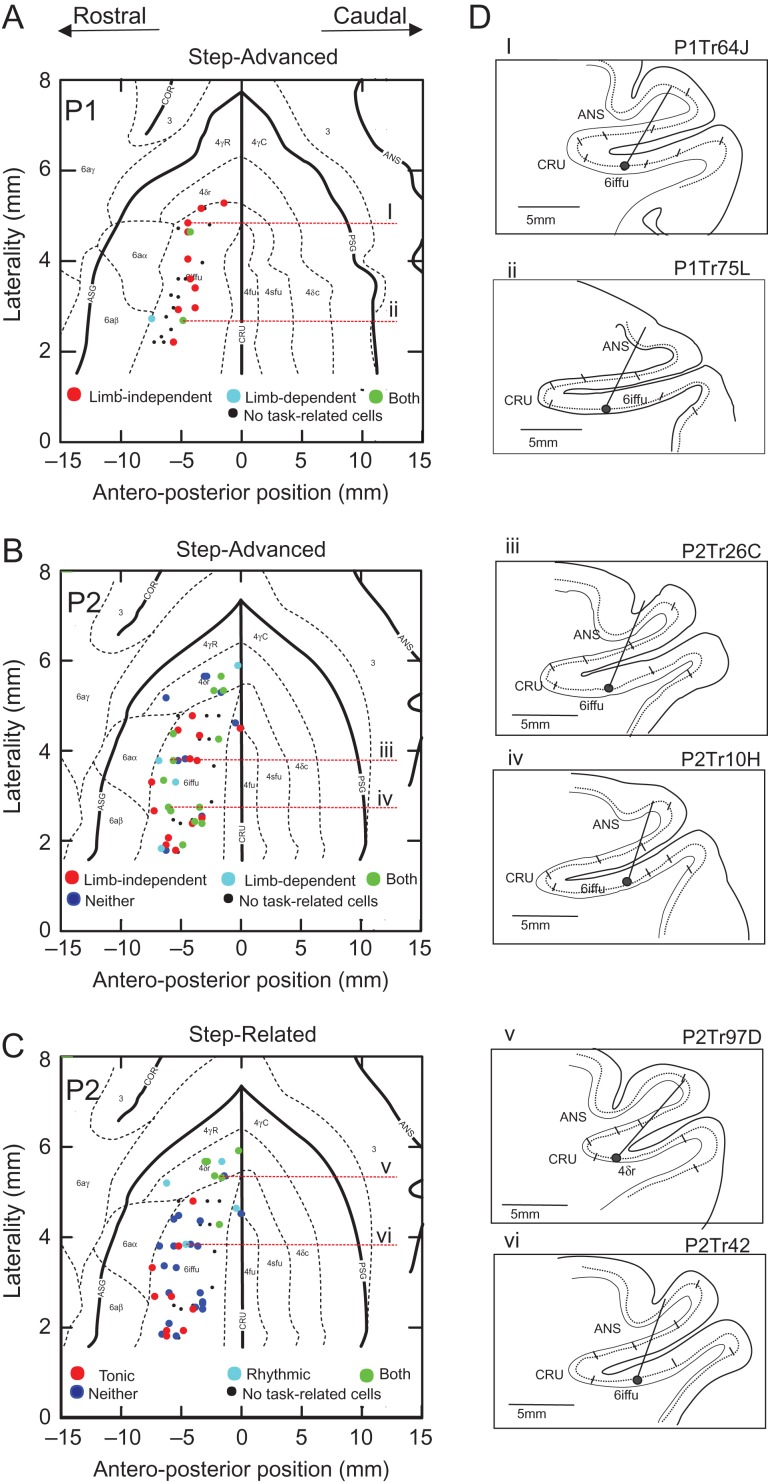
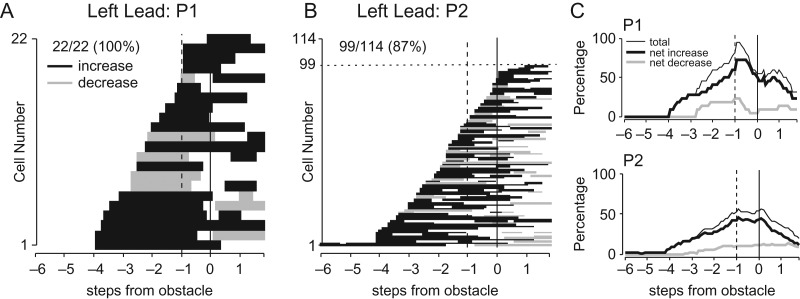
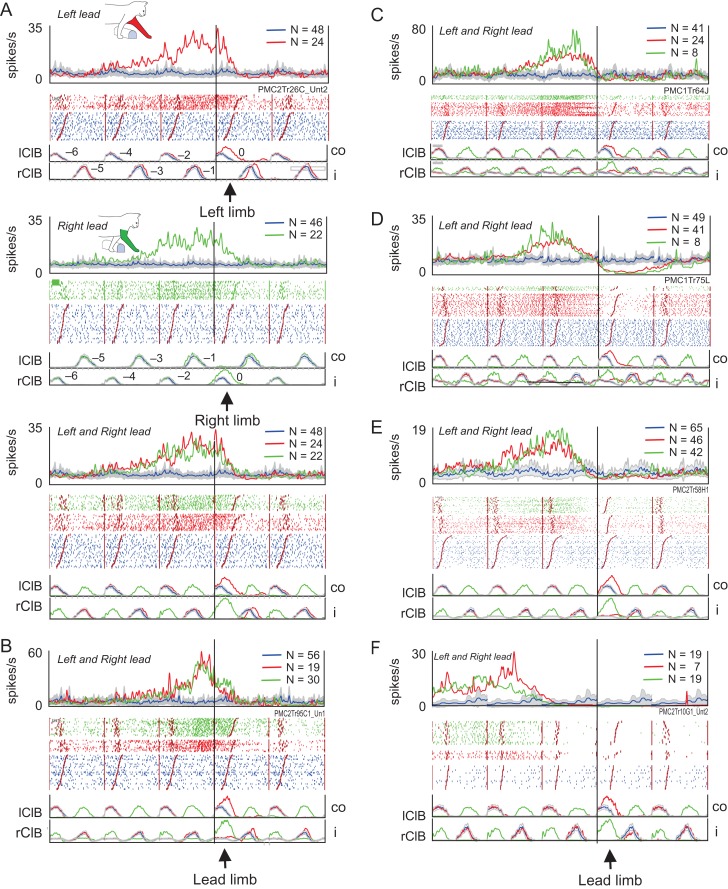
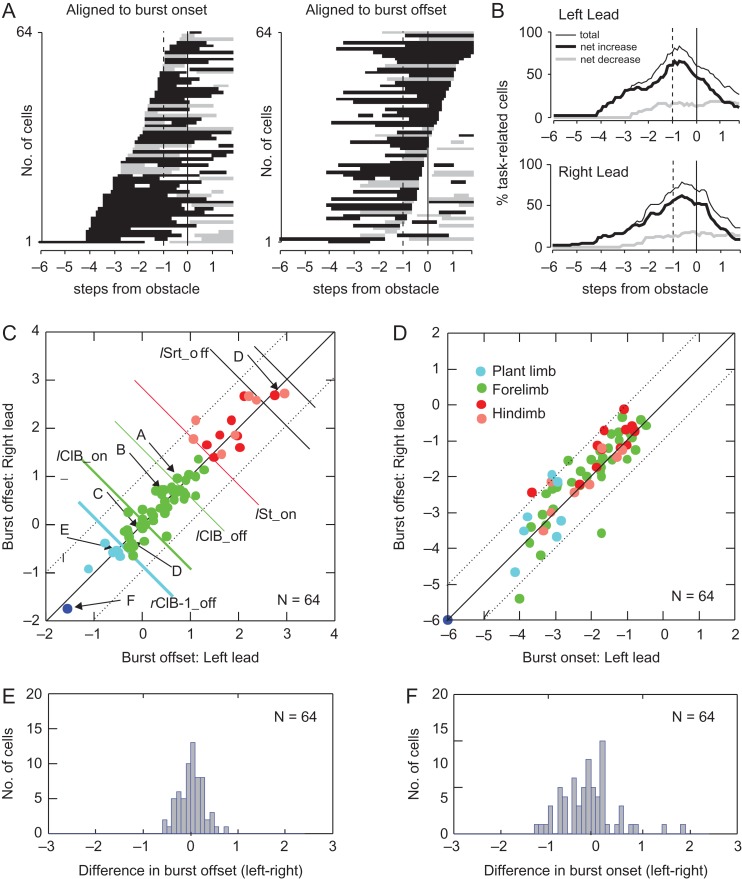
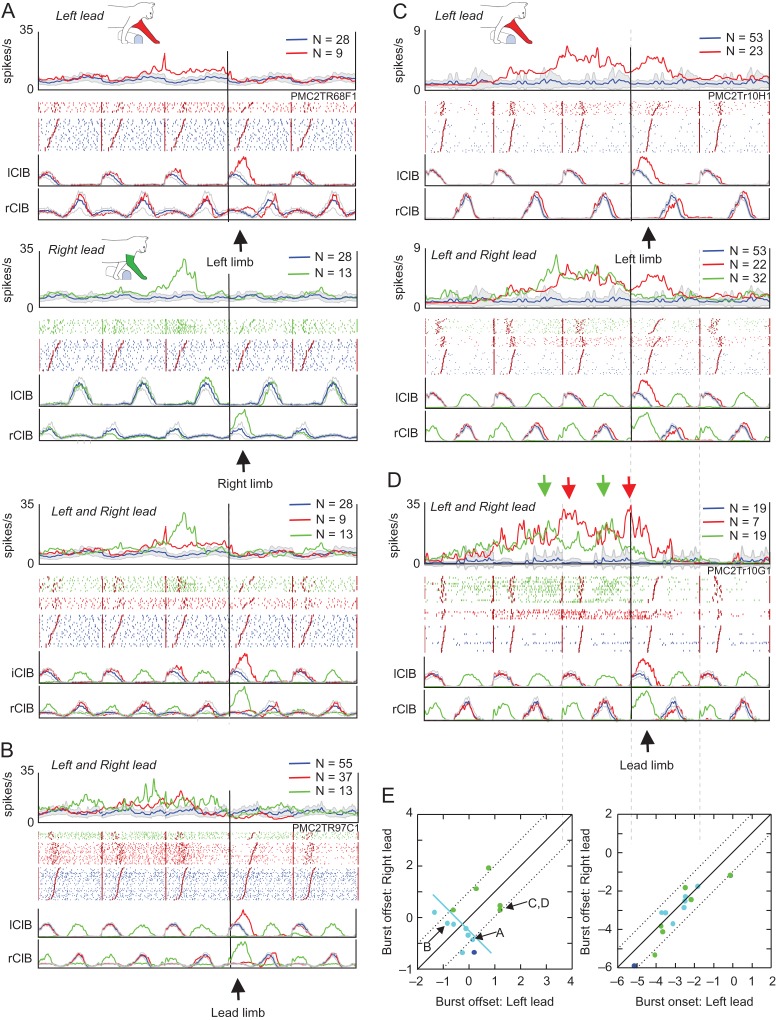
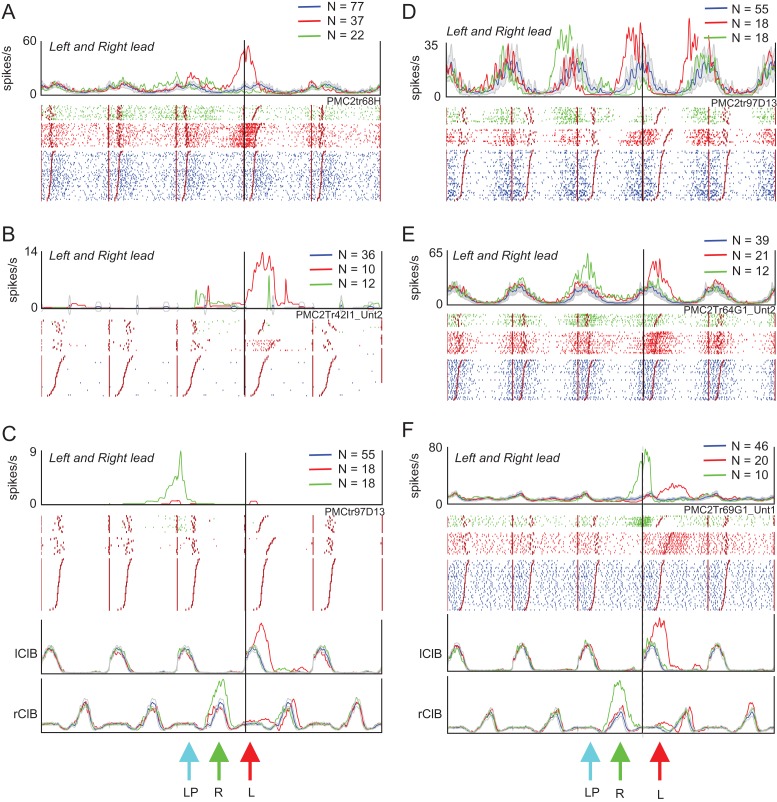
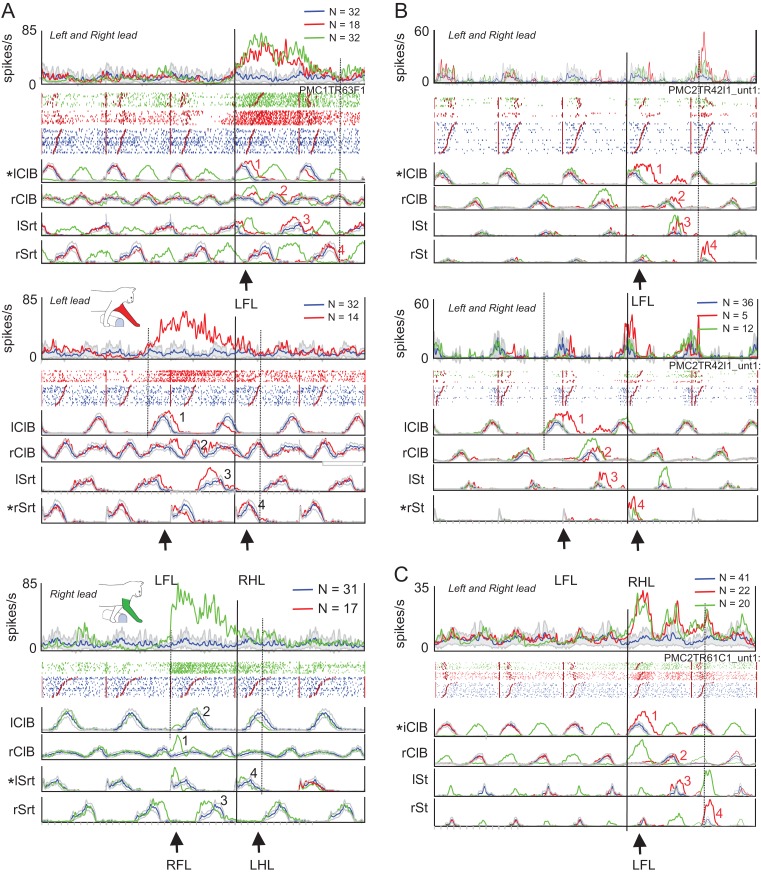
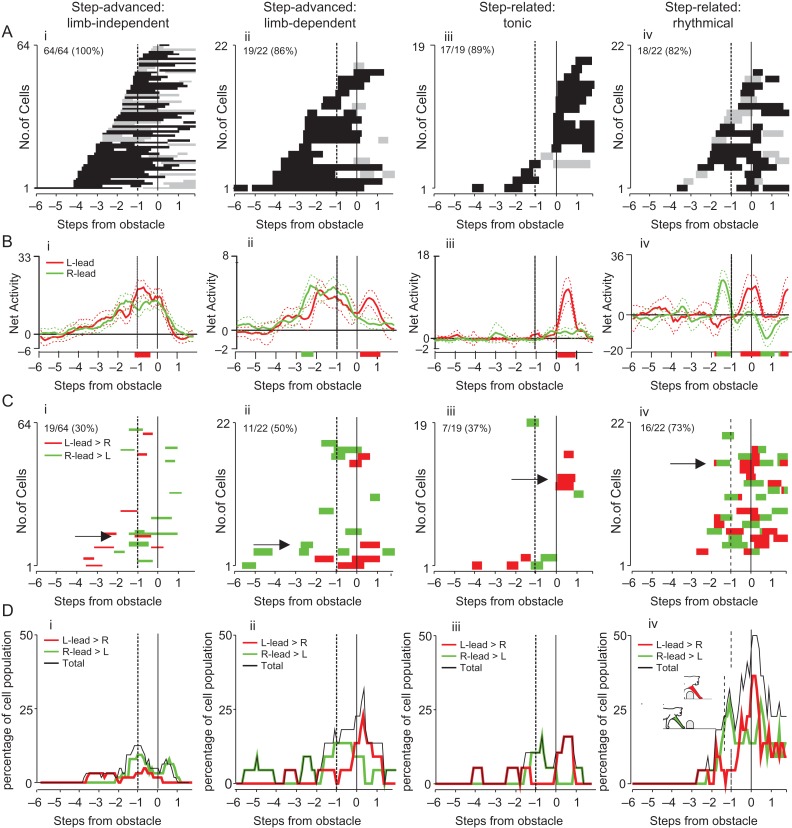
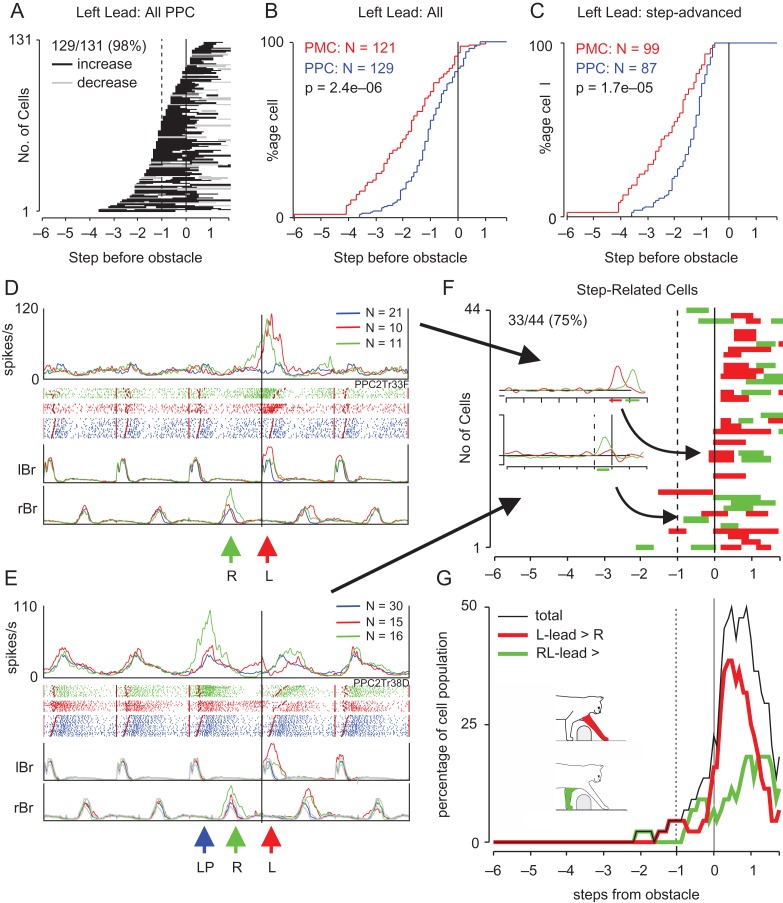
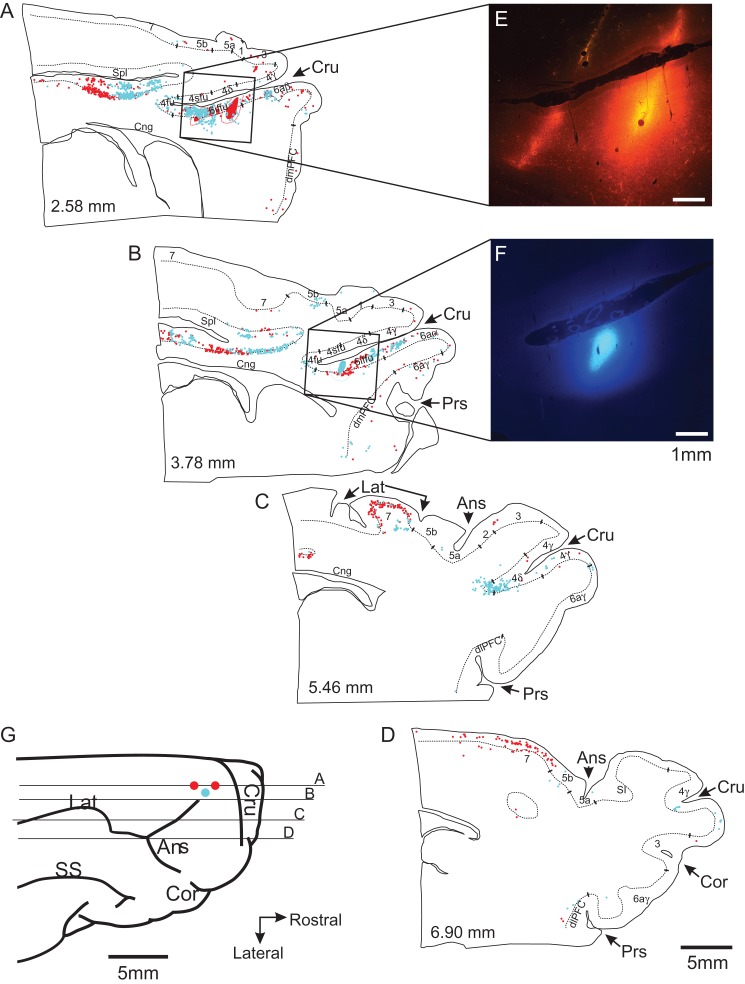
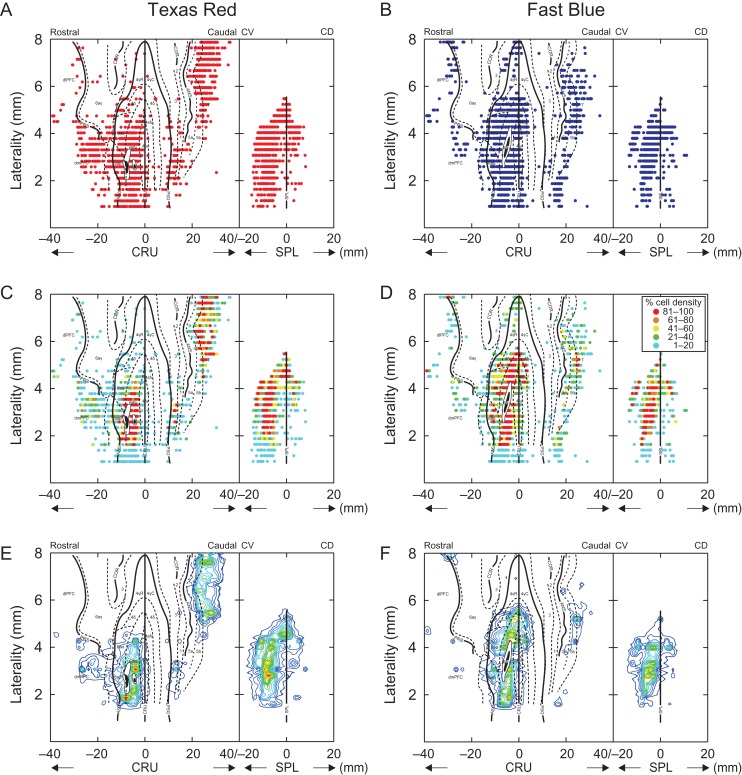
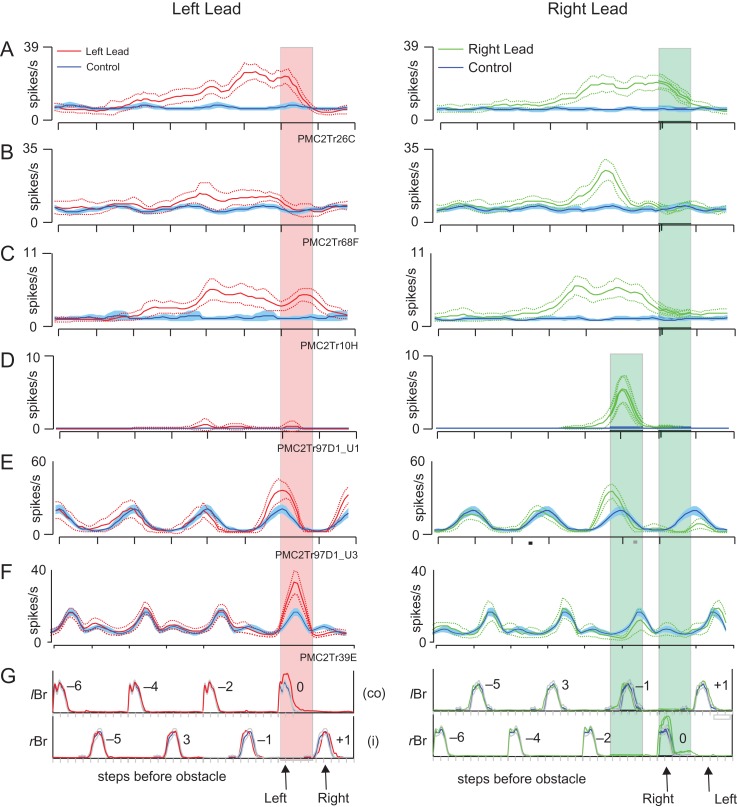
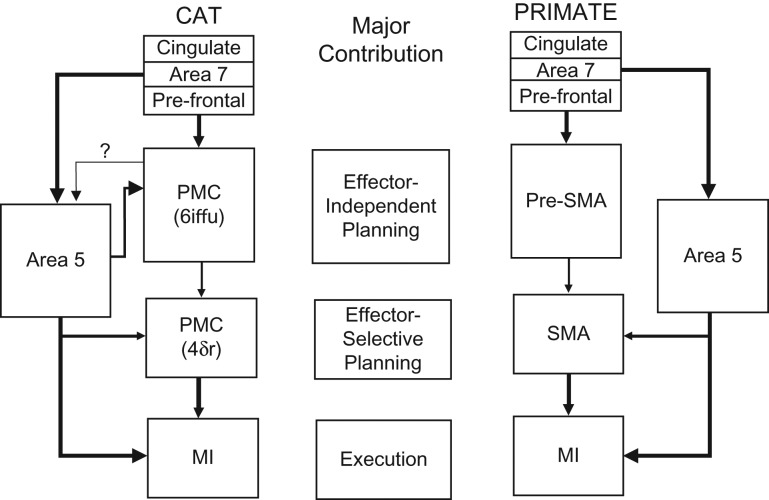
We tested the hypothesis that the premotor cortex (PMC) in the cat contributes to the planning and execution of visually guided gait modifications. We analyzed single unit activity from 136 cells localized within layer V of cytoarchitectonic areas 6iffu and that part of 4δ within the ventral bank of the cruciate sulcus while cats walked on a treadmill and stepped over an obstacle that advanced toward them. We found a rich variety of discharge patterns, ranging from limb-independent cells that discharged several steps in front of the obstacle to step-related cells that discharged either during steps over the obstacle or in the steps leading up to that step. We propose that this population of task-related cells within this region of the PMC contributes to the temporal evolution of a planning process that transforms global information of the presence of an obstacle into the precise spatio-temporal limb adjustment required to negotiate that obstacle.

Keywords: cat; locomotion; single neuron recording; visually guided gait modification; voluntary movement.


Figures

Figure 1.
Figure 1.
A theoretical framework for planning and executing visually guided gait modifications. (A) The processes involved in planning a step over a moving obstacle range from identifying the obstacle and its location to the execution of the step over the obstacle by the lead limb (adapted from Marigold et al. 2011). Only the planning processes for the initial step by the forelimb are illustrated. The staggered representation of the stages involved in the planning process represents the likelihood that both parallel and serial planning of the different processes is involved. (BD) Cartoons of representative cell discharge patterns for different cortical regions when either the left limb, contralateral to the recording site (“left" panel), or the right limb (“right” panel) is the first to step over an obstacle. B and D show, respectively, typical patterns of activity recorded from the posterior parietal cortex (PPC) and the motor cortex (M1) in previous experiments (see references in Introduction). (C) Predictions of the neuronal discharge patterns that we would expect to record from the premotor cortex (PMC) if it is involved in different aspects of the transformation of information about obstacle location (provided by the PPC) to the motor activity required to execute the step over the obstacle (produced from M1). Such cells include those implicated in: selection of the lead limb; determination of the limb trajectory and EMG patterns (parameters) required to negotiate the obstacle; step-by-step adjustments of the gait during approach to the obstacle; and determination of the location and timing of the placement of the plant limb. In the latter case, cell activity will be related to the placement of the left limb in front of the obstacle preceding the step over the obstacle by the right limb. (E) Electromyographic (EMG) activity from the left and right forelimb flexor muscles (lF and rF, respectively) corresponding, respectively, to the contralateral (co) and ipsilateral (i) limbs with respect to the recording site. Note that in this, and in all other figures, blue traces represent unobstructed locomotion, red traces indicate the left-lead condition and green traces indicate the right-lead condition. Dotted lines represent a change in activity related to a smaller obstacle (parameterization).
Figure 2.
Figure 2.
Method for quantitative analysis of cell discharge. (A and B) “Top,” Peri-event histograms (PEHs) as calculated according to Udo’s method (gray traces, see text) (Udo et al. 1982) or from moving window averages (colored traces). Moving window averages (see text) show mean discharge frequency together with the confidence interval (CI = 0.05) of the standard error of the mean (SE) for the left-lead (red trace in A) and right-lead (green trace in B) conditions for the step over the obstacle and for 3 step cycles (6 steps) prior to that step and 1 step cycle (2 steps) after. These data are superimposed on the averaged activity during control steps (blue traces), displayed together with the interval of confidence (P < 0.05: filled blue area). Note that for the control traces (blue traces), neuronal activity during each unobstructed step cycle is considered to be identical and cell activity from the fourth step cycle before the step over the obstacle is repeated in each illustrated step cycle (see text). Windows where activity was significantly different from control (P < 0.05) are indicated with small, horizontally oriented, bars under the PEHs (black bars indicate increased activity; gray bars, decreased activity). “Bottom”: Raster plots of discharge activity together with the mean rectified EMG in the left and right brachialis (lBr and rBr, respectively). Numbers on the EMG traces indicate steps prior to or following the step over the obstacle (identified as step 0). Data in A are synchronized to the onset of the lBr and those in B to the rBr. The vertical lines indicate the onset of step cycles (onset of Br) and the staggered lines indicate the end of the period of Br activity; activity is rank-ordered according to the duration of the flexor muscle activity in each trial. The long, thick, vertical line indicates the onset of the step over the obstacle. The shaded, vertically oriented, rectangle superimposed on the PEH in A and B is equal to 0.4 of a step (see text). (C and D) PEHs showing mean discharge frequency and CI in the left (C) and right (D) lead conditions during steps over the larger (C, red lines; D, green lines) and smaller (cyan lines) obstacle respectively. (E) Distributions of firing rates for the analysis window indicated in A and B (vertical shaded bar) for the left-lead (filled red circles) and right-lead (filled green circles) conditions, and those for the matched windows in control steps (small blue squares and diamonds). The means and 95% confidence intervals for each condition and control are indicated with the larger symbol and error bars beside the small symbols. Given that the dummy value for the control is 0 and that for the steps over the obstacle is 1, the slopes of the lines correspond to the net activity in left-lead (red) and right-lead (green) conditions. (F) Net activity (discharge activity during left or right-lead condition—discharge activity in the unobstructed condition) in left-lead (red) and right-lead (green) conditions, together with 95% CI.
Figure 3.
Figure 3.
Histological reconstruction. (AC) Location of all penetrations (circles) in P1 (A) and P2 (B, C) plotted on flattened representations of the pericruciate cortex and aligned to the fundus of the cruciate sulcus (0 mm). Thick black lines indicate the borders and fundi of sulci; small dotted lines differentiate cytoarchitectonic regions. (A and B) Cells classified as step-advanced in P1 and P2; (C) cells classified as step-related (P2). Legends at the foot of AC indicate the different classes of cells illustrated in each figure. (D) Examples of individual penetrations into the ventral bank of the pericruciate cortex traced from the para-sagittal histological sections. The penetrations illustrate the location of the recordings from cells illustrated in Figures 5, 7, 8, and 9 (see identification code above each illustration). The dotted line indicates layer V. Illustrated trajectories are indicated on the flattened representations by red, horizontal, dotted lines. Small ticks differentiate different cytoarchitectural boundaries with area 6iffu, or 4δr, being identified in each figurine. Abbreviations: Ans, fundus of the ansate sulcus; Cor, fundus of the coronal sulcus; Cru, fundus of the cruciate sulcus; dlPFC, dorsolateral prefrontal cortex; PrS, fundus of the presylvian sulcus; 3, cytoarchitectonic area 3; 4δc, 4δr, 4γ, 4fu, 4sfu, different cytoarchitectonic sub-areas of cytoarchitectonic area 4; 6aα, 6aβ, 6aγ, 6iffu, different sub-areas of cytoarchitectonic area 6.
Figure 4.
Figure 4.
Periods of task-related activity. (A) The period of significantly modified activity for all 22 task-related cells recorded in cat P1, as calculated during the left-lead condition. Values on the x-axis indicate steps prior, or subsequent, to the step over the obstacle (step 0) as indicated in Figure 2A. Black bars indicate facilitation and gray bars, suppression. Cells are rank-ordered according to the time of the earliest significant change in activity. (B) Similar plot for all 114 cells recorded in P2 for the left-lead condition. Note that several neurons (cells 100–114) did not show task-related activity in the left-lead condition. (C) Percentage of cells that showed facilitation and suppression of their discharge during the approach to, and the step over, the obstacle in the 2 cats. Solid vertical line, step over obstacle by the left limb; dotted vertical line at −1, step preceding the step over the obstacle (by the plant limb).
Figure 5.
Figure 5.
Examples of step-advanced, limb-independent cells. (A) Limb-independent cell in which the change in cell discharge began several steps before the obstacle and continued during the step over the obstacle. “Top panel”: Averaged activity in left-lead condition synchronized to lClB. “Middle panel”: Activity in right-lead condition synchronized to rClB. “Bottom panel”: Superimposition of the left- and right-lead conditions, illustrating the limb-independent nature of the discharge. In each panel, we illustrate, from top to bottom, the averaged and filtered cell activity, the raster of the cell activity and the averaged EMG activity from the lClB and rClB. Red traces indicate activity in the left-lead condition, green traces in the right-lead condition and blue traces during unobstructed locomotion. Numbers on the EMG traces indicate steps prior to the step over the obstacle (step 0). (BF) Additional examples, synchronized to the respective lead limb during the left- and right-lead conditions (see text). All cells recorded from area 6iffu. Solid vertical line indicates the onset of the step over the obstacle by the lead limb in all cases. Abbreviations: co, contralateral (left) limb; i, ipsilateral (right) limb; N, number of trials.
Figure 6.
Figure 6.
Timing relationships of limb-independent cells. (A) Period of task-related activity of all 64 step-advanced, limb-independent cells (P1 and P2) aligned with respect to the onset (“left”) or to the offset of the initial period of discharge (“right”) for the left-lead condition. In cells in which there were 2 periods of discharge preceding the step over the obstacle (N = 2), we used the second of the 2 bursts for the alignment on the offset of activity. (B) Percentage of cells showing significantly increased (thicker black line) or significantly decreased (gray line) activity during left and right lead. (C) Phase relationship of the time of offset of cell activity in the right-lead condition as a function of that during the left-lead condition. Offsets and onsets are calculated as percentage of a step cycle but are expressed as steps (step cycle *2). Diagonal lines indicate the line of equivalence and deviation from that line by 1 step. Arrows and the letters AF indicate the cells illustrated in Figure 5. Green colored circles indicate cells in which discharge ended just before, during or after the step over the obstacle (as in Fig. 5AD); cyan symbols indicate cells ceasing activity ~1 step prior to the step over the obstacle (e.g., during the plant limb, Fig. 5E) and the blue circle indicates the cell ceasing activity 1 step cycle prior to the step over the obstacle (Fig. 5F). Red and salmon-colored symbols indicate cells that discharged until the passage of the hindlimbs over the obstacle. Red circles indicate cells with a monotonic change in activity while the salmon-colored symbols indicate cells with an initial period of activity prior to the passage of the forelimb (as in Fig. 5D). (D) Similar plot for the phase of onset of the task-related activity. (E and F) Histograms showing the difference in timing between the left- and right-lead conditions for the end (E) and onset (F) of the period of the task-related activity. Abbreviations: lClB_off, offset of activity in the lClB during left lead; lClB_on, onset of activity (phase=0.0); rClB-1_off, offset of activity in the rClB in the step before the step over the obstacle; lSrt_off, end of period of activity in the sartorius as the left hindlimb steps over the obstacle; lSt_on, onset of activity in the semitendinosus as the left hindlimb steps over the obstacle.
Figure 7.
Figure 7.
Examples of step-advanced, limb-dependent cells. (A) Example of a cell in which task-related activity during the left-lead condition (“top panel”) ceased at the onset of the step over the obstacle. In contrast, during the right-lead condition (“middle panel”), the change in cell activity ceased during the period of activity of the left, contralateral, limb, prior to the step over the obstacle by the right limb. “Bottom panel”: the activity in the left- and the right-lead condition is superimposed. Organization of figure similar to that in Figure 5. (BD) 3 other examples of cells (see text). Downward-oriented arrows in D emphasize peaks of activity in left-lead (red arrows) and right-lead (green arrows) conditions. Cells A and B recorded in area 4δr and C and D in area 6iffu. (E) Timing relationships of those limb-dependent cells that showed task-related activity in both conditions, organized as in Figure 6C,D. “Left panel”: Offset of the task-related activity; “right panel”: onset of task-related activity. Cyan circles, cells discharging with respect to the plant limb in 1 condition (as in A, B); green circles, cells that discharged until or during the step over the obstacle in both conditions (as in C, D). The blue circle represents a cell that discharged with respect to the passage of the left forelimb in the left-lead condition but to the end of the preceding step in the right-lead condition. Line perpendicular to the line of equivalence indicates the offset of activity in the rClB-1 (as in Fig. 6C), corresponding to the placement of the plant limb in front of the obstacle.
Figure 8.
Figure 8.
Examples of step-related cells. (A and B) 2 examples of cells that showed task-related discharge activity only during the step over the obstacle in the left-lead condition (red traces). During unobstructed locomotion (blue traces), the cells were either weakly modulated (A) or inactive (B). (C) Cell that discharged only during the left plant step before the step over the obstacle by the right forelimb in the right-lead condition (green traces). (D and E) 2 strongly rhythmically active cells in which discharge activity was increased during the step over the obstacle with the left limb in the left-lead condition (red trace) but in the step before the step over the obstacle by the right limb in the right-lead condition (green trace) (i.e., as in part C). Cell D was recorded simultaneously with cell C. (F) Cell that discharged in the period between the passage of the left and the right forelimb in the left-lead condition but in the period between the passage of the right and left forelimb in the right-lead condition. Activity in all plots is synchronized to the onset of activity in the lClB in both the left- and right-lead conditions. Arrows, ‘L’ and ‘R’, indicate the step over the obstacle in the left- and the right-lead condition, respectively; ‘LP’ indicates the placing of the left, contralateral, limb (plant limb) during the right-lead condition. Cells in A and CF recorded in area 4δr, cell B recorded in area 6iffu.
Figure 9.
Figure 9.
Hindlimb-related activity. (A) “Top panel”: Example of a cell that modified its discharge prior to the step over the obstacle by the lead forelimb and then showed a prolonged period of increased discharge during the subsequent step over the obstacle by the hindlimb. Data are shown superimposed for left- and right-lead conditions and are synchronized to the onset of activity in the lead forelimb. Vertical dotted line indicates the end of the passage of the 4 limbs over the obstacle. “Middle panel”: Activity in left-lead condition with cell activity synchronized to the onset of the right, ipsilateral, sartorius (rSrt), a flexor of the hip active during the swing phase of the hindlimb. “Bottom panel”: Activity in the right-lead condition with cell activity synchronized to the onset of the lSrt. First vertical dotted line in the “middle and bottom” panels indicates the onset of activity in the lead forelimb. The second vertical dotted line indicates the end of the passage of the hindlimbs over the obstacle. Numbers (1–4) indicate the order of the passage of the 4 limbs during the steps over the obstacle in all 3 panels. (B) Cell that showed step-related activity during the passage of the right hindlimb over the obstacle. Top panel: Left-lead condition, data synchronized to the lClB. Bottom panel: Left-lead condition, data synchronized to the right semitendinosus (rSt), a flexor of the knee active at the onset of hindlimb swing. (C) Cell that showed multiple periods of task-related activity, starting with the passage of the left forelimb over the obstacle and continuing until passage of the right hindlimb. Data aligned on activity in the lClB. Asterisks in AC indicate the muscle used to synchronize the averages. All cells recorded in area 6iffu. Abbreviations: LFL, left forelimb; LHL, left hindlimb; RHL right hindlimb.
Figure 10.
Figure 10.
Condition-selectivity. (A) Rank-ordered task-related activity in the left-lead condition for the 4 major populations of cells (i–iv) that we categorized in this study. (Ai repeated from Fig. 6A). (B) Examples of condition-selective changes in net activity in 4 representative cells during left and right lead as indicated in Methods and Figure 2F. Each example represents a previously illustrated cell: Bi taken from Figure 5A; Bii from Figure 7C; Biii from Figure 8B; Biv from Figure 8D. Red and green horizontal bars below the traces indicate periods in which the traces showed significant differences (condition-selectivity) between the net activity in the left- and right-lead conditions. Red bars indicate periods in which net activity was significantly greater in the left-lead condition and green bars periods in which net activity was significantly greater in the right-lead condition. (C) Periods of significantly different net activity for all cells in each group. Arrows indicate the cells illustrated in B. (D) Percentage of cells in each group showing significant condition-selectivity at different times during the task. Solid vertical line indicates the step over the obstacle by the lead limb; dotted vertical line indicates the step preceding the step over the obstacle, corresponding to the placement of the plant limb in front of the advancing obstacle. Cell discharge in A is aligned to the activity of the lBr/ClB; activity in BD is aligned to the onset of the activity in the lead Br/ClB.
Figure 11.
Figure 11.
Comparison with PPC cells. (A) The period of activity of all 129 cells recorded from the PPC that showed task-related activity for the left-lead condition taken from 2 previous databases (Andujar et al., 2010; Marigold and Drew 2017) and plotted as in Figure 4. (B and C) Cumulative histograms for all cells recorded from the PMC and the PPC (B) and for only those cells defined as step-advanced (C). Probability values (P) indicate the results of the Kolmogorov–Smirnov test for distribution (see text). (D and E) 2 cells recorded from the PPC demonstrating discharge related to the activity in the contralateral limb. Cell discharge is synchronized to the activity of the lBr for both the left- and right-lead conditions, as for Figure 8. (F and G) Condition-selectivity for the step-related PPC cells, displayed as in Figure 10C,D. The inset in Figure 11F illustrates the net activity of the cells shown in Figure 11D,E for the left- and right-lead conditions, but aligned now to the activity in the lead Br. In this display, the increase in net activity during the right-lead condition for the cell in D occurs relatively later than that during the left-lead condition (because the left limb trails the right limb). For the cell in E, the increase in net activity in the right-lead condition (green trace) arrives 1 step before the step over the obstacle with the right limb; i.e., it maintains the relationship between LP and R shown in Figure 11E.
Figure 12.
Figure 12.
Cortical projections to area 6iffu. (AD) 4 representative parasagittal sections of the pericruciate cortex showing the location of retrogradely labeled cells following injections of Texas Red (red circles) and Fast Blue (blue circles) into area 6iffu. Each circle represents the presence of at least 1 cell in each 200 μm bin (see Methods). Colored ovoids on sections A,B indicate the site of injections and the red and blue dotted lines indicate exclusion zones in which no cells were counted as they overlapped the injection sites. Square boxes indicate the region shown in the photomicrographs of E,F. (E and F) Photomicrographs showing the injection sites of Texas Red and Fast Blue in area 6iffu of the cruciate sulcus. (G) Drawing of the dorsal surface of the brain from the cat used in this experiment showing the location from which sections AD were taken.
Figure 13.
Figure 13.
Summary of density of retrogradely labeled cells. (A and B) All cells labeled in the pericruciate cortex and the surrounding regions following the injections of Texas Red and Fast Blue illustrated in Figure 12. Each circle represents the presence of at least one cell in a 200 μm bin. Data are illustrated in 2 panels. In the left panel, data are aligned with the fundus of the cruciate sulcus (Cru) while in the right panel they are aligned to the most rostral point of the splenial sulcus (Spl). Negative values in the left panel are ventral and rostral to Cru. Negative values for the cingulate cortex indicate cells that are caudal and ventral (CV) to Spl and positive values those that are caudal and dorsal (CD). (C and D) Cells are grouped according to the number of cells in each 200 μm bin with red indicating 81–100% of the mean +SD value (see Methods) and cyan, 1–20% (see key). (E and F) Contour plots illustrate the regions of highest density of labeling (red indicates the densest labeling and blue indicates the least); each contour represents a 5% increment in density.
Figure 14.
Figure 14.
Summary of discharge patterns in areas 6iffu and 4δr. (AE) Activity of selected cells recorded from the PMC during left- and right-lead conditions, left and right panels respectively, to demonstrate the major different classes of cells that we propose are involved in planning the step over the obstacle by the lead forelimb. Cell discharge patterns are illustrated as moving window averages (see Fig. 2 and Methods). (F) Selected cell recorded from area 4γ of cat P2 to show typical activity related only to the execution of the step over the obstacle by the contralateral limb. (G) EMG activity recorded from the Br. The red, vertical, bar in the left panel indicates the step over the obstacle by the lead, left, contralateral, limb. The second, longer green, vertical, bar in the right panel indicates the step over the obstacle by the lead, right, ipsilateral, limb. The shorter green, vertical, bar preceding this indicates the period in which the contralateral limb is placed on the support surface in the step preceding the step over the obstacle.
Figure 15.
Figure 15.
Schematic representation of some of the major connections between different structures in the cat and the primate. The figure emphasizes the inputs from the prefrontal, cingulate, and PPC (areas 5 and 7) to the different regions of the PMC discussed in this manuscript. (see text for further description and for references). Note that we have only shown the major connections referred to in the text.

Similar articles

Cited by

References

    1. Andujar J-E, Drew T. 2007. Organization of the projections from the posterior parietal cortex to the rostral and caudal motor cortex of the cat. J Comp Neurol. 504:17–41. - PubMed
    1. Andujar J-E, Lajoie K, Drew T. 2010. A contribution of area 5 of the posterior parietal cortex to the planning of visually guided locomotion: limb-specific and limb-independent effects. J Neurophysiol. 103:986–1006. - PubMed
    1. Aoki S, Sato Y, Yanagihara D. 2013. Lesion in the lateral cerebellum specifically produces overshooting of the toe trajectory in leading forelimb during obstacle avoidance in the rat. J Neurophysiol. 110:1511–1524. - PubMed
    1. Avendaño C, Rausell E, Perez-Aguilar D, Isorna S. 1988. Organization of the association cortical afferent connections of area 5: a retrograde tracer study in the cat. J Comp Neurol. 278:1–33. - PubMed
    1. Avendaño C, Isla AJ, Rausell E. 1992. Area 3a in the cat. II. Projections to the motor cortex and their relations to other corticocortical connections. J Comp Neurol. 321:373–386. - PubMed

Publication types