

The relationships between democratic experience, adult health, and cause-specific mortality in 170 countries between 1980 and 2016: an observational analysis
- PMID: 30878225
- PMCID: PMC6484695
- DOI: 10.1016/S0140-6736(19)30235-1
The relationships between democratic experience, adult health, and cause-specific mortality in 170 countries between 1980 and 2016: an observational analysis
Abstract
Background: Previous analyses of democracy and population health have focused on broad measures, such as life expectancy at birth and child and infant mortality, and have shown some contradictory results. We used a panel of data spanning 170 countries to assess the association between democracy and cause-specific mortality and explore the pathways connecting democratic rule to health gains.
Methods: We extracted cause-specific mortality and HIV-free life expectancy estimates from the Global Burden of Diseases, Injuries, and Risk Factors Study 2016 and information on regime type from the Varieties of Democracy project. These data cover 170 countries and 46 years. From the Financing Global Health database, we extracted gross domestic product (GDP) per capita, also covering 46 years, and Development Assistance for Health estimates starting from 1990 and domestic health spending estimates starting from 1995. We used a diverse set of empirical methods-synthetic control, within-country variance decomposition, structural equation models, and fixed-effects regression-which together provide a robust analysis of the association between democratisation and population health.
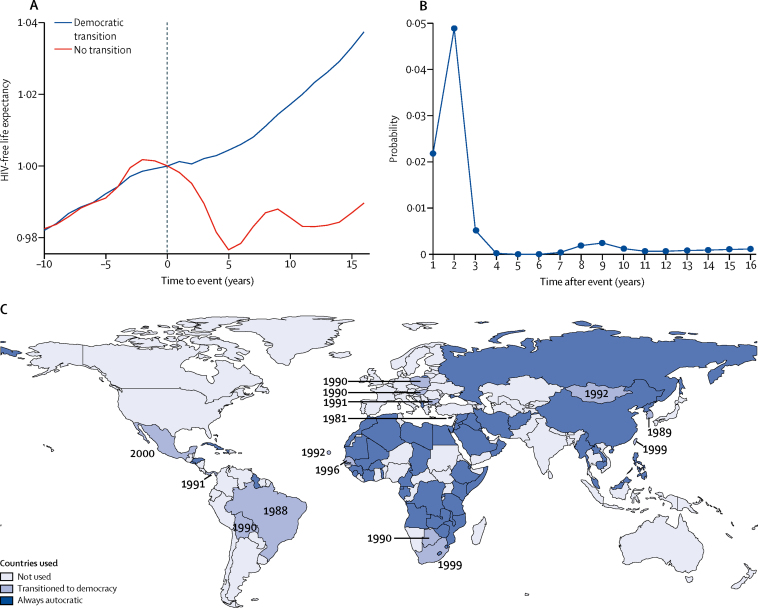
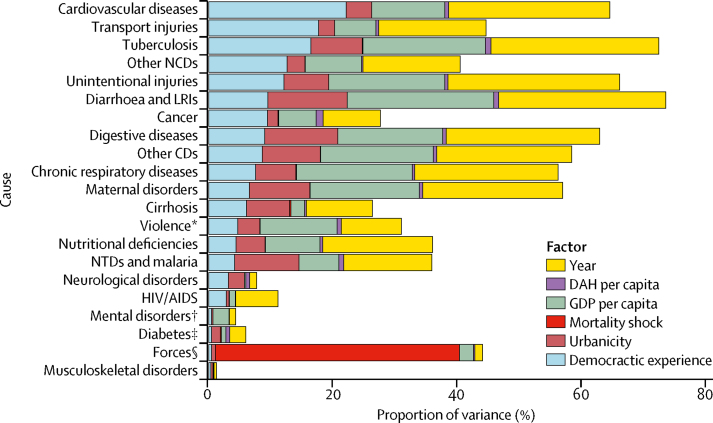
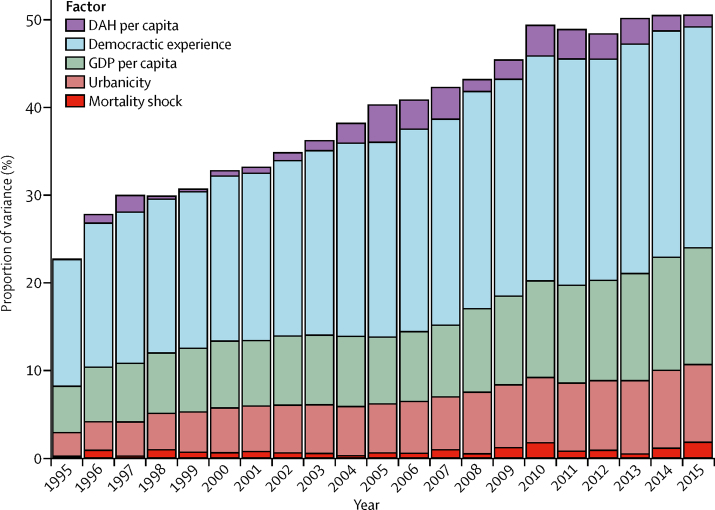
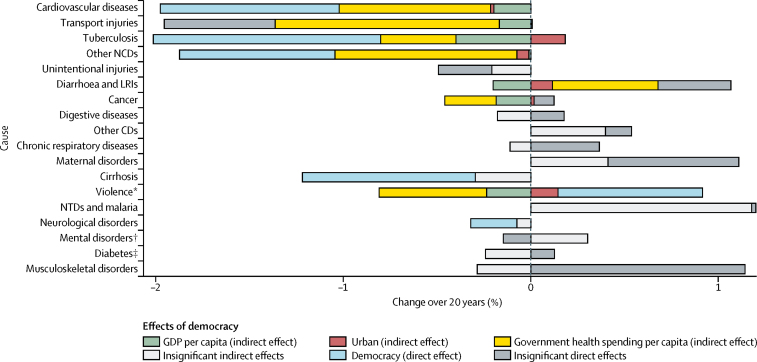
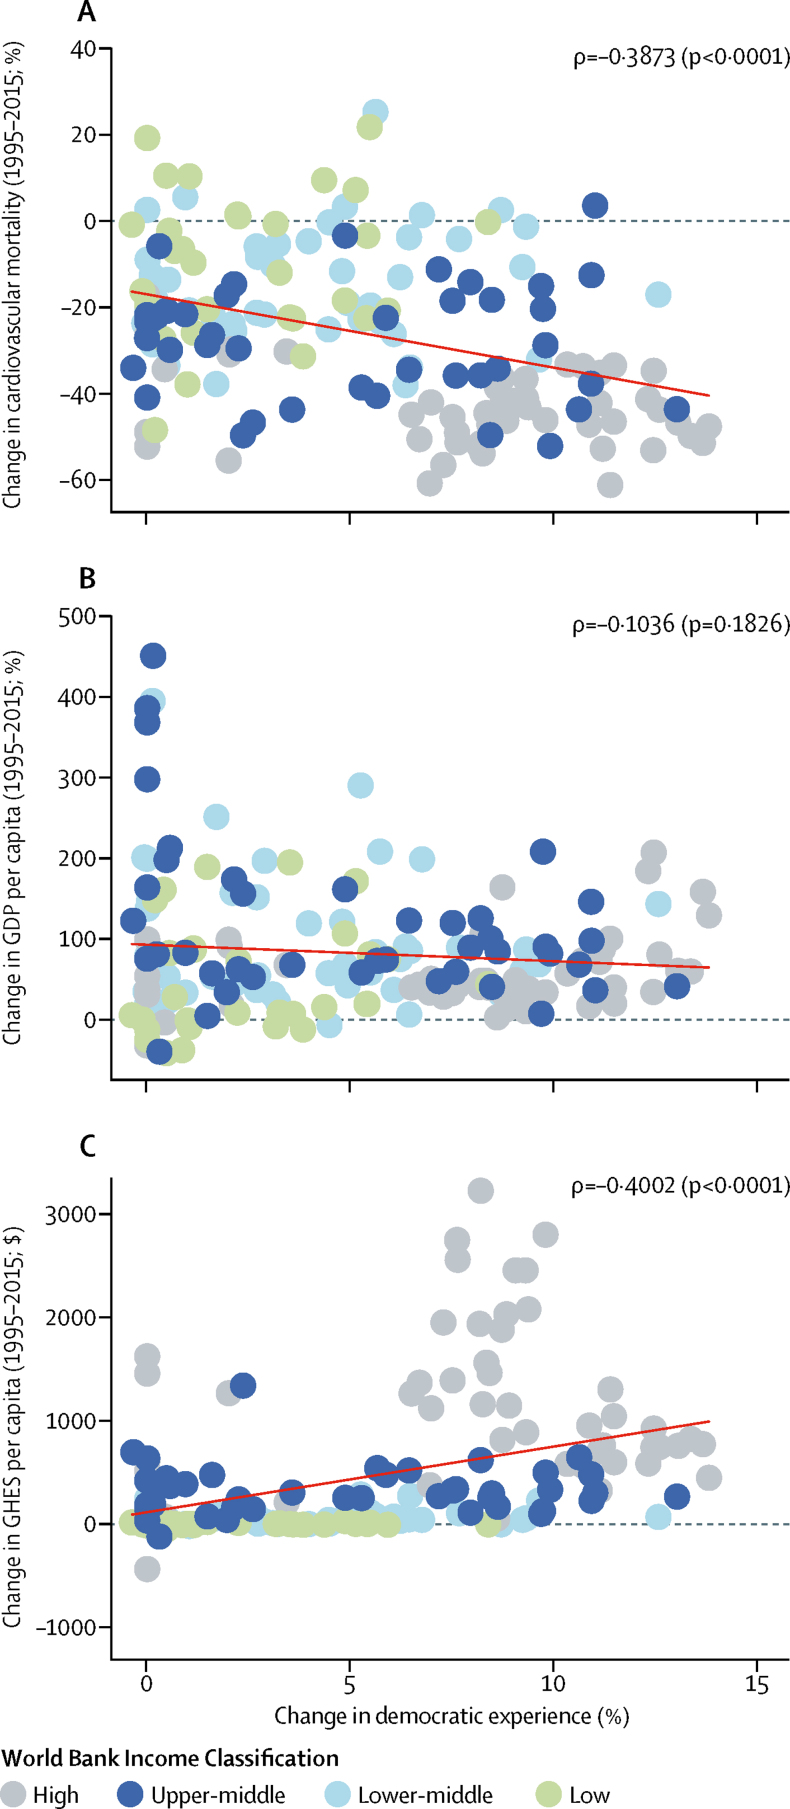
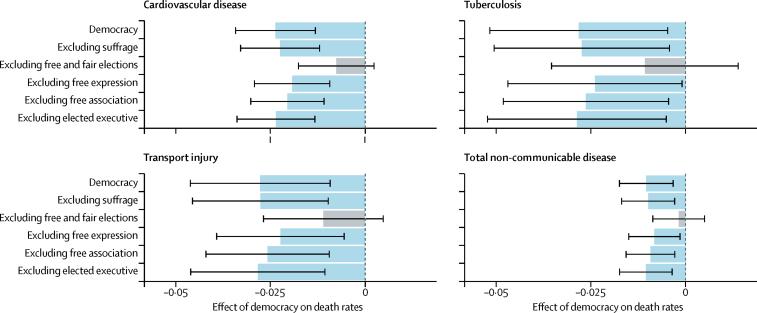
Findings: HIV-free life expectancy at age 15 years improved significantly during the study period (1970-2015) in countries after they transitioned to democracy, on average by 3% after 10 years. Democratic experience explains 22·27% of the variance in mortality within a country from cardiovascular diseases, 16·53% for tuberculosis, and 17·78% for transport injuries, and a smaller percentage for other diseases included in the study. For cardiovascular diseases, transport injuries, cancers, cirrhosis, and other non-communicable diseases, democratic experience explains more of the variation in mortality than GDP. Over the past 20 years, the average country's increase in democratic experience had direct and indirect effects on reducing mortality from cardiovascular disease (-9·64%, 95% CI -6·38 to -12·90), other non-communicable diseases (-9·14%, -4·26 to -14·02), and tuberculosis (-8·93%, -2·08 to -15·77). Increases in a country's democratic experience were not correlated with GDP per capita between 1995 and 2015 (ρ=-0·1036; p=0·1826), but were correlated with declines in mortality from cardiovascular disease (ρ=-0·3873; p<0·0001) and increases in government health spending (ρ=0·4002; p<0·0001). Removal of free and fair elections from the democratic experience variable resulted in loss of association with age-standardised mortality from non-communicable diseases and injuries.
Interpretation: When enforced by free and fair elections, democracies are more likely than autocracies to lead to health gains for causes of mortality (eg, cardiovascular diseases and transport injuries) that have not been heavily targeted by foreign aid and require health-care delivery infrastructure. International health agencies and donors might increasingly need to consider the implications of regime type in their efforts to maximise health gains, particularly in the context of ageing populations and the growing burden of non-communicable diseases.
Funding: Bloomberg Philanthropies and the Bill & Melinda Gates Foundation.
Copyright © 2019 The Author(s). Published by Elsevier Ltd. This is an Open Access article under the CC BY 4.0 license. Published by Elsevier Ltd.. All rights reserved.
Figures
Comment in
-
Good news for democracy.Lancet. 2019 Apr 20;393(10181):1576-1577. doi: 10.1016/S0140-6736(19)30431-3. Epub 2019 Mar 14. Lancet. 2019. PMID: 30878224 No abstract available.
References
-
- Global Burden of Disease Collaborative Network. Institute for Health Metrics and Evaluation Global Burden of Disease Study 2016 (GBD 2016) all-cause under-5 mortality, adult mortality, and life expectancy 1970–2016. 2017. http://ghdx.healthdata.org/record/global-burden-disease-study-2016-gbd-2...
-
- Coppedge M, Gerring J, Knutsen CH. V-Dem [Country-Year/Country-Date] dataset—version 8. V-Dem Varieties of Democracy Project. 2018. https://www.v-dem.net/en/data/data-version-8/
-
- Institute for Health Metrics and Evaluation . Institute for Health Metrics and Evaluation; Seattle: 2017. Development assistance for health database 1990–2016.http://ghdx.healthdata.org/record/development-assistance-health-database...
-
- Easterly W, Williamson CR. Rhetoric versus reality: the best and worst of aid agency practices. World Dev. 2011;39:1930–1949.
-
- Easterly W, Pfutze T. Where does the money go? Best and worst practices in foreign aid. J Econ Perspect. 2008;22:29–52.
MeSH terms
LinkOut - more resources
Full Text Sources
Medical
Miscellaneous
