. 2019 Jul;157(1):210-226.e12.
doi: 10.1053/j.gastro.2019.03.016. Epub 2019 Mar 13.

Ccne1 Overexpression Causes Chromosome Instability in Liver Cells and Liver Tumor Development in Mice

Affiliations

Ccne1 Overexpression Causes Chromosome Instability in Liver Cells and Liver Tumor Development in Mice

Khaled Aziz et al. Gastroenterology. 2019 Jul.

Abstract

Background & aims: The CCNE1 locus, which encodes cyclin E1, is amplified in many types of cancer cells and is activated in hepatocellular carcinomas (HCCs) from patients infected with hepatitis B virus or adeno-associated virus type 2, due to integration of the virus nearby. We investigated cell-cycle and oncogenic effects of cyclin E1 overexpression in tissues of mice.

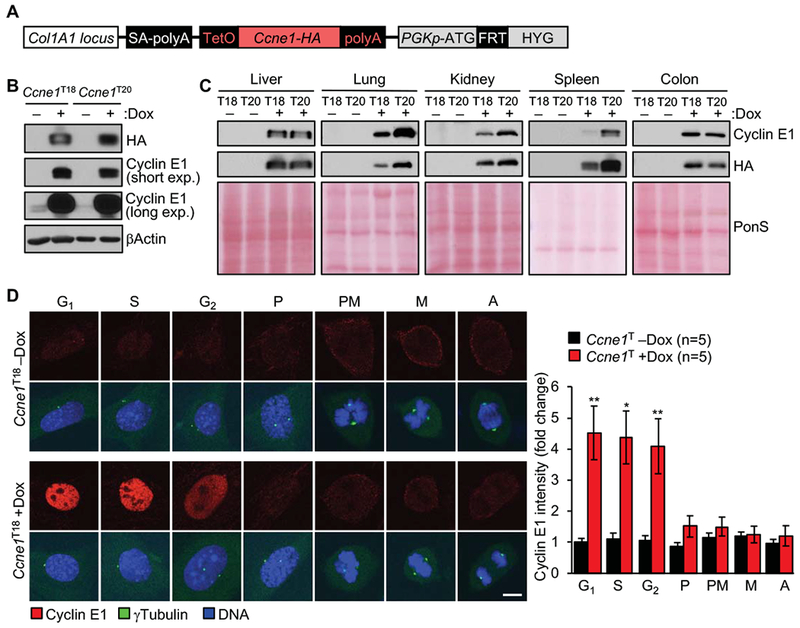
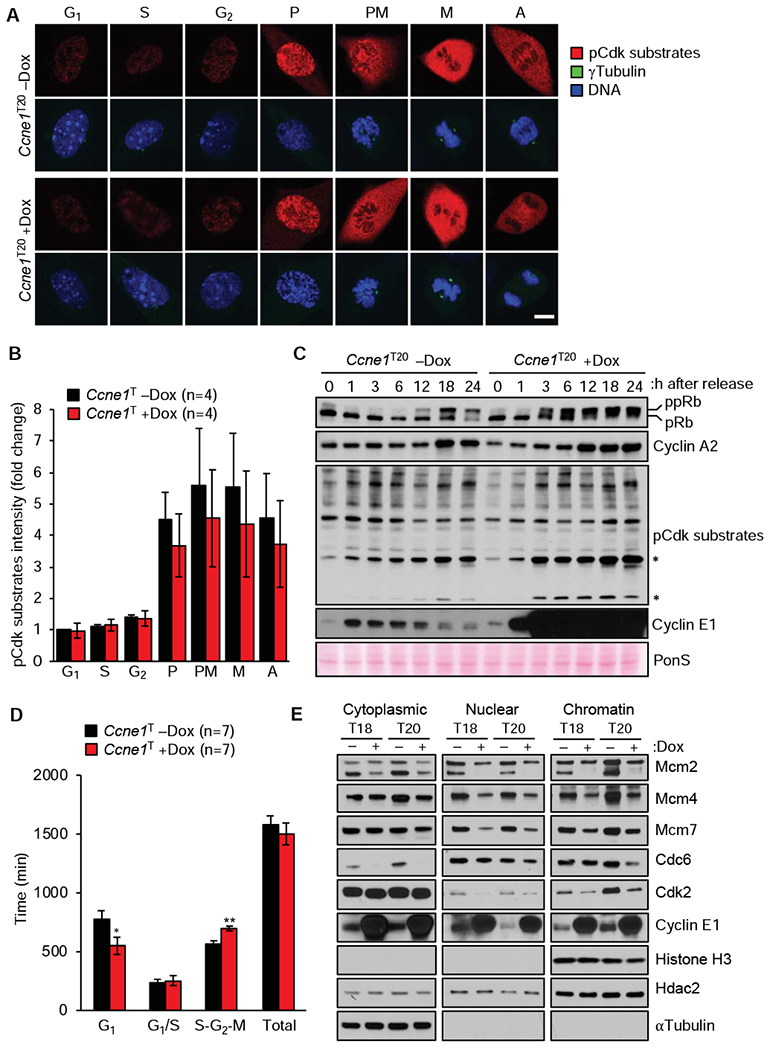
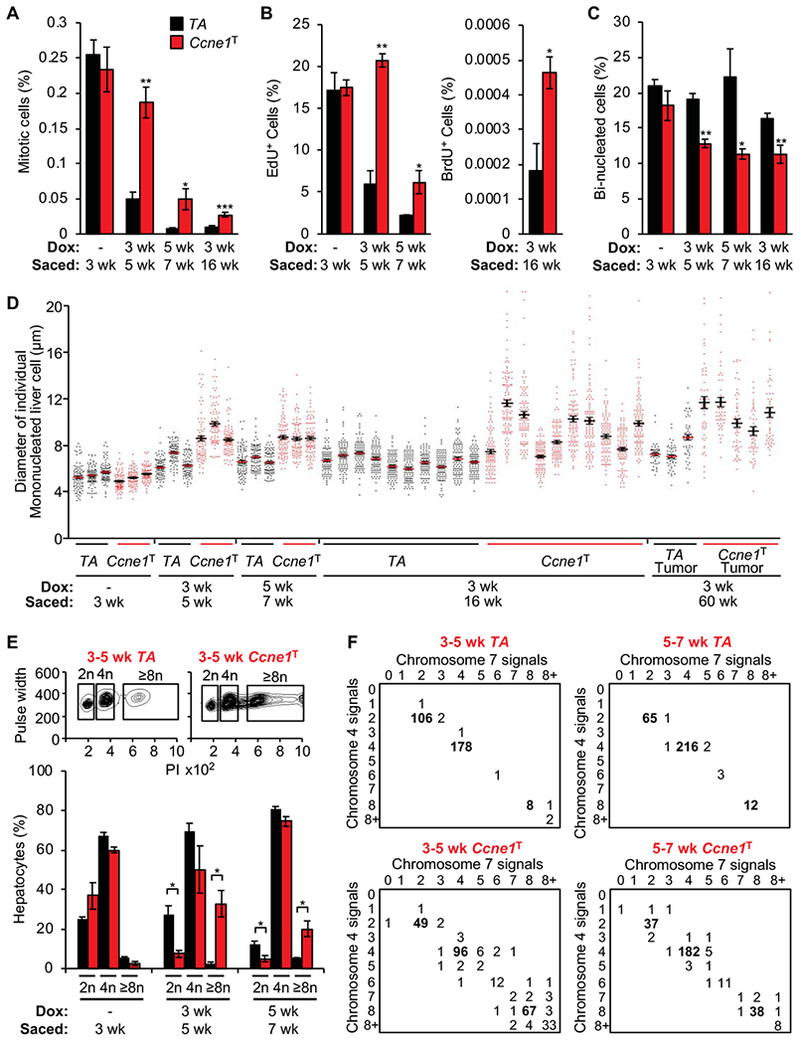
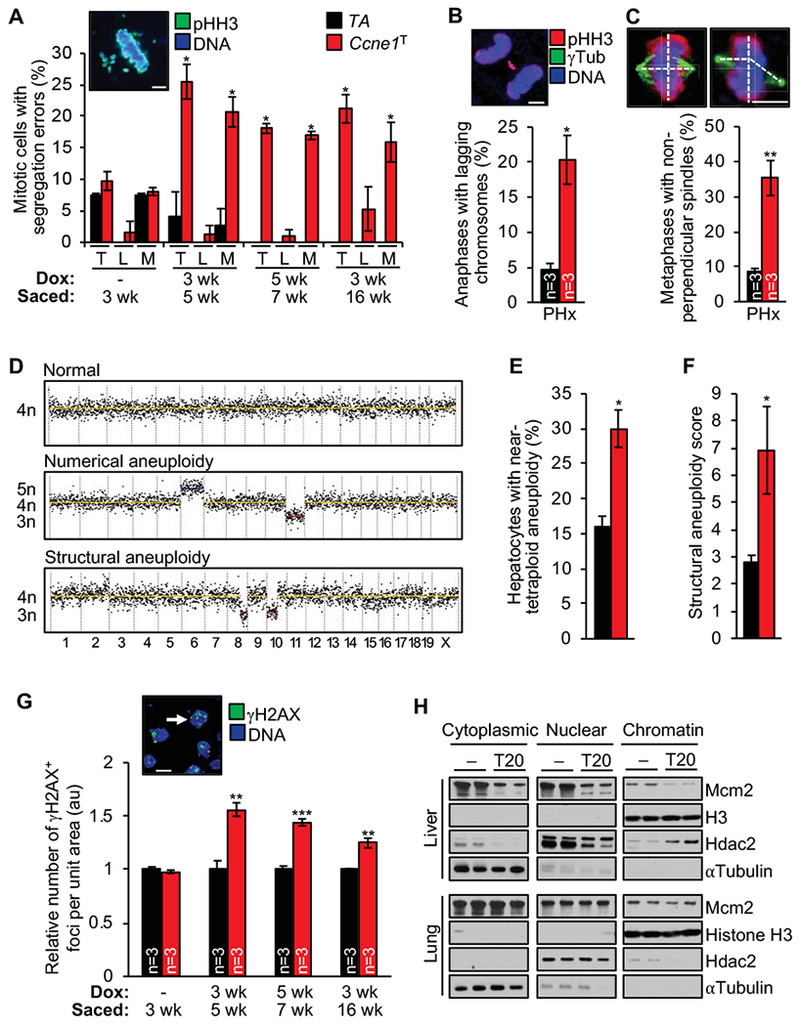
Methods: We generated mice with doxycycline-inducible expression of Ccne1 (Ccne1T mice) and activated overexpression of cyclin E1 from age 3 weeks onward. At 14 months of age, livers were collected from mice that overexpress cyclin E1 and nontransgenic mice (controls) and analyzed for tumor burden and by histology. Mouse embryonic fibroblasts (MEFs) and hepatocytes from Ccne1T and control mice were analyzed to determine the extent to which cyclin E1 overexpression perturbs S-phase entry, DNA replication, and numbers and structures of chromosomes. Tissues from 4-month-old Ccne1T and control mice (at that age were free of tumors) were analyzed for chromosome alterations, to investigate the mechanisms by which cyclin E1 predisposes hepatocytes to transformation.

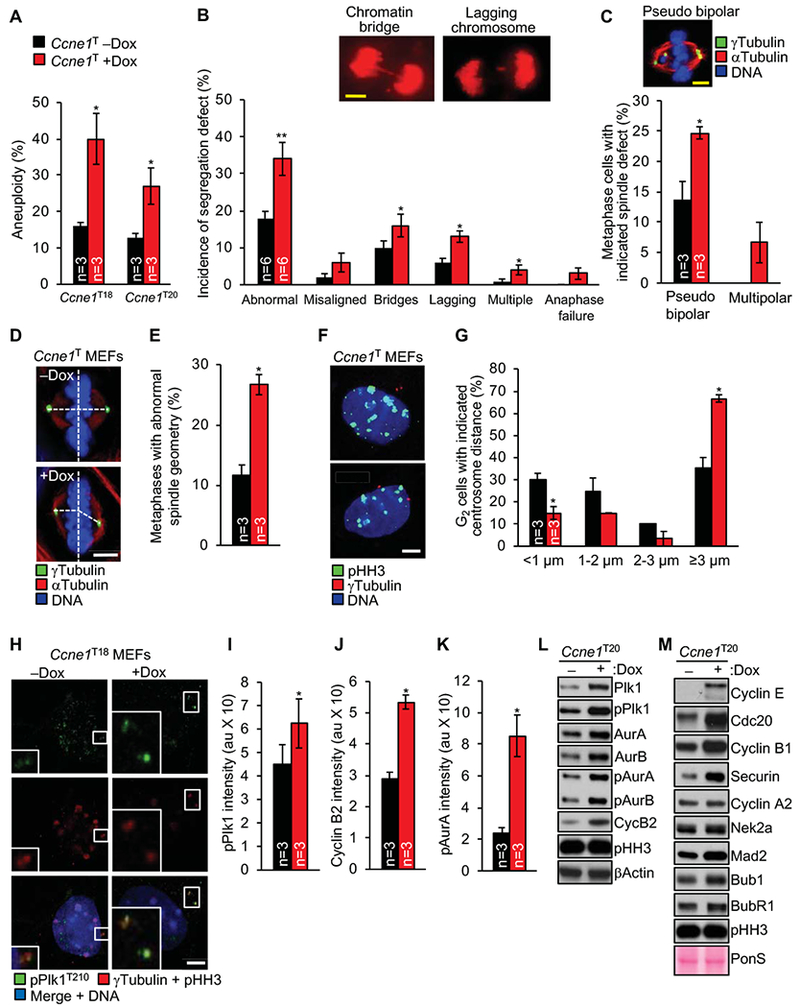
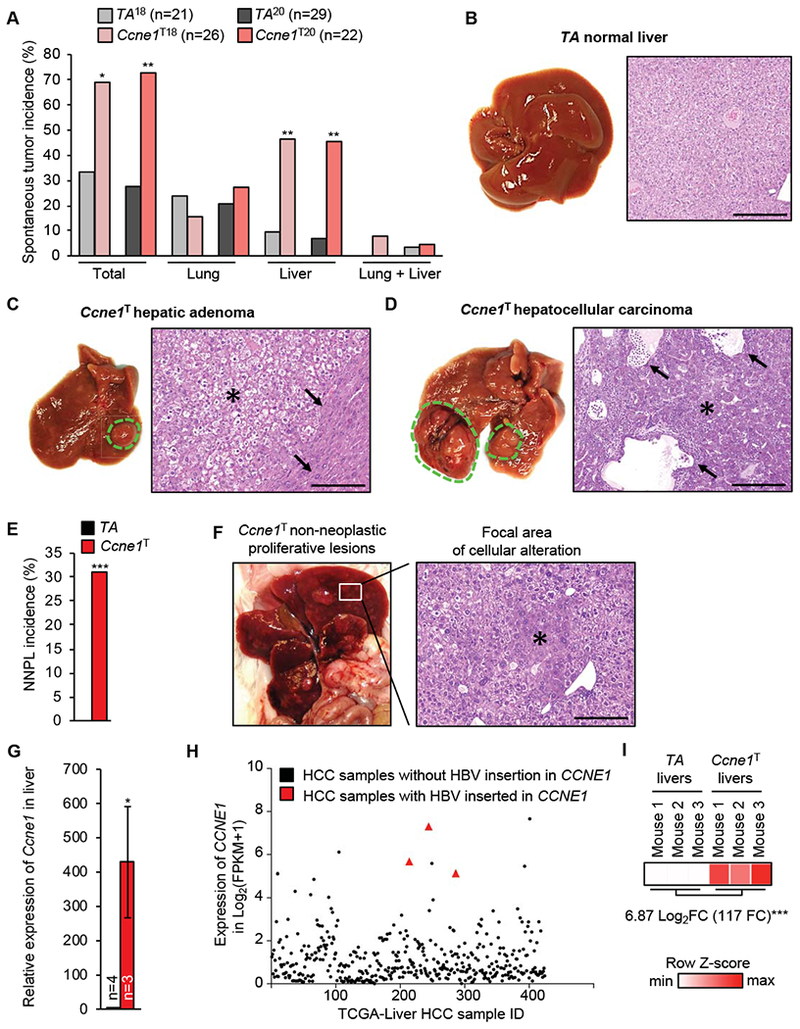
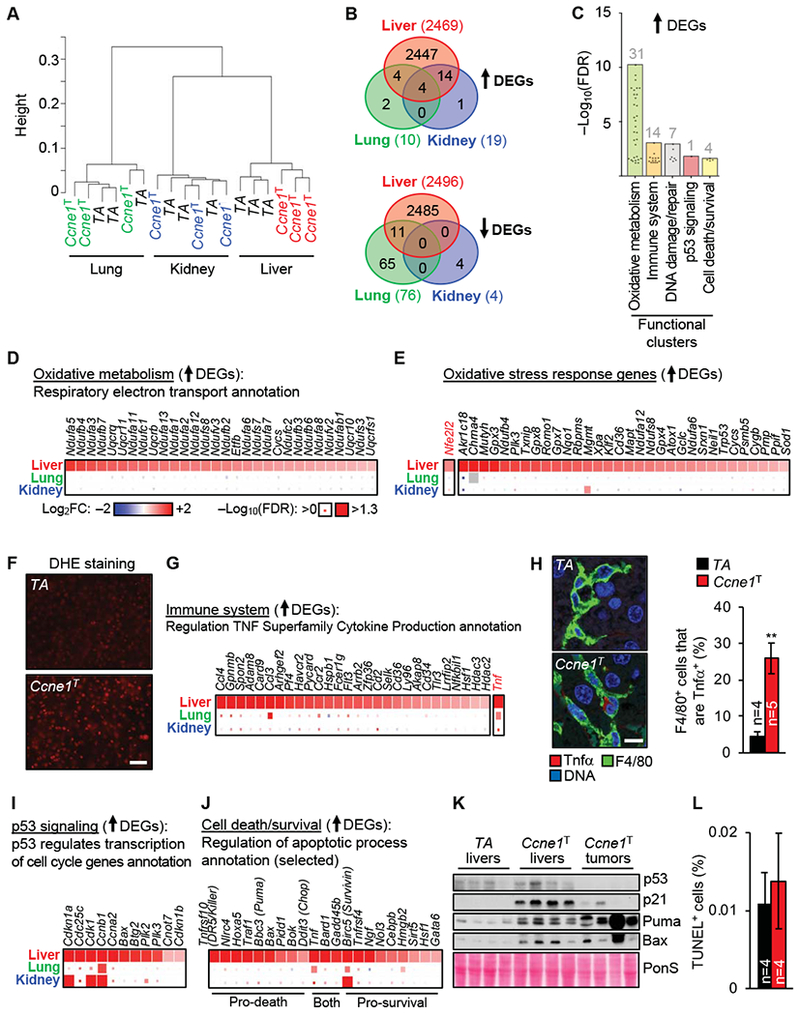
Results: Ccne1T mice developed more hepatocellular adenomas and HCCs than control mice. Tumors developed only in livers of Ccne1T mice, despite high levels of cyclin E1 in other tissues. Ccne1T MEFs had defects that promoted chromosome missegregation and aneuploidy, including incomplete replication of DNA, centrosome amplification, and formation of nonperpendicular mitotic spindles. Whereas Ccne1T mice accumulated near-diploid aneuploid cells in multiple tissues and organs, polyploidization was observed only in hepatocytes, with losses and gains of whole chromosomes, DNA damage, and oxidative stress.

Conclusions: Livers, but not other tissues of mice with inducible overexpression of cyclin E1, develop tumors. More hepatocytes from the cyclin E1-overexpressing mice were polyploid than from control mice, and had losses or gains of whole chromosomes, DNA damage, and oxidative stress; all of these have been observed in human HCC cells. The increased risk of HCC in patients with hepatitis B virus or adeno-associated virus type 2 infection might involve activation of cyclin E1 and its effects on chromosomes and genomes of liver cells.

Keywords: AAV2; Chromosome Integrity; HBV; Hepatocarcinogenesis.


Conflict of interest statement

Competing interests: The authors declare no conflicts of interest.

Figures

Figure 1
Figure 1
Generation of Ccnel transgenic mice. (A) Ccnel transgene integrated in the Col1A1 locus. (B) Western blots of lysates of Ccne1T MEFs cultured in the presence or absence of dox for 72 h and probed for HA and cyclin E1. β-actin served as loading control. (C) Western blots of tissue extract from the indicated 6-week-old transgenic mice. Ponceau S (PonS) staining of blotted proteins served as a loading control. (D) Left: MEFs at various stages of cell cycle stained for cyclin E1. γTubulin staining was used for cell cycle staging. P, prophase; PM, Prometaphase; M, Metaphase; A, Anaphase. Right: Quantification of cyclin E1 signals (normalized to -dox G1 expression). Data represent mean ± s.e.m. Statistics: D, two-tailed paired t-test. *P < 0.05, **P < 0.01. Scale bar, 5 μm.
Figure 2
Figure 2
High transgenic expression of cyclin E1 alters cell-cycle timing. (A) Representative images of dox-treated and untreated Ccne1T MEFs at the indicated stages of cell cycle immunolabeled for phosphorylated Cdk substrates. Scale bar, 5 μm. (B) Quantification of pCdk substrate signals of the indicated MEFs at various stages of the cell cycle (normalized to -dox G1, signals). (C) Western blots of lysates of Ccne1T MEFs harvested at the indicated time points after release from serum starvation in the presence or absence of dox. Asterisks mark hyperphosphorylated Cdk substrates. (D) Analysis of the indicated MEFs by FUCCI technology. (E) Western blots of fractionated lysates of MEFs grown with or without dox for 72 h. Histone H3, Hdac2, and αTubulin represent chromatin, nuclear and cytoplasmic markers, respectively. Data in B and D represent mean ± s.e.m. Statistics: B and D, two-tailed paired t-test. *P < 0.05, **P < 0.01.
Figure 3
Figure 3
Cyclin E1 overexpression causes chromosome segregation errors and aneu-ploidy in MEFs. (A) Chromosome counts on metaphase spreads of the indicated MEFs. (B) Chromosome segregation analysis of MEFs expressing H2B-mRFP. Images: Ccne1T MEFs with indicated segregation errors. (C) Incidence of pseudobipolar or multipolar spindles in metaphases stained for αTubulin and γTubulin. Image: Ccne1T MEF with indicated spindle defect. (D) Representative metaphases with perpendicular (top) and non-perpendicular spindles (bottom). (E) Incidence of non-perpendicular metaphase spindles. (F) Representative images of G2 MEFs with normal (top) and premature (bottom) centrosome disjunction. (G) Measurements of centrosome separation in G2 MEFs staged for equal pHH3 expression. (H) Representative images of pPlk1-stained prophases grown with and without dox. (I) Quantification of pPlk1 levels at centrosomes (normalized to γTubulin levels). (J, K) As in H for cyclin B2 and pAurA, respectively. (L, M) Western blots of mitotic shake-off lysates probed for the indicated proteins. Data in A-C, E, G, I-K represents mean ± s.e.m. Statistics: A-B, E, G, I-K, two-tailed paired t-test. C, two-tailed unpaired t-test *P < 0.05, **P < 0.01. Scale bars, 5 μm.
Figure 4
Figure 4
Cyclin E1 overexpression selectively induces tumors in liver. (A) Spontaneous tumor incidence in 14-month-old mice induced with dox from weaning (organs not included did not have noteworthy tumor incidence). (B) Gross image and histology of a 14-month-old TA liver. (C) Gross image and histology of a Ccne1T hepatocellular adenoma (*), with loss of normal lobular architecture and irregular growth pattern, compressing the surrounding liver parenchyma (arrows). (D) Gross image and histology of a Ccne1T hepatocellular carcinoma, with trabecular (*) and adenoid growth pattern and cystic dilation of the adenoid structures (arrows). (E) Incidence of non-neoplastic proliferative lesion (NNPL). (F) Gross image and histology of a Ccne1T liver with a focal area of cellular alteration (*). (G) RT-qPCR analysis of Ccnel transcripts in 4-month-old livers of indicted genotypes. Data represent mean ± s.e.m. (H) RNA sequencing-based expression values of CCNE1 in the indicated HCC samples of the TCGA cohort. (I) RNA sequencing-based Ccnel expression values for the indicated 4-month-old mouse livers. FC, fold change. Statistics: A and E, two-tailed Fisher’s exact test; G, two-tailed unpaired t-test. *P < 0.05, **P < 0.01, ***P < 0.001. Scale bars, 1 mm (B-D) and 300 μm (F).
Figure 5
Figure 5
Cyclin E1 overexpression causes near polyploid aneuploidy in the liver. (A) Quantification of mitotic cells in liver sections immunostained with pHH3 (n=3 per group except for the 3-16-week group where n=10 per group). (B) Quantification of EdU or BrdU-positive cells in liver sections of the indicated mice (n=3 per group except for 3-16 week where n= 11 per group). (C) Quantification of binucleated hepatocytes in H-E-stained liver sections (n=3 per group except for the 3-16-week group where n=10 per group; n=200 hepatocytes per group). (D) Hepatocyte diameters in the indicated liver or liver tumor samples (each column represents 1 liver or liver tumor; n=200 hepatocytes per sample). (E) Top: Flow cytometry profiles of hepatocyte ploidy as assessed by propidium iodide (PI) staining. Bottom: Quantification of hepatocyte DNA contents into diploid (2n), tetraploid (4n) and polyploid (≥8n) cell fractions (n=3 mice per group). (F) FISH analysis for chromosome 4 and 7 signals on the hepatocyte suspensions used in E (n=3 per group; n=100 hepatocytes per sample). Data represent mean ± s.e.m. Statistics: A-E, two-tailed unpaired t-test. *P < 0.05, **P < 0.01, ***P < 0.001.
Figure 6
Figure 6
Cyclin E1 overexpression causes a complex CIN phenotype in hepatocytes. (A) Chromosome segregation errors (T, total, L, lagging, M, misaligned) in liver sections of the indicated mice (n=3 per group except for the 3-16-week group where n=9 per group). Inset, representative image of a cell in metaphase with misaligned chromosomes. (B) Quantification of anaphases with lagging chromosome in liver sections of the indicated 8-week-old mice 48 h after partial hepatectomy (PHx). Image shows a representative Ccne1T hepatocyte with a lagging chromosome. (C) Quantification of metaphases with non-perpendicular spindles in samples described in B. Images show metaphases with perpendicular (left) and non-perpendicular spindles (right). (D) Representative segmentation plots of single tetraploid liver nuclei with normal ploidy, numerical aneuploidy and structural aneuploidy. (E, F) Numerical and structural aneuploidy assessments by single-cell DNA sequencing of hepatocytes FACS-sorted for 4n DNA content (n=4 mice per group, 15-22 hepatocytes per mouse). (G) Quantification of γH2AX foci per nuclear area in liver sections of the indicated mice. Image represents γH2AX staining for liver cryosections at 4 months of age (arrow indicates a hepatic cell with an abundance of γH2AX-positive foci). (H) Western blots of fractionated lysates of liver and lung tissue Histone H3, Hdac2, and αTubulin represent chromatin, nuclear and cytoplasmic markers, respectively. Data represents mean ± s.e.m. Statistics: A-G, two-tailed unpaired t-test. *P < 0.05, **P < 0.01. Scale bars, 5 μm.
Figure 7
Figure 7
Identification of pro-tumorigenic changes in preneoplastic livers of mice overexpressing cyclin E1. (A) Hierarchical clustering using RNA sequencing data from lung, liver and kidney of the indicated 4-month-old mice. The y-axis represents the metric 1-Pearson correlation as distance between samples. (B) Venn diagrams depicting numbers of significantly up- or downregulated differentially expressed genes (DEGs) in the indicated Ccne1T tissues versus corresponding TA tissues. (C) Selected functional clusters overrepresented in upregulated DEGs from Ccne1T versus TA livers. Points within each cluster represent individual annotations. The total number of annotations per cluster is indicated. FDR, false discovery rate. (D) Heatmap of upregulated DEGs for the indicated annotation. Depicted are log2 fold expression changes in Ccne1T versus TA tissues (box color) and the significance per gene (box size). (E) Heatmap of upregulated DEGs generated from GO annotation “Response to oxidative stress”. (F) Representative images of cryo-sections of the indicated 4-month-old livers stained with DHE. Scale bar, 40 μm. (G) Heatmap of upregulated DEGs for the indicated annotation within the immune system cluster. (H) Left: Images of representative liver sections of the indicated 4-month-old mice immunolabeled for Tnfα and F4/80. Scale bar, 10 μm. Right: Quantitation of Tnfα+ cells among the F4/80+ cells in the indicated liver sections. (I, J) Heatmaps of upregulated DEGs for the indicated annotations of the “p53 signaling” and “cell/death/survival” clusters, respectively. K) Western blots of lysates from 4-month-old livers and liver tumors of 14-month-old mice. Ponceau S (PonS) served as loading control. (L) Quantification of TUNEL-positive cells in liver sections of the indicated 4-month-old mice. Data in H and L represents mean ± s.e.m. Statistics: H and L, two-tailed unpaired t-test. **P < 0.01. Heatmap legends in E, G, I, and J are as in D.

References

    1. Ohtsubo M, Roberts J. Cyclin-dependent regulation of G1 in mammalian fibroblasts. Science 1993;259:1908–1912. - PubMed
    1. Resnitzky D, Gossen M, Bujard H, et al. Acceleration of the G1/S phase transition by expression of cyclins D1 and E with an inducible system. Mol Cell Biol 1994;14:1669–79. - PMC - PubMed
    1. Geng Y, Yu Q, Sicinska E, et al. Cyclin E ablation in the mouse. Cell 2003;114:431–43. - PubMed
    1. Parisi T, Beck AR, Rougier N, et al. Cyclins E1 and E2 are required for endoreplication in placental trophoblast giant cells. EMBO J 2003;22:4794–803. - PMC - PubMed
    1. Geng Y, Michowski W, Chick JM, et al. Kinase-independent function of E-type cyclins in liver cancer. Proc Natl Acad Sci U S A 2018; 115:1015–1020. - PMC - PubMed

Publication types

MeSH terms

Supplementary concepts