. 2019 Apr:42:281-295.
doi: 10.1016/j.ebiom.2019.03.018. Epub 2019 Mar 14.

Simultaneous blocking of CD47 and PD-L1 increases innate and adaptive cancer immune responses and cytokine release

Affiliations

Simultaneous blocking of CD47 and PD-L1 increases innate and adaptive cancer immune responses and cytokine release

Shu Lian et al. EBioMedicine. 2019 Apr.

Abstract

Background: Treatment multiple tumors by immune therapy can be achieved by mobilizing both innate and adaptive immunity. The programmed death ligand 1 (PD-L1; or CD274, B7-H1) is a critical "don't find me" signal to the adaptive immune system. Equally CD47 is a critical "don't eat me" signal to the innate immune system and a regulator of the adaptive immune response.

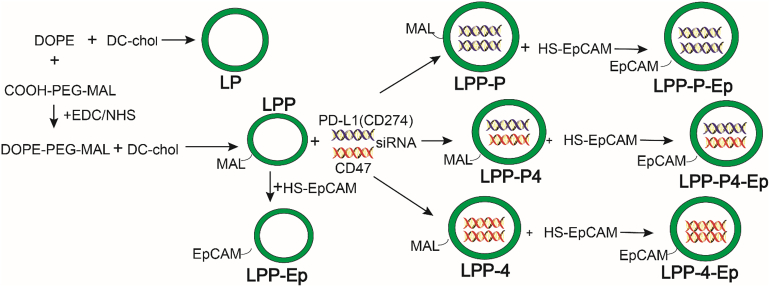
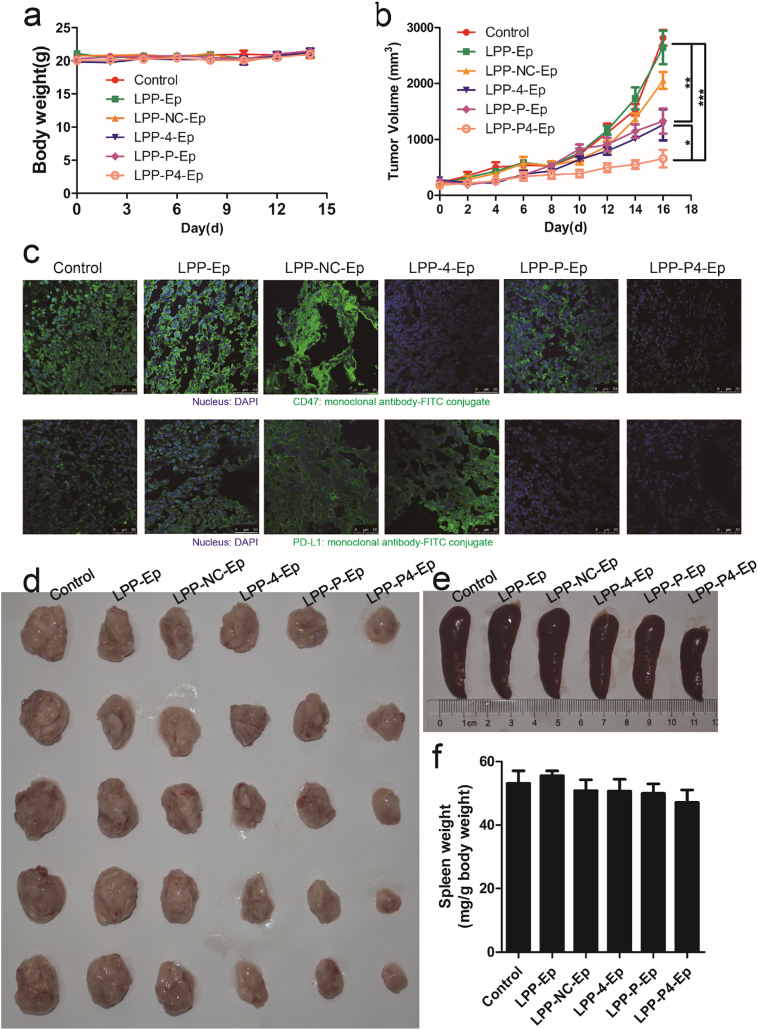
Method: Both of CD47 and PD-L1 are overexpressed on the surface of cancer cells to enable to escape immune-surveillance. We designed EpCAM (epithelial cell adhesion molecule)-targeted cationic liposome (LPP-P4-Ep) containing si-CD47 and si-PD-L1 could target high-EpCAM cancer cells and knockdown both CD47 and PD-L1 proteins.

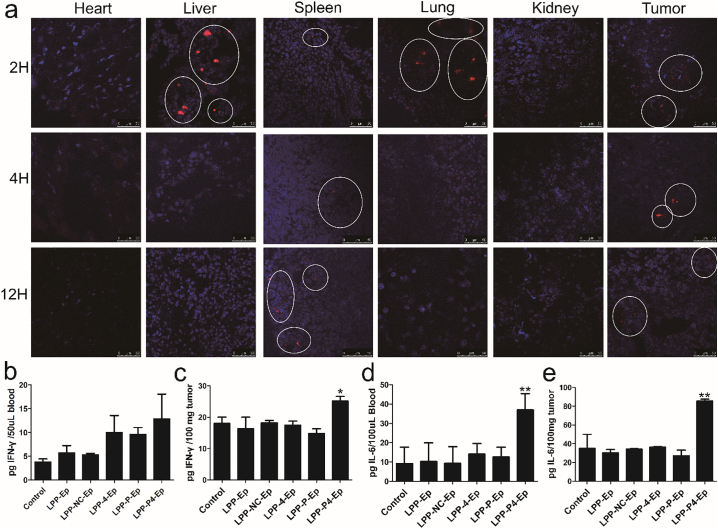
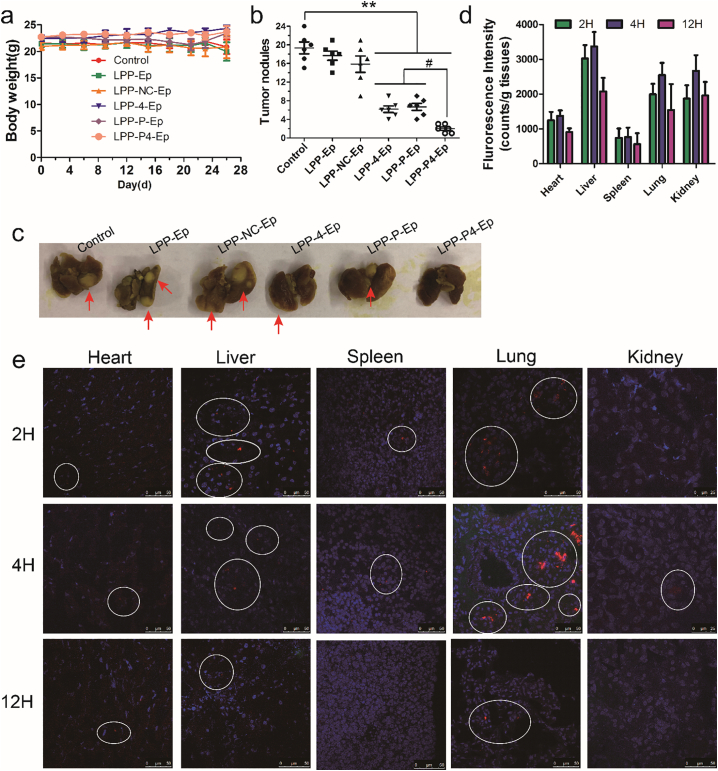
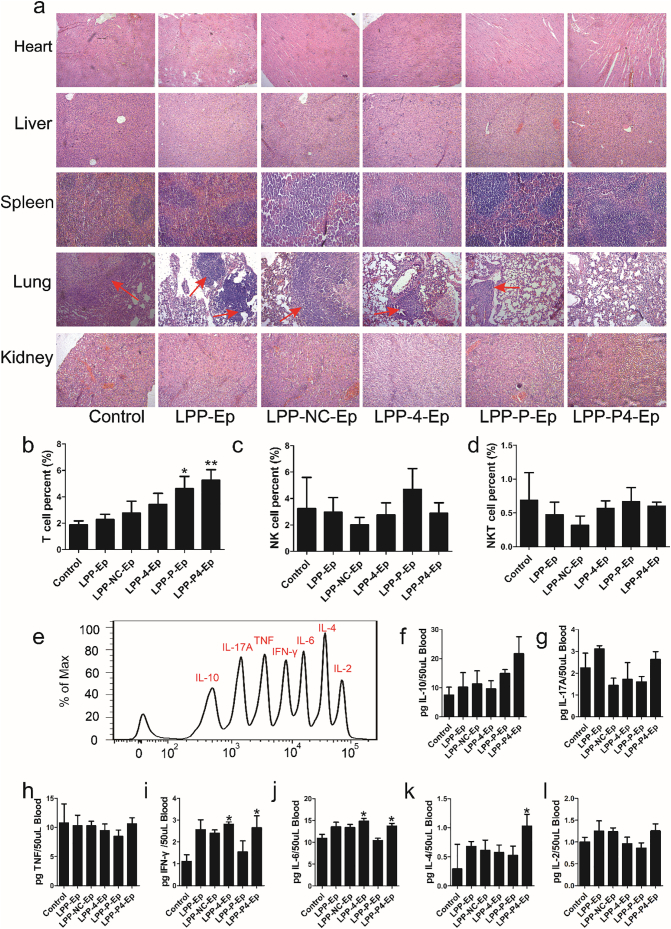
Findings: Efficient silencing of CD47 and PD-L1 versus single gene silencing in vivo by systemic administration of LPP-P4-Ep could significantly inhibited the growth of solid tumors in subcutaneous and reduced lung metastasis in lung metastasis model. Target delivery of the complexes LPP-P4-Ep increased anti-tumor T cell and NK cell response, and release various cytokines including IFN-γ and IL-6 in vivo and in vitro.

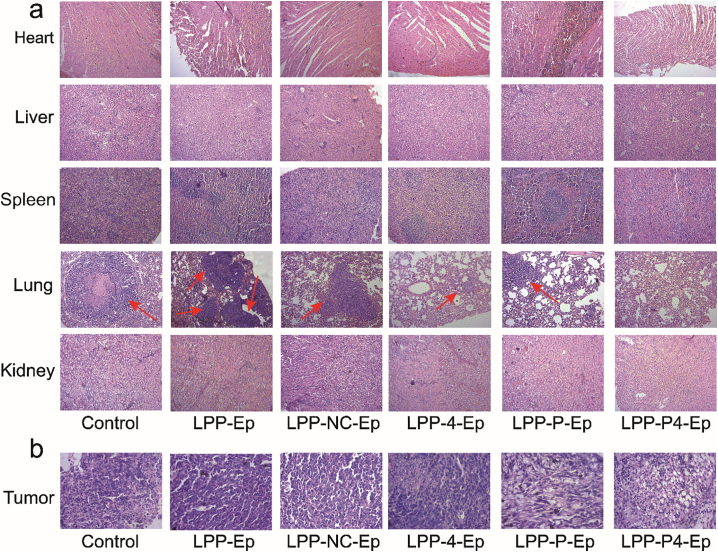
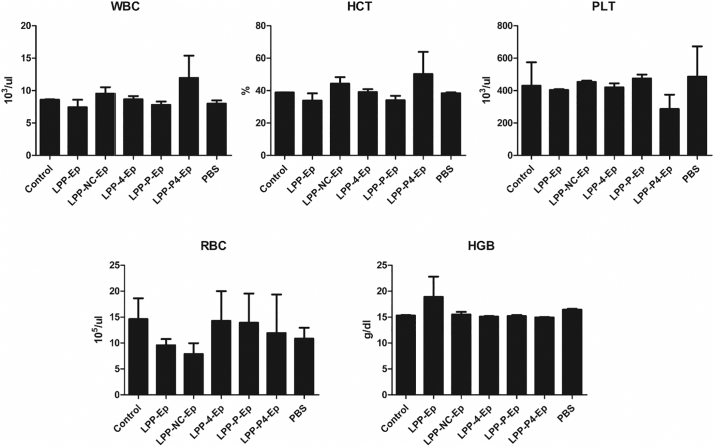
Interpretation: This multi-nanoparticles showed significantly high-EpCAM tumor targeting and lower toxicity, and enhanced immune therapeutic efficacy. Our data indicated that dual-blockade tumor cell-specific innate and adaptive checkpoints represents an improved strategy for tumor immunotherapy. FUND: This research supported by the Ministry of Science and Technology of the People's Republic of China (grant number 2015CB931804); the National Natural Science Foundation of China (NSFC, grant numbers 81703555, U1505225 and 81773063), and the China Postdoctoral Science Foundation (grant number 2017 M620268).

Keywords: CD47/SIPR-α; EpCAM targeted; Gene therapy; Immune therapy; Liposome; PD-L1/PD-1; siRNA.


Figures

Fig. 1
Fig. 1
Schematic illustration of the design and synthesis of LP, LPP, LPP-Ep, LPP-P, LPP-4, LPP-P4, LPP-P-Ep, LPP-4-Ep and LPP-P4-Ep complexes.
Fig. 2
Fig. 2
Characteristics of LPP-Ep. (a) Identification of aptamer EpCAM binding to LPP. (1, LPP-Ep; 2, EpCAM; 3, LPP; 4, mixture of EpCAM and LP-P; 5, marker). (b) The relationship between fluorescence intensities and quality control concentrations of Cy5-labelled LPP-Ep. (c-e) TEM, SEM and AFM images of LPP-Ep liposome; (f) Hydrodynamic diameter of LPP-Ep; (g) The release of siRNA from LPP and LPP -Ep in 5.6 or 7.4 pH PBS solution in vitro. The results were repeated three times and the error bars expressed as mean ± SEM.
Fig. 3
Fig. 3
Cell recognition ability of anti-EpCAM aptamer and cellular efficiency of EpCAM-targeted liposome complexes to PC-9, A549 and Helf cells. (a) The target capacity of Cy5-EpCAM on PC-9, A549 and Helf cells at concentration of 1, 10, 25, 50, 100 nM at 4 h. The error bars expressed as mean ± SEM (n = 3). (b) The target capacity of Cy5-EpCAM on PC-9, A549 and Helf cells at of 50 nM concentration at 1, 2, 4, 6, 8 h. The error bars expressed as mean ± SEM (n = 3). (c-e) Flow cytometry analysis of FAM-siCD47 and Cy5-siPD-L1 fluorescence intensity. PC-9, A549 and Helf cells treated with siRNA-P4, LPP-P4 and LPP-P4-Ep at 4 h. The data present means ± SEM (n = 3). (f) Cells were transfected with siRNA-P4, LPP-P4 and LPP-P4-Ep for 4 h. FAM-siCD47 (green) or Cy5-siPD-L1 (red) was imaged by confocal laser scanning microscope. (For interpretation of the references to colour in this figure legend, the reader is referred to the web version of this article.)
Fig. 4
Fig. 4
The efficient function of LPP-P4-Ep. (a) Cell cytotoxicity of various formulations nanoparticles (LP, LPP and LPP-Ep) on HELF, PC-9, A549 and 4 T1 cells. (b) Cell cytotoxicity of various formulations of nanoparticles (LPP-Ep, LPP-NC-Ep, LPP-4-Ep, LPP-P-Ep and LPP-P4-Ep) on PC-9 cells. The cell viability was expressed as the percentage of the controls. (c-d) Down regulation of CD47 and PD-L1 protein expressions by LPP-4-EP/LPP-P-EP. (e-h) Down regulation of CD47 and PD-L1 protein expressions by LPP-P4-EP at 25, 50 and 100 nM siRNA concentration. *P < 0.05, **P < 0.01, ***P < 0.001 compared to the control group by ANOVA test. #P < 0.05, ##P < 0.01 compared with the 48 h group by ANOVA test. (Ii) Down regulation of EpCAM protein expression by EpCAM aptamer. *P < 0.05, **P < 0.01, ***P < 0.001 compared with the control group by ANOVA test. (j) Monocyte cells were co-cultured with CFSE labelled PC-9 cells at ratio (E: T = 10: 1). (k) Column diagrams show CFSE+/PI+ (Q2) labeling cells percentage of (J). *P < 0.05, **P < 0.01, ***P < 0.001 compared with the control group by ANOVA test. #P < 0.05, ##P < 0.01 compared with the LPP-P4-Ep group by ANOVA test. All error bars expressed as mean ± SEM.
Fig. 5
Fig. 5
In vivo antitumor effects of LPP-P4-Ep for solid tumor. (a) Mice weight changes. Each data point was represented as mean ± SEM. n = 6 (b) Tumor size changes of 4 T1 model mice after treated with PBS, LPP-Ep, LPP-NC-Ep, LPP-4-Ep, LPP-P-Ep and LPP-P4-Ep. *P < 0.05, **P < 0.01, ***P < 0.001 compared to the control group by ANOVA test (c) Immunofluorescence images of CD47 and PD-L1 on tumor tissue. The nucleus was stained with Hoechst 33258. (d) Collecting tumor tissue after administration. (e-f) The spleens were isolated and weighted, and spleen weight index were calculated as organ weight (milligram, mg) per gram (g) of mouse body weight. All error bars expressed as mean ± SEM (n = 3).
Fig. 6
Fig. 6
LPP-P4-Ep distribution of 4 T1 model mice in tumor, heart, liver, spleen, lung and kidney. (a) Images of tumor, heart, liver, spleen, lung and kidney at 2, 4 and 12 h. Nuclei was stained by hoechst 33258 (blue) and Cy5-labelled LPP-Ep was red. (b-e) The levels of IFN-γ and IL-6 cytokines of mice in tumor and in blood were detected by ELISA. Data were expressed as mean ± SEM. *P < 0.05, **P < 0.01, ***P < 0.001 compared with the control group by ANOVA test. (For interpretation of the references to colour in this figure legend, the reader is referred to the web version of this article.)
Fig. 7
Fig. 7
The immunohistochemistry of heart, liver, spleen, lung, kidney and tumor. Nuclei were strained blue and cytoplasm was strained in red. (a) Immunohistochemistry of Heart, Liver, Spleen, Lung and Kidney collected from the endpoint from the endpoint of the experiment, amplification × 40. (b) Immunohistochemistry of tumor collected from the endpoint from the endpoint of the experiment, amplification × 100. (For interpretation of the references to colour in this figure legend, the reader is referred to the web version of this article.)
Fig. 8
Fig. 8
In vivo antitumor effects of LPP-P4-Ep in lung metastasis. (a) Mice weight changes. Each data point was represented as mean ± SEM, n = 6. (b) 4 T1 tumor nodules in lungs of mice after treatment of nanoparticle complexes. Data were expressed as mean ± SEM. *P < 0.05, **P < 0.01, ***P < 0.001 compared with the control group by ANOVA test. #P < 0.05, ##P < 0.01 compared with the LPP-P4-Ep group by ANOVA test. (c) The gross appearance of tumor nodules of 4T1 (shown in arrows) in lungs after fixation with Bouin's solution for 24 h. (d) LPP-P4-Ep distribution in heart, liver, spleen, lung and kidney at 2, 4 and 12 h. The error bars expressed as mean ± SEM (n = 3). (e) Confocal microscopic images of heart, liver, spleen, lung and kidney at 2, 4 and 12 h. Nuclei was stained by hoechst 33258 (blue) and Cy5-labelled LPP-Ep was red. (For interpretation of the references to colour in this figure legend, the reader is referred to the web version of this article.)
Fig. 9
Fig. 9
The immunohistochemistry and CBA assay. (a) Immunohistochemistry of heart, liver, spleen, lung and kidney collected from the endpoint from the endpoint of the experiment, amplification × 40. (b-d) The percent of T cells, NK cells and NKT cells in leukocyte after nanoparticle complexes treatment ten days. *P < 0.05, **P < 0.01, ***P < 0.001 compared to the control group by ANOVA test. (e-l) The levels of cytokines including IFN-γ, IL-17A, TNF, IL-2, IL-4, IL-6 and IL-10 in sera of immunized mice were detected by quantitative CBA. *P < 0.05, **P < 0.01, ***P < 0.001 compared to the control group by ANOVA test. All error bars expressed as mean ± SEM (n = 3).
Fig. 10
Fig. 10
LPP-P4-Ep caused no anemia. Whole blood analysis about hematology collected from Babl/c mice treated with LPP-P4-Ep loading anti-CD47 or anti-PD-L1 siRNA (n = 5). HCT, hematocrit; HGB, hemoglobin; PLT, platelet; RBC, red blood cell; WBC, white blood cell. *P < 0.05 compared to the control group by ANOVA test. All error bars expressed as mean ± SEM (n = 3). (For interpretation of the references to colour in this figure legend, the reader is referred to the web version of this article.)

Similar articles

Cited by

References

    1. Mellman I., Coukos G., Dranoff G. Cancer immunotherapy comes of age. Nature. 2011;480:480–489. - PMC - PubMed
    1. Zhu E.F. Synergistic innate and adaptive immune response to combination immunotherapy with anti-tumor antigen antibodies and extended serum half-life IL-2. Cancer Cell. 2015;27:489–501. - PMC - PubMed
    1. Park S. The therapeutic effect of anti-HER2/neu antibody depends on both innate and adaptive immunity. Cancer Cell. 2010;18:160–170. - PMC - PubMed
    1. Yang X. Cetuximab-mediated tumor regression depends on innate and adaptive immune responses. Mol. Ther. 2013;21:91–100. - PMC - PubMed
    1. Dong H. Tumor-associated B7-H1 promotes T-cell apoptosis: a potential mechanism of immune evasion. Nat Med. 2002;8:793–800. - PubMed