Multicenter Study
. 2019 Jun;78(6):761-772.
doi: 10.1136/annrheumdis-2018-214539. Epub 2019 Mar 16.

Synovial cellular and molecular signatures stratify clinical response to csDMARD therapy and predict radiographic progression in early rheumatoid arthritis patients

Affiliations
Multicenter Study

Synovial cellular and molecular signatures stratify clinical response to csDMARD therapy and predict radiographic progression in early rheumatoid arthritis patients

Frances Humby et al. Ann Rheum Dis. 2019 Jun.

Abstract

Objectives: To unravel the hierarchy of cellular/molecular pathways in the disease tissue of early, treatment-naïve rheumatoid arthritis (RA) patients and determine their relationship with clinical phenotypes and treatment response/outcomes longitudinally.

Methods: 144 consecutive treatment-naïve early RA patients (<12 months symptoms duration) underwent ultrasound-guided synovial biopsy before and 6 months after disease-modifying antirheumatic drug (DMARD) initiation. Synovial biopsies were analysed for cellular (immunohistology) and molecular (NanoString) characteristics and results compared with clinical and imaging outcomes. Differential gene expression analysis and logistic regression were applied to define variables correlating with treatment response and predicting radiographic progression.

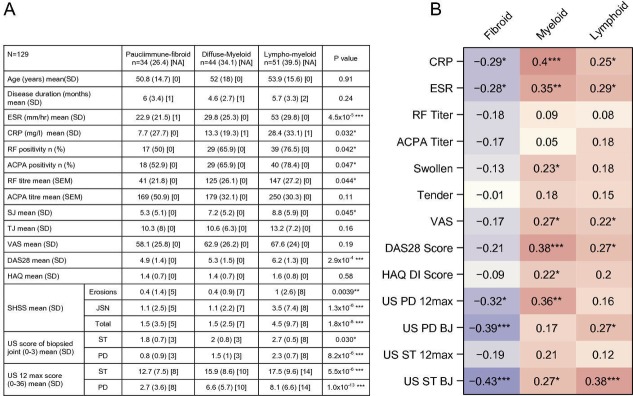
Results: Cellular and molecular analyses of synovial tissue demonstrated for the first time in early RA the presence of three pathology groups: (1) lympho-myeloid dominated by the presence of B cells in addition to myeloid cells; (2) diffuse-myeloid with myeloid lineage predominance but poor in B cells nd (3) pauci-immune characterised by scanty immune cells and prevalent stromal cells. Longitudinal correlation of molecular signatures demonstrated that elevation of myeloid- and lymphoid-associated gene expression strongly correlated with disease activity, acute phase reactants and DMARD response at 6 months. Furthermore, elevation of synovial lymphoid-associated genes correlated with autoantibody positivity and elevation of osteoclast-targeting genes predicting radiographic joint damage progression at 12 months. Patients with predominant pauci-immune pathology showed less severe disease activity and radiographic progression.

Conclusions: We demonstrate at disease presentation, prior to pathology modulation by therapy, the presence of specific cellular/molecular synovial signatures that delineate disease severity/progression and therapeutic response and may pave the way to more precise definition of RA taxonomy, therapeutic targeting and improved outcomes.

Keywords: dmards (synthetic); early rheumatoid arthritis; inflammation; synovitis.


Figures

Figure 1
Figure 1
(A) Representative image of an US-guided wrist biopsy. Inset: greyscale transverse US image of wrist joint demonstrating biopsy needle entering joint space under extensor tendon complex. Synovial tissue fragment (encircled) in biopsy needle. (B) Patient characteristics of cohort. (C) Number and type of joints biopsied. (D) Synovial pathotype according to joint biopsied. (E) H&E staining and immunohistochemistry of synovial biopsies for CD20+ B cells, CD3+ T cells, CD68+ macrophages in synovial lining/sublining layers and CD138+ plasma cells from treatment-naïve individuals with early rheumatoid arthritis. Synovial biopsies were categorised as lympho-myeloid, diffuse myeloid or pauci-immune fibroid. CCP, cyclic citrullinated peptide; CRP, C-reactive protein; DAS28, disease activity score-28; ESR, erythrocyte sedimentation rate; MTP, metatarsophalangeal; MCP, metacarpophalangeal; PIP, proximal interphalangeal; RF, rheumatoid factor; SHSS, van der Heijde modified Sharp score; SJ, swollen joints; TJ, tender joints; US, ultrasound; VAS, visual analogue scale.
Figure 2
Figure 2
(A) Heatmap of NanoString gene expression data. Raw log2 NanoString counts for 212 genes and 111 patient samples were normalised per probe to give a mean of 0 and SD of 1. Normalised data were clustered by row and column using Euclidean distance and Ward’s linkage. Samples are coloured according to IHC-determined pathotype, with ungraded samples coloured grey. Rows are coloured according to the pathotype with which the gene was originally associated, with RA biology-associated genes coloured black. (B) Eigengene scores versus IHC-determined pathotypes. Individual eigengene scores are plotted for each sample, grouped and coloured by the pathotype as determined by IHC. Stars represent statistical significance as determined by linear regression across groups: *p<0.05, **p<0.01, ***p<0.001. (C) Radar plot of standardised eigengene scores. Eigengene values were normalised to give a mean 0 and SD of 1. Samples were grouped by pathotype, and the mean (solid lines) and SE of the mean (shaded region) were calculated for the normalised eigengenes. Spokes of the radar plot represent the distance along each normalised eigengene for each sample group. (D) Volcano plot of gene expression differences across pathotypes. For each gene, one-way ANOVA was performed comparing expression across the three pathotypes. The –log10 p value from the one-way ANOVA is plotted against the root mean square of the log2 fold changes between each pair of eigengenes. Genes are coloured according to the pathotype in which it was initially identified, with RA biology-associated genes coloured black. ANOVA, analysis of variance; IHC, immunohistochemistry; RA, rheumatoid arthritis.
Figure 3
Figure 3
(A) Baseline clinical and histological parameters stratified according to three pathological subtypes, adjusted for joint type (n=129), *significant differences. (B) Correlation analysis of each Eigengene score with metrics of clinical disease activity, autoantibodies, acute phase reactants and ultrasonography. Values represent Spearman correlation coefficients between the clinical variables and the individual eigengene scores adjusted for joint type. Stars represent the significance of the correlation coefficient: *p<0.05, **p<0.01, ***p<0.001. ACPA, anti-citrullinated peptide antibodies; BJ, biopsied joint; CRP, C-reactive protein; DAS28, disease activity score-28; DI, Disability Index; ESR, erythrocyte sedimentation rate; HAQ, Health Assessment Questionnaire; RF, rheumatoid factor; SHSS, van der Heijde modified Sharp score; SJ, swollen joints; ST, synovial thickening; TJ, tender joints; US, ultrasound, VAS, visual analogue scale.
Figure 4
Figure 4
(A) Correlation of pretreatment serum CXCL13, sICAM1, MMP3 and IL-8 with clinical disease metrics and ultrasonography scores. Values represent Spearman correlation coefficients between serum biomarkers and clinical variables. Stars represent the significance of the correlation coefficient: *p<0.05, **p<0.01, ***p<0.001. P values were corrected for multiple testing using Benjamini-Hochberg method. (B) Correlation of pretreatment serum CXCL13, sICAM1, MMP3 and IL-8 with synovial histology scores. Values represent Spearman correlation with individual eigengene scores adjusted for biopsy joint size, or histology semiquantitative scores. (C) Concentration of serum CXCL13 versus synovial pathotype status. (D) Concentration of serum MMP3 versus synovial pathotype status. P values were calculated using student t-test, with correction for multiple testing. ACPA, anti-citrullinated protein antibodies; BJ, biopsied joint; CRP, C-reactive protein; CXCL13, C-X-C motif-chemokine-13; DAS28, disease activity score-28; DI, Disability Index; ESR, erythrocyte sedimentation rate; HAQ, Health Assessment Questionnaire; IHC, immunohistochemistry; IL-8, interleukin-8; MMP-3, matrix metalloproteinase-3; PD, power Doppler; RF, rheumatoid factor; sICAM1, soluble intercellular adhesion molecule 1; ST, synovial thickening; US, ultrasound; VAS, visual analogue scale.
Figure 5
Figure 5
(A) Clinical changes in disease activity and treatment regimens stratified according to pathotype. (B) Volcano plot showing changes in gene expression between baseline and 6 months in patients with a EULAR response. Individual points are coloured by the pathotype in which the gene was originally identified, with RA biology-associated genes coloured black. (C) Volcano plot showing changes in gene expression between baseline and 6 months in patients with EULAR nonresponse. Genes are coloured as above. (D) Correlation of pretreatment lymphoid, myeloid and fibroid eigengene scores with change in DAS28-ESR after 6 months of DMARD treatment. Spearman’s correlation coefficient is shown, along with the significance of this value. (E–G) Paired plots for baseline and 6 month lymphoid (E), myeloid (F) and fibroid (G) eigengene scores in patients who achieved good or poor clinical responses to DMARD treatment at 6 months by the EULAR response criteria. Patients who achieved a good response, or failed to achieve a moderate response, according to EULAR criteria are shown. For each patient, the pretreatment eigengene scores are connected to the post-treatment eigengene score, for each of the three eigengenes. Stars represent significance of the difference between pretreatment and post-treatment samples using a linear mixed effects model with sample date as a fixed effect and patient as a random effect: *p<0.05, **p<0.01, ***p<0.001. DAS28, disease activity score-28; DMARD, disease-modifying antirheumatic drug; ESR, erythrocyte sedimentation rate; EULAR, European League Against Rheumatism; MTX, methotrexate.
Figure 6
Figure 6
(A) 12-month radiographic outcome of patients stratified according to pauci-immune-fibroid/diffuse-myeloid versus lympho-myeloid pathotypes. (B) Volcano plot of pretreatment genes differentially expressed between patients who progress radiographically after 1 year (ΔSHSS≥1); P values were from the two-sample t-test comparing the progressors and nonprogressors without adjustment. In all, 46 genes with p value <0.05 are highlighted in red. (C–E) Baseline eigengene values versus radiographic progression. Lymphoid (C), myeloid (D) and pauci-immune-fibroid (E) baseline scores are plotted against progression status (ΔSHSS≥1) at 1 year. **p<0.01 by t-test. (F–G) Identification of clinical and gene expression features predictive of radiographic progression at 1 year. Logistic regression, coupled with backward stepwise model selection, was applied to baseline clinical parameters against a dependent variable of radiographic progression or not at 12 months to select which clinical covariate contributed the most to the prediction; 16 baseline clinical covariates were considered as candidates in the regression model. Baseline variables included gender, age, disease duration, ESR, CRP, RF titre, ACPA titre (as continuous variables), VAS, tender and swollen joint number, baseline DAS28-ESR, EULAR response at 6 months (categorical), baseline HAQ, 12 max US ST and US PD scores and baseline pathotype (two categories: lympho-myeloid versus pauci-immune-fibroid/diffuse-myeloid). Stepwise variable selection yielded a model with eight clinical variables: baseline RF titre, disease duration, VAS, swollen joint number, DAS28-ESR, baseline pathotype, 12 max US ST and US PD scores. Selected covariates (46 genes plus 8 clinical covariates) were entered simultaneously into a logistic model with an L1 regularisation penalty (LASSO) in order to determine the optimal sparse prediction model. We have a better predictive performance of the model where clinical variables were penalised (F, blue-dashed line) than when they were not penalised (F, red-dotted line). (G) Nonzero weights associated with the final variables selected by the LASSO regression. ACPA, anti-citrullinated peptide antibodies; CRP, C-reactive protein; CXCL13, C-X-C motif-chemokine-13; DAS28-ESR, disease activity score-28-erythrocyte sedimentation rate; EULAR, European League Against Rheumatism; HAQ, Health Assessment Questionnaire; JSN, joint space narrowing; LASSO, least absolute shrinkage and selection operator; MMP-10, matrix metalloproteinase-10; RF, rheumatoid factor; SHSS, van der Heijde modified Sharp score; SJ, swollen joints; US ST, ultrasound synovial thickening; US PD, ultrasound power Doppler; VAS, visual analogue scale.

Comment in

References

    1. McInnes IB, Schett G. Pathogenetic insights from the treatment of rheumatoid arthritis. Lancet 2017;389:2328–37. 10.1016/S0140-6736(17)31472-1 - DOI - PubMed
    1. Dennis G, Holweg CTJ, Kummerfeld SK, et al. . Synovial phenotypes in rheumatoid arthritis correlate with response to biologic therapeutics. Arthritis Res Ther 2014;16 10.1186/ar4555 - DOI - PMC - PubMed
    1. Pitzalis C, Kelly S, Humby F. New learnings on the pathophysiology of RA from synovial biopsies. Curr Opin Rheumatol 2013;25:334–44. 10.1097/BOR.0b013e32835fd8eb - DOI - PubMed
    1. Mandelin AM, Homan PJ, Shaffer AM, et al. . Transcriptional profiling of synovial macrophages using minimally invasive ultrasound-guided synovial biopsies in rheumatoid arthritis. Arthritis Rheumatol 2018;70:841–54. 10.1002/art.40453 - DOI - PMC - PubMed
    1. Orange DE, Agius P, DiCarlo EF, et al. . Identification of three rheumatoid arthritis disease subtypes by machine learning integration of synovial histologic features and RNA sequencing data. Arthritis Rheumatol 2018;70:690–701. 10.1002/art.40428 - DOI - PMC - PubMed

Publication types

MeSH terms