. 2019 Apr 2;116(7):1328-1339.
doi: 10.1016/j.bpj.2019.02.013. Epub 2019 Feb 26.

A Nondimensional Model Reveals Alterations in Nuclear Mechanics upon Hepatitis C Virus Replication

Affiliations

A Nondimensional Model Reveals Alterations in Nuclear Mechanics upon Hepatitis C Virus Replication

Sreenath Balakrishnan et al. Biophys J. .

Abstract

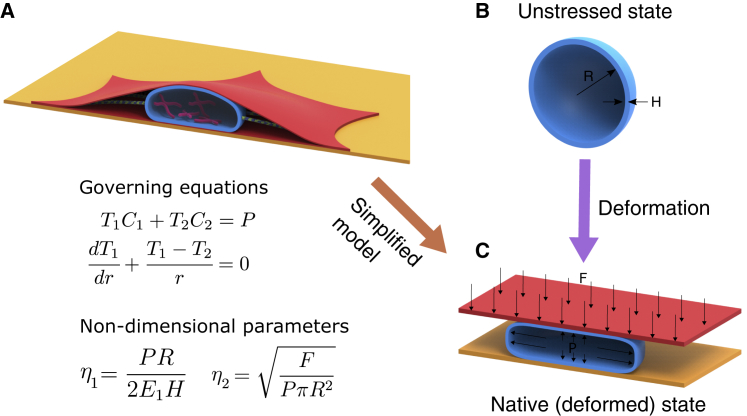
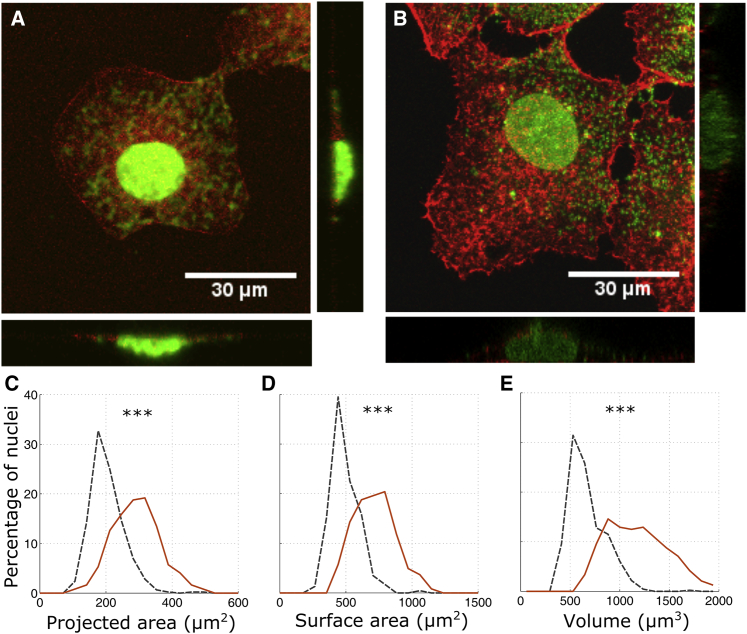
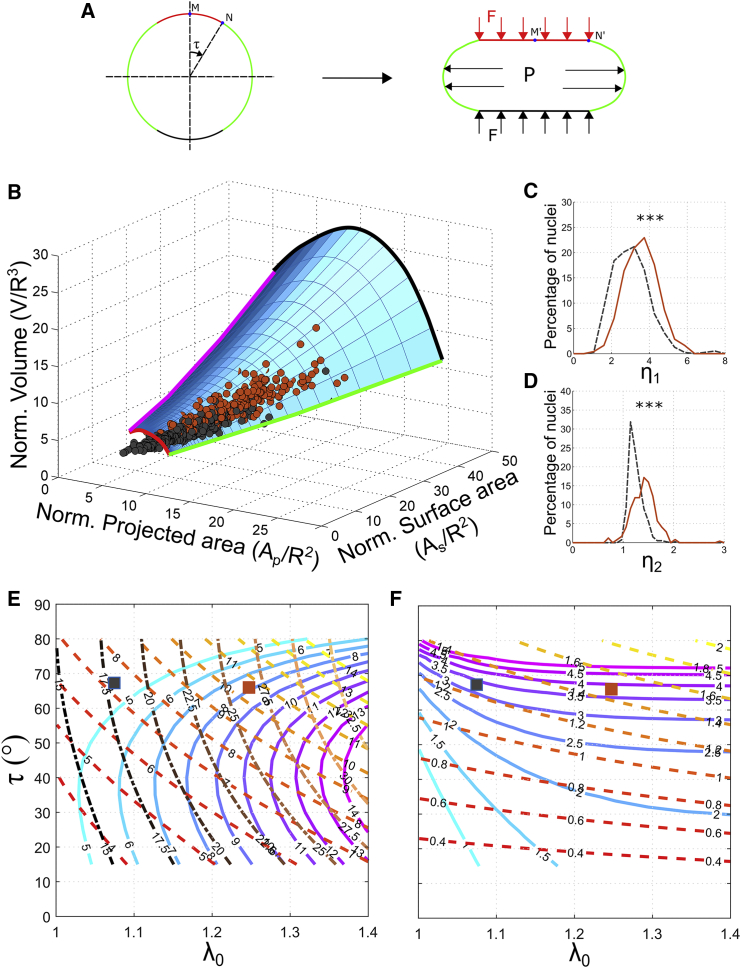
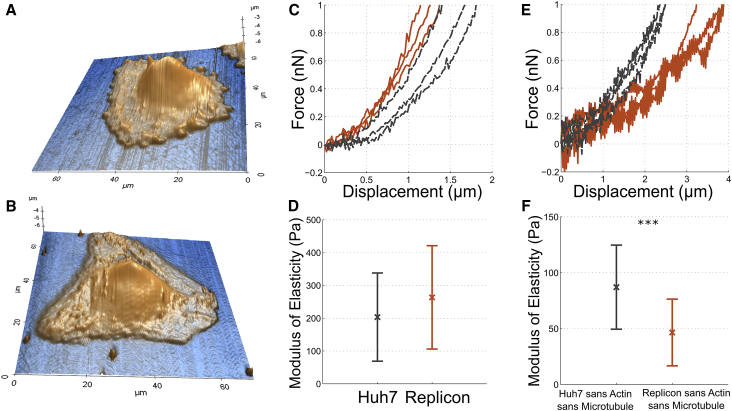
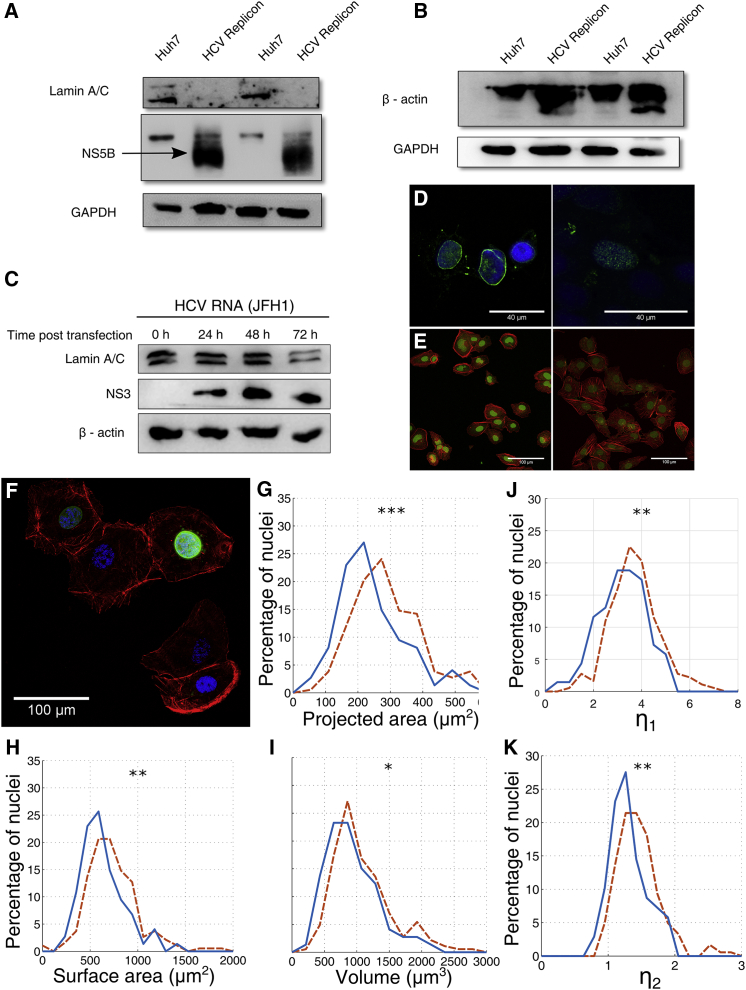
Morphology of the nucleus is an important regulator of gene expression. Nuclear morphology is in turn a function of the forces acting on it and the mechanical properties of the nuclear envelope. Here, we present a two-parameter, nondimensional mechanical model of the nucleus that reveals a relationship among nuclear shape parameters, such as projected area, surface area, and volume. Our model fits the morphology of individual nuclei and predicts the ratio between forces and modulus in each nucleus. We analyzed the changes in nuclear morphology of liver cells due to hepatitis C virus (HCV) infection using this model. The model predicted a decrease in the elastic modulus of the nuclear envelope and an increase in the pre-tension in cortical actin as the causes for the change in nuclear morphology. These predictions were validated biomechanically by showing that liver cells expressing HCV proteins possessed enhanced cellular stiffness and reduced nuclear stiffness. Concomitantly, cells expressing HCV proteins showed downregulation of lamin-A,C and upregulation of β-actin, corroborating the predictions of the model. Our modeling assumptions are broadly applicable to adherent, monolayer cell cultures, making the model amenable to investigate changes in nuclear mechanics due to other stimuli by merely measuring nuclear morphology. Toward this, we present two techniques, graphical and numerical, to use our model for predicting physical changes in the nucleus.


Figures

Figure 1
Figure 1
A mechanical model for nuclear morphology. (A) Nuclear envelope (blue) is shaped by forces from the nucleoplasm and cytoplasm. These forces are mainly due to cortical actin (red), microtubules (green), chromatin (pink), and an osmotic pressure difference between the nucleoplasm and cytoplasm. (B) In the absence of forces, the nucleus is assumed to be a spherical membrane of radius R and thickness H. (C) The net contribution from osmotic pressure, microtubules, and chromatin is assumed to be an inflating pressure P. The force due to cortical actin, F, is assumed to be originating from a flat plate that is pushing down on the nucleus. The equations of equilibrium of the membrane in the normal and tangential directions are shown. T1 and T2 are the forces per unit length in the principal directions, and C1 and C2 are the principal curvatures. The solutions to the equations depend only on two nondimensional parameters, η1 and η2. To see this figure in color, go online.
Figure 2
Figure 2
Morphology of the nuclei of Huh7 and HCV replicon cells. Shown are confocal images of Huh7 (A) and HCV replicon cells (B) stained for actin in red and nucleus in green. Shown is the probability distribution of projected area (C), surface area (D), and volume (E) of the nuclei of Huh7 (black, dashed lines, n = 461) and HCV replicon cells (red, solid lines, n = 246). Nuclei of HCV replicon cells have larger projected area, surface area, and volume in comparison to the nuclei of Huh7 cells. ∗∗∗ indicates p < 0.001 by two-tailed Kolmogrov-Smirnov test. To see this figure in color, go online.
Figure 3
Figure 3
Nondimensional mechanical model of nuclear morphology. (A) The spherical nuclear envelope is deformed by two forces: 1) an inflating pressure P and 2) a force F due to cortical actin. The force from cortical actin is assumed to be arising from a flat plate that is pushing down on the nucleus. Contact between actin and the nuclear envelope in the deformed state is along the red, horizontal line on the top of the nucleus. The corresponding region in the undeformed configuration is also marked in red. Points N and N′ are the boundary of the contact region in the undeformed and deformed configurations, respectively. The angle subtended by N with the axis of symmetry is the contact angle τ. The stretch at the apex point of the nucleus, M′, is λ0. (B) Blue surface represents a relationship among the normalized projected area, surface area, and volume of individual nuclei as predicted by the model. Black and red dots are the experimentally measured morphologies of the nuclei of Huh7 and HCV replicon cells, respectively. Almost all individual nuclei lie on the surface predicted by the model. The different boundaries of the surface are marked. Red and black curves are the lower and higher limits, respectively, of the initial stretch λ0. Magenta and green curves are the lower and higher limits, respectively, of the contact angle τ. Probability distributions of the nondimensional parameters η1 (C) and η2 (D) obtained from the experimentally measured nuclear morphologies are shown in Fig. 2. η1 and η2 are significantly larger for HCV replicon cells (red, solid lines) in comparison to Huh7 cells (black, dashed lines). ∗∗∗p < 0.001 by two-tailed Kolmogorov-Smirnov test. (E) Shown are contour curves of normalized volume (solid lines colored blue to magenta), normalized projected area (dashed lines colored red to yellow), and normalized surface area (dash-dot lines colored dark to light brown) as a function of λ0 and τ. (F) Shown are contour curves of η1 (solid lines colored blue to magenta) and η2 (dashed lines colored red to yellow) as a function of λ0 and τ. By using these contour plots, η1 and η2 for any nuclei can be obtained as follows. From the volume, projected area, and surface area of a nucleus, calculate the normalized volume, projected area, and surface area using Eq. 2 by assuming R. From these normalized nuclear shape parameters, obtain λ0 and τ using the contour plot in (E). η1 and η2 can now be obtained from λ0 and τ using the contour plot in (F). To illustrate the method, we have plotted the mean nuclear morphology of Huh7 (black square) and HCV replicon (red square) cells on (E and F). To see this figure in color, go online.
Figure 4
Figure 4
Mechanical characterization of Huh7 and HCV replicon cells using AFM. Shown is the topography of Huh7 (A) and HCV replicon cells (B) by contact mode imaging. Sample F-d curves (C) and apparent elastic modulus (D) of Huh7 (black, dashed lines, n = 21) and HCV replicon (red, solid lines, n = 23) cells are shown. Sample F-d curves (E) and apparent modulus of elasticity (F) of Huh7 cells (black, dashed lines, n = 34) and HCV replicon cells (red, solid lines, n = 20) with actin and microtubule depolymerized. ∗∗∗p < 0.001 by one-tailed Student’s t-test. To see this figure in color, go online.
Figure 5
Figure 5
Downregulation of lamin-A,C by HCV. (A) Lamin-A,C levels in HCV replicon cells and (B) β-actin levels in HCV replicon cells are shown. (C) Shown is the change in lamin-A,C level with time for Huh7 cells transfected with HCV RNA. (D) Immunofluorescence of Huh7 cells (left) and Huh7 cells transfected with HCV RNA (right) was performed. Nucleus is stained in blue by DAPI and lamin-A,C in green. (E) Shown is the immunofluorescence of Huh7 cells (left) and HCV replicon cells (right) stained for nucleus in green and actin in red. (F) HCV replicon cells were transfected with lamin-A-GFP overexpression construct. Nucleus is stained in blue, actin in red, and lamin-A-GFP in green. Shown are the probability distributions of the projected area (G), surface area (H), and volume (I) of the nuclei of HCV replicon (red, dashed lines, n = 192) and HCV replicon cells expressing lamin-A,C-GFP (blue, solid lines, n = 74). Probability distributions of the nondimensional parameters η1 (J) and η2 (K) were obtained from the nuclear morphologies in (GI). η1 and η2 are significantly larger for HCV replicon cells (reddashed lines) in comparison to those overexpressing lamin-A (blue, solid lines). p < 0.05, ∗∗p < 0.01, and ∗∗∗p < 0.001 by two-tailed Kolmogrov-Smirnov test. To see this figure in color, go online.

References

    1. Cao X., Moeendarbary E., Shenoy V.B. A chemomechanical model for nuclear morphology and stresses during cell transendothelial migration. Biophys. J. 2016;111:1541–1552. - PMC - PubMed
    1. Pajerowski J.D., Dahl K.N., Discher D.E. Physical plasticity of the nucleus in stem cell differentiation. Proc. Natl. Acad. Sci. USA. 2007;104:15619–15624. - PMC - PubMed
    1. Denais C.M., Gilbert R.M., Lammerding J. Nuclear envelope rupture and repair during cancer cell migration. Science. 2016;352:353–358. - PMC - PubMed
    1. Makhija E., Jokhun D.S., Shivashankar G.V. Nuclear deformability and telomere dynamics are regulated by cell geometric constraints. Proc. Natl. Acad. Sci. USA. 2016;113:E32–E40. - PMC - PubMed
    1. Irianto J., Pfeifer C.R., Discher D.E. Nuclear lamins in cancer. Cell. Mol. Bioeng. 2016;9:258–267. - PMC - PubMed

Publication types

LinkOut - more resources