. 2019 May 8;102(3):653-667.e6.
doi: 10.1016/j.neuron.2019.02.028. Epub 2019 Mar 14.

The Paraventricular Hypothalamus Regulates Satiety and Prevents Obesity via Two Genetically Distinct Circuits

Affiliations

The Paraventricular Hypothalamus Regulates Satiety and Prevents Obesity via Two Genetically Distinct Circuits

Monica M Li et al. Neuron. .

Abstract

SIM1-expressing paraventricular hypothalamus (PVH) neurons are key regulators of energy balance. Within the PVHSIM1 population, melanocortin-4 receptor-expressing (PVHMC4R) neurons are known to regulate satiety and bodyweight, yet they account for only half of PVHSIM1 neuron-mediated regulation. Here we report that PVH prodynorphin-expressing (PVHPDYN) neurons, which notably lack MC4Rs, function independently and additively with PVHMC4R neurons to account for the totality of PVHSIM1 neuron-mediated satiety. Moreover, PVHPDYN neurons are necessary for prevention of obesity in an independent but equipotent manner to PVHMC4R neurons. While PVHPDYN and PVHMC4R neurons both project to the parabrachial complex (PB), they synaptically engage distinct efferent nodes, the pre-locus coeruleus (pLC), and central lateral parabrachial nucleus (cLPBN), respectively. PB-projecting PVHPDYN neurons, like PVHMC4R neurons, receive input from interoceptive ARCAgRP neurons, respond to caloric state, and are sufficient and necessary to control food intake. This expands the CNS satiety circuitry to include two non-overlapping PVH to hindbrain circuits.


Conflict of interest statement

DECLARATION OF INTERESTS

The authors declare no competing interests.

Figures
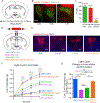
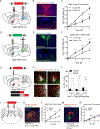
Figure 1.
Figure 1.. PVHPDYN neurons are a MC4R-negative satiety population that accounts for the missing 50% of PVHSIM1 neuron-mediated satiety
(A) Schematic of Mc4r-T2A-Cre::Ai9-Rosa26-LSL-TdTom::Pdyn-EGFP mouse. (B) Representative histological sections of the PVH from rostral to caudal (MC4R::TdTOM=red, PDYN-EGFP=green, double labeled=yellow) (C) Quantification MC4R::TdTOM+, PDYN-EGFP+ vs. double labeled neurons summed across the rostra-caudal extent of the PVH (n=4). (D) Schematic of AAV-DIO-hM4Di injection in the PVH of Sim1-IRES-Cre, Mc4r-T2A-Cre, Pdyn-IRES-Cre, or compound Pdyn-IRES-Cre::Mc4r-T2A-Cre mice. (E) Representative images of hM4Di-mCherry expression in PVHSIM1, PVHMC4R, PVHPDYN, and PVHPDYN::MC4R neurons in the PVH. (F) Light-cycle cumulative food intake in sated mice following saline vs. CNO/hM4Di inhibition of PVHSIM1, PVHMC4R, PVHPDYN and PVHPDYN::MC4R neurons. PVHSIM1 n=6: Repeated Measures (RM) 2 way ANOVA Time F(3,15)=87.43 ****P<0.0001, Treatment F(1,5)=243.8 ****P<0.00001, Interaction F(3,15)=57.22. Sidak’s Multiple Comparisons: Saline vs. CNO ****P<0.00001 at 1,2,3 hours. PVHMC4R n=7: RM 2 way ANOVA Time F(3,18)=23.47 ****P<0.0001. Treatment F(1,6)=109.4 ****P<0.0001, Interaction F(3,18)=23.01, ****P<0.0001, Sidak’s Multiple Comparisons: Saline vs. CNO **P<0.01 at hour 1, ****P<0.0001 at hour 2,3. PVHPDYN n=5: RM 2 way ANOVA Time F (3,12)=26.03 ****P<0.0001, Treatment F(1,4)=50.07 ***P<0.001, Interaction F(3,12)=34.47 ****P<0.0001. Sidak’s Multiple Comparisons: Saline vs. CNO ****P<0.0001 at hours 1,2,3. PVHPDYN::MC4R n=5: RM 2 way ANOVA Time F(3,12)=135. 4 ****P<0.0001, Treatment F(1,4)=245.9 *****P<0.0001, Interaction F(3,12)=88.51 ****P<0.0001, Sidak’s Multiple Comparisons: Saline vs. CNO ****P<0.0001 at hours 1,2,3. (G) Same data at the 3 hour time point quantified as change in food intake (CNO-Saline). ANOVA F(3, 18) = 25.87 ****P<0.0001, Tukey’s Multiple Comparisons between groups: PVHSIM1 vs. PVHMC4R ****P<0.0001, PVHSIM1 vs. PVHPDYN ****P>0.0001, PVHMC4R vs. PVHPDYN:MC4R ***P<0.001, PVHPDYN vs. **PVHPDYN::MC4R P<0.01, PVHPDYN::MC4R vs. PVHSIM1 N.S., PVHMC4R vs. PVHPDYN NS. Data are represented as mean ± SEM.
Figure 2.
Figure 2.. PVHPDYN neurons prevent obesity independent of and additive with PVHMC4R neurons.
(A) Schematic of AAVDJ-CMV-DIO-eGFP-2A-TeNT (Tetanus Toxin) injection in the PVH of Mc4r-T2A-Cre, Pdyn-IRES-Cre, or compound PDYN-IRES-Cre::Mc4r-T2A-Cre mice and experimental timeline. (B) Representative histological images from of eGFP2A-TeNT expression in PVHPDYN, PVHMC4R, and PVHPDYN::MC4R neurons in the PVH (C) Average daily food intake of animals of each genotype in the week prior to injection of AAV vs. after 4 weeks of synaptic silencing with AAV-DIO-TeNT. GFP n=6, MC4R n=7, PDYN n=11, PDYN::MC4R n=5. Repeated Measures (RM) 2Way ANOVA: Time Pre or post AAV injection: F (1, 20) = 41.28, ****P<0.0001, Sidak’s post hoc comparisons pre vs. post injection: GFP N.S., MC4R **P<0.01, PDYN **P<0.01 PDYN::MC4R **P<0.01. (D) Body weight of the same animals prior to injection of AAV and after injection, monitored biweekly for 4.5 weeks. Repeated Measures (RM) 2Way ANOVA: Time F (11, 297) = 149.45, ****P<0.0001. Group F(3,27)=6.816, **P<0.01. Interaction (F33,297)=14.83 ****P<0.0001. Sidak’s post hoc comparisons for each group: BW at X week post injection vs. baseline BW: GFP N.S. at all time points, MC4R ****P<0.0001 from1.5 weeks onwards, PDYN ****P<0.0001 from 1.5 weeks onward, PDYN::MC4R ****P<0.0001 from 1 week onward. Sidak’s post hoc comparisons between genotype groups at 4.5 weeks: GFP vs. MC4R, PDYN or MC4R::PDYN ****<P<0.0001, MC4R or PDYN vs. PDYN::MC4R ****P<0.0001, PDYN vs MC4R N.S. Data are represented as mean ± SEM.
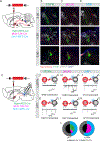
Figure 3.
Figure 3.. PVHPDYN neurons and PVHMC4R neurons share a similar projection profile in the PB, but synaptically engage different effector nodes: pLC vs. cLPBN
(A) Schematic of AAV-DIO-Syp-mCherry injections in the PVH of Pdyn-IRES-Cre, Mc4r-T2A-Cre or Sim1-IRES-Cre for anterograde tracing. (B-D) Axonal projection profiles of above PVH satiety populations in the parabrachial complex (PB) from rostral to caudal (Syp-mCherry=red co-labeled with immunohistochemistry for choline-acetyltransferase (ChAT) =grey and tyrosine hydroxylase (TH) = green). TH marks locus coeruleus (LC) neurons while TH and ChAT mark the transition from cLPBN to eLPBN. (E) Schematic of CRACM experiments to assay connectivity between PVHPDYN, PVHMC4R or PVHSIM1 neurons and downstream neurons in the pLC vs. cLPBN compartments of the PB. (F-K) Schematic and representative monosynaptic light-evoked excitatory current traces and connectivity from (F-G) PVHPDYN neurons to the pLC (n=4 mice) and to cLPBN (n=6 mice) (H-I) PVHMC4R neurons to pLC (n=3 mice), cLPBN (n=3 mice) and (J-K) PVHSIM1 neurons to pLC (n=3 mice) and cLPBN (n=3 mice) (L) Summary of the connectivity of PVHMC4R vs. PVHPDYN neurons to pLC or cLPBN compared to connectivity of PVHSIM1 neurons in both pLC and cLPBN. Data are represented as mean ± SEM.
Figure 4.
Figure 4.. PB-projecting PVHPDYN neurons respond to caloric state and receive input from ARCAgRP neurons
(A) Schematic for FOS assay of neuronal activity in PB-projecting PVHPDYN neurons in different caloric states. CTB retrolabeling of PB-projecting PVHPDYN neurons in Pdyn-IRES-Cre::Ai9-Rosa26-LSL-TdTom mice and experimental paradigm to manipulate caloric state. (B) Representative images of the PVH from rostral to caudal (PDYN::TdTOM+ neurons=red, retrolabeled with immunohistochemistry for CTB CTB=grey and FOS=green. Insets show high-magnification images corresponding to boxed region. (C) Quantification of the % of FOS+ neurons out of all PB-projecting PVHPDYN across the rostral-caudal extent of the PVH n= 4–5 per group, RM 2 way ANOVA, PVH location and interaction= NS. Caloric state: F(1,7)=601.8, *****P<0.0001, Sidak’s Multiple Comparisons: Fasted vs. Refed at 3 locations within PVH AP-0.60 *P<0.05, AP-0.90 ***P<0.001, AP-1.20**P<0.01. (D) Schematic of CRACM experiment assaying connectivity of ARCAgRP neurons to PVHPDYN neurons in Agrp-IRES-Cre::PDYN-EGFP mice with circuit specific CTB-555 retrolabeling from the entire PB, the pLC only or the LPBN only. (E) Representative images of PDYN-GFP expressing neurons retrolabeled with CTB-555 across the rostral-caudal extent of the PVH (PDYN-EGFP=green, CTB-555=red, double-labeled=yellow) (F-I) Schematic and representative monosynaptic light-evoked inhibitory current traces and connectivity between ARCAgRP neurons and downstream PVHPDYN neurons with or without circuit specificity: (F) ARCAgRP➔randomly selected PVHPDYN neurons (n=3 mice) (G) ARCAgRP➔PB-projecting PVHPDYN neurons (n=2 mice) (H) ARCAgRP ➔pLC-projecting PVHPDYN neurons (n=2 mice) (I) ARCAgRP ➔LPBN-projecting PVHPDYN neurons (n=1 mouse) (J) Summary of above CRACM connectivity data from ARCAgRP ➔PVHPDYN neurons with or without circuit specificity. Data are represented as mean ± SEM.
Figure 5.
Figure 5.. PB-projecting PVHPDYN neurons are both sufficient and necessary for satiety, likely via downstream effector node pLC, a novel satiety-regulating site
(A) Schematic of optogenetic terminal stimulation of the PVHPDYN➔PB circuit: AAV-DIO-ChR2-mCherry injection into the PVH of Pdyn-IRES-Cre mice and optical fiber delivery of 463nm light in the PB (B) Representative image of ChR2-mCherry expression in PVHPDYN neurons and their axon projection field in the PB with optical fiber placement over the PB. (C) Dark-cycle cumulative food intake over 3 hours during light off vs. light on terminal stimulation trials n=10 mice, RM 2 Way ANOVA Time F(3, 27)= 70.53 ****P<0.0001, Treatment F(1, 9)=70.53 ****P<0.0001, Interaction F(3, 27)=29.92 ****P<0.0001, Sidak’s Multiple Comparisons: Saline vs. CNO **P<0.01 at hour 1, ****P<0.0001 at hours 2 and 3. (D) Schematic of optogenetic terminal inhibition of PVHPDYN PB: AAV-DIO-ArchT-GFP injection into the PVH of Pdyn-IRES-Cre mice and optical fiber delivery of 532nm light in the PB (E) Representative image of ArchT-GFP expression in PVHPDYN neurons and their axon projection field in the PB with optical fiber placement over the PB (F) Light-cycle cumulative food intake over 3 hours during light off vs. light on terminal inhibition trials n=6, RM 2 way ANOVA Time F(3,15)= 90.23 ****P<0.0001, Treatment F(1, 5)= 90.23 ****P<0.0001, Interaction F(3,15) =21.88 ****P<0.0001. Sidak’s multiple comparisons: Saline vs. CNO ***P<0.001 at 1,2 hours, ****P<0.0001 at hour 3. (G) Schematic of AAV-DIO-Syp-mCherry guided fasted vs. refed FOS assay in the pLC projection field of PVHPDYN neurons (H) Representative images of FOS+ neurons (green) in the pLC axon projection field of PVHPDYN neurons (red) co-labeled with TH (grey) in fasted vs. refed states at low (top) and high (bottom) magnification (I) Quantification of the number of FOS+ cells in the pLC of mice sacrificed in the fasted vs. refed states across the rostral-caudal extent of the PVHPDYN pLC projection field n=5 per group. RM 2 way ANOVA Bregma level and Interaction NS, Caloric state: F(1,8)=299.9 ****P<0.0001, Sidak’s multiple comparisons: Fasted vs. Refed at each level of the pLC ****P<0.0001. (J) Schematic of chemogenetic inhibition experiment of the pLC with injection of AAV-hM4Di-mCherry in the pLC of wild type mice. (K) Representative image of GROUP 1 animals: histological cases with hM4Di-mCherry expression in the pLC (with spill over in i,d,vLPBN) (L) GROUP 1: Light-cycle cumulative food intake after saline vs. CNO treatment of animals with the above histology n=5, Time F(3,12)= 58.76 ****P<0.0001, Treatment F(1,4) =72.75 ** P<0.01, Interaction F(3,12)= 28.54 ****P<0.0001. Sidaks Multiple Comparisons: Saline vs. CNO: *P<0.05 at 1 hour, ****P<0.0001 at 2,3 hours (M) Representative image of GROUP 2 animals: histological cases with hM4Di-mCherry in i,d,vLPBN expression only, but not pLC (N) GROUP2: Light-cycle cumulative food intake after Saline vs. CNO treatment of animals with this histology n=4, RM 2 way ANOVA F(1,3) NS. Data are represented as mean ± SEM.

Comment in

Similar articles

Cited by

References

    1. An JJ, Liao G-Y, Kinney CE, Sahibzada N, and Xu B (2015). Discrete BDNF Neurons in the Paraventricular Hypothalamus Control Feeding and Energy Expenditure. Cell Metab. 22, 175–188. - PMC - PubMed
    1. Andermann ML, and Lowell BB (2017). Toward a Wiring Diagram Understanding of Appetite Control. Neuron 95, 757–778. - PMC - PubMed
    1. Anthony TE, Dee N, Bernard A, Lerchner W, Heintz N, and Anderson DJ (2014). Control of stress-induced persistent anxiety by an extra-amygdala septohypothalamic circuit. Cell 156, 522–536. - PMC - PubMed
    1. Aponte Y, Atasoy D, and Sternson SM (2011a). AGRP neurons are sufficient to orchestrate feeding behavior rapidly and without training. Nature Publishing Group; 14, 351–355. - PMC - PubMed
    1. Atasoy D, Betley JN, Su HH, and Sternson SM (2012). Deconstruction of a neural circuit for hunger. Nature 488, 172–177. - PMC - PubMed

Publication types

MeSH terms