. 2019 Apr 4;177(2):326-338.e16.
doi: 10.1016/j.cell.2019.02.021. Epub 2019 Mar 14.

Per-Nucleus Crossover Covariation and Implications for Evolution

Affiliations

Per-Nucleus Crossover Covariation and Implications for Evolution

Shunxin Wang et al. Cell. .

Abstract

Crossing over is a nearly universal feature of sexual reproduction. Here, analysis of crossover numbers on a per-chromosome and per-nucleus basis reveals a fundamental, evolutionarily conserved feature of meiosis: within individual nuclei, crossover frequencies covary across different chromosomes. This effect results from per-nucleus covariation of chromosome axis lengths. Crossovers can promote evolutionary adaptation. However, the benefit of creating favorable new allelic combinations must outweigh the cost of disrupting existing favorable combinations. Covariation concomitantly increases the frequencies of gametes with especially high, or especially low, numbers of crossovers, and thus might concomitantly enhance the benefits of crossing over while reducing its costs. A four-locus population genetic model suggests that such an effect can pertain in situations where the environment fluctuates: hyper-crossover gametes are advantageous when the environment changes while hypo-crossover gametes are advantageous in periods of environmental stasis. These findings reveal a new feature of the basic meiotic program and suggest a possible adaptive advantage.

Keywords: chromosome axis legngth; chromosome loops; crossover; crossover covariation; crossover variance; evolution of recombination; evolution of sex; genome-wide recombination rate; meiosis; recombination.


Conflict of interest statement

Declaration of Interests

The authors declare no competing interests.

Figures
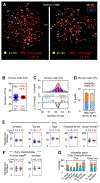
Figure 1.
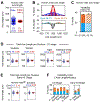
Figure 1.. Per-nucleus analysis of COs.
(A) Human male pachytene nuclei immunostained for chromosome axis (SYCP3; red), CO recombination complexes (MLH1; yellow) and centromeres (CREST, blue) for 22 autosomes. Left and right panels illustrate nuclei with longer axes and more COs (left) or shorter axes and fewer COs (right). Images provided by F. Sun. See also Figure S1A–D. (B-G): over-dispersed distribution of total COs per nucleus and resultant hyper- and hypo-CO nuclei. (B, C top). Experimental distribution of total CO number per nucleus in human male pachytene nuclei (blue; n=755) is compared with the distribution predicted if COs were determined independently on different chromosomes (the hypothesis of independence for in silico nuclei; text; red). Solid lines are best-fit normal distributions (C top; details in Figure S2A). The difference between these two distributions defines the frequencies of hypo- and hyper-CO nuclei (C bottom; blue, orange). (D) The sum of the frequencies of hypo-CO (blue) and hyper-CO (orange) nuclei is defined as the variability index (VI), determined from the data (left) and the corresponding normal distributions (right; Figure S2A). (E, G left) Comparisons as in (B) for COs in the five indicated organisms. **Female data come from DNA sequencing. (F, G right) Comparisons as in (B, D, E) for early intermediates in the two indicated organisms. ## Data are available only for chromosomes 13, 14, 15, 21 and 22. Data sources and details of statistical analysis are given in STAR Methods. For human male, Sordaria, tomato, tiger, elephant shrew, and human female at CO stages, and human male and Sordaria at early intermediate stages, n = 755, 94, 111, 59, 63, 69, 36 and 26, respectively. Error bars indicate SD (B, E, F) or SE (D, G). See also Figures S1–S3.
Figure 2.
Figure 2.. Experimental documentation of per-nucleus covariation of COs.
(A,B) For the six organisms analyzed for COs in Figure 1, the numbers of CO foci in single individual nuclei are correlated for two matched groups of chromosomes (e.g. odd vs even chromosomes in panel A left) and on pairs of individual chromosomes (B) for all possible combinations. (C) Human male nuclei with high, medium and low total CO numbers exhibit the same hierarchy for all 22 autosomes. (D) For the two organisms analyzed for early intermediates in Figure 1, the numbers of CO foci in single individual nuclei are correlated for two matched groups of chromosomes. (E) Simulations (STAR Methods) confirm that stronger per-nucleus co-variation of COs gives increased variation in the total number of COs per nucleus (defined by CV). Sample sizes as in Figure 1. Error bars = SE (A-right and B). Data sources and details of statistical analysis are given in STAR Methods. See also Figures S1–S2.
Figure 3.
Figure 3.. Over-dispersed distribution of total axis lengths per nucleus.
Panels (A-F) are exactly analogous to panels (B-G) of Figure 1 except that they pertain to axis lengths at the CO and early intermediate stages rather than the corresponding recombination events. ## Data are available only for chromosomes 13, 14, 15, 21 and 22. Sample sizes as in Figure 1. See also Figures S1–S2.
Figure 4.
Figure 4.. Experimental documentation of per-nucleus covariation of axis lengths.
Panels (A-D) are exactly analogous to panels (A-D) of Figure 2 except that they pertain to axis lengths at the CO and early intermediate stages rather than the corresponding recombination events. Sample sizes as in Figure 1. Data sources and details of statistical analysis are given in STAR Methods. See also Figures S1–S2.
Figure 5.
Figure 5.. Simulation analysis shows that intrinsic variation and covariation of axis lengths can quantitatively explain per-nucleus covariation of COs in human male.
Recombination event patterns were predicted by an enhanced simulation analysis that parameterizes both intrinsic variation and covariation of chromosome axis lengths (text; STAR Methods). For human male COs, simulation using the experimentally-defined values for both of these parameters perfectly predicts all experimentally-observed features including the CV of total COs per nucleus (Panel A, green versus blue) and the three per-nucleus correlations in CO numbers on grouped and/or individual chromosomes as described in Figure 2AB and Figure S2B (Panel C, green versus blue). Moreover, simulation using the experimentally-defined axis variation but zero axis-length co-variation perfectly predicts the outcome of the “hypothesis of independence” (text) (Panel A, purple vs red). Correspondingly, predicted levels of hyper-CO (orange) and hypo-CO (blue) nuclei and the corresponding VI exactly match those defined from experimental data (B). Data sources and details of statistical analysis are given in STAR Methods. See also Figures S1–S3.
Figure 6.
Figure 6.. Mathematical modelling demonstrates the evolutionary advantage of crossover covariation.
(A) CO covariation causes an overproduction of hypo-CO and hyper-CO gametes, which, respectively, increase the frequencies of offspring with trait values very close to, and very far from, the parental value. (B) When the environment does not change, offspring with trait values near the parental value are favored, and thus covariation is favored. (C) When the environment changes substantially, offspring with trait values far from the parental value become favored, and thus covariation is again favored. (D) Only when the environment changes a little is covariation disfavored. (E) The selective advantage of covariation is revealed formally in a four locus population genetic model with a fluctuating environment. CO covariation enjoys a selective advantage in all scenarios. The selective advantage of covariation increases with p, the probability that each environmental change favors hyper-CO gametes with COs between both locus pairs. However, covariation is favored even when p = 0, so that environmental changes always favor gametes with a CO between only one locus pair, and thus always disfavor covariation. Here, the benefit of covariation derives from its overproduction of hypo-CO gametes in the periods of stasis between environmental changes. (F,G) Consistent with this logic, when p = 0, the advantage of covariation grows as the average period of stasis, T, grows. (H) The advantage to covariation increases monotonically with the degree of covariation. See also Figures S4–S6

References

    1. Anderson LK, Lohmiller LD, Tang X, Hammond DB, Javernick L, Shearer L, Basu-Roy S, Martin OC, Falque M (2014). Combined fluorescent and electron microscopic imaging unveils the specific properties of two classes of meiotic crossovers. Proc Natl Acad Sci USA. 111, 13415–13420. - PMC - PubMed
    1. Barton NH (1995). A general model for the evolution of recombination. Genetics Research 65(2), 123–144. - PubMed
    1. Barton NH, Charlesworth B (1998). Why sex and recombination? Science 281, 1986–1990. - PubMed
    1. Bell G (1982). The masterpiece of nature: the evolution and genetics of sexuality. University of California Press; (Berkeley and Los Angeles: ).
    1. Brandvain Y, Kenney AM, Flagel L, Coop G, Sweigart AL (2014). Speciation and introgression between Mimulus nasutus and Mimulus guttatus. PLoS Genet. 10, e1004410. - PMC - PubMed

Publication types

LinkOut - more resources