. 2019 Apr 4;177(2):256-271.e22.
doi: 10.1016/j.cell.2019.02.014. Epub 2019 Mar 14.

Multi-sensory Gamma Stimulation Ameliorates Alzheimer's-Associated Pathology and Improves Cognition

Affiliations

Multi-sensory Gamma Stimulation Ameliorates Alzheimer's-Associated Pathology and Improves Cognition

Anthony J Martorell et al. Cell. .

Abstract

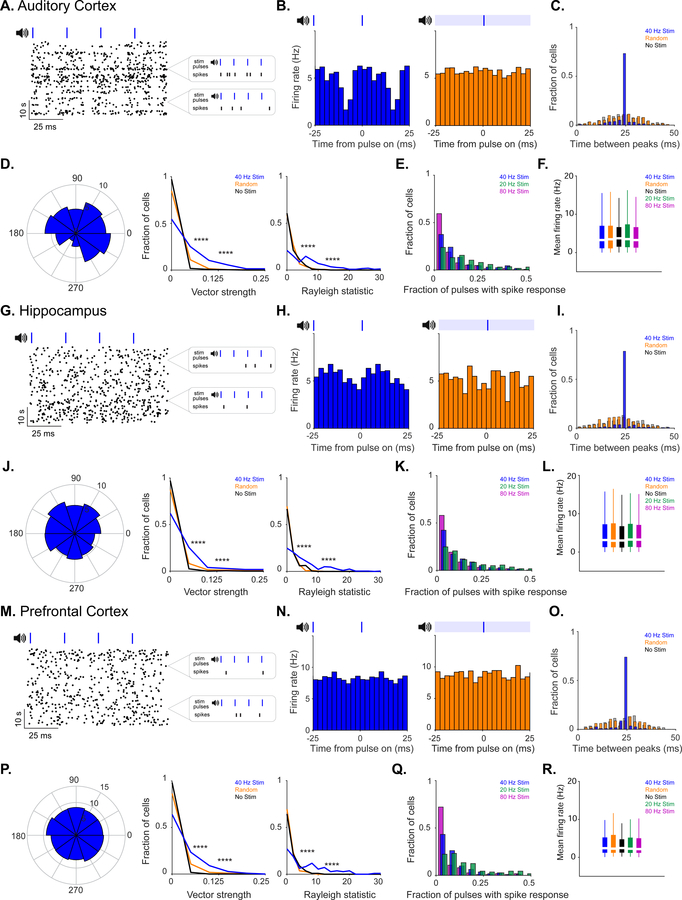
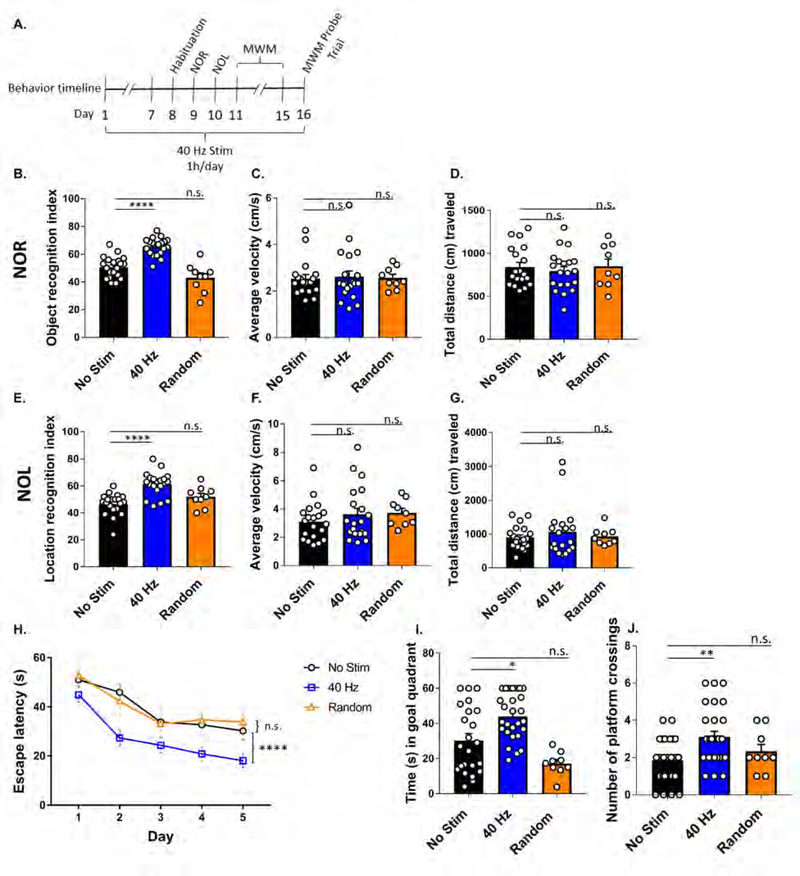
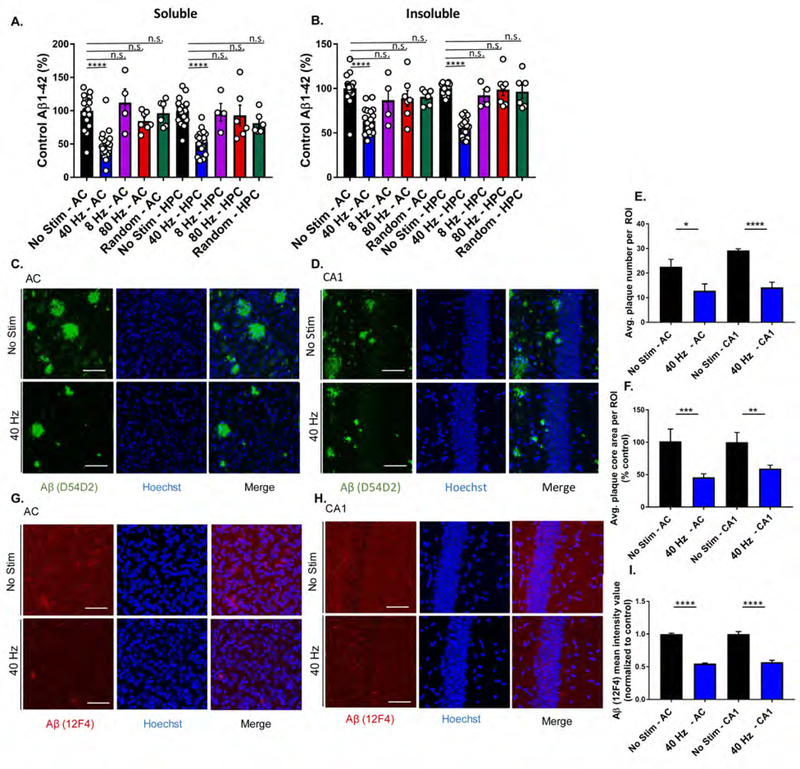
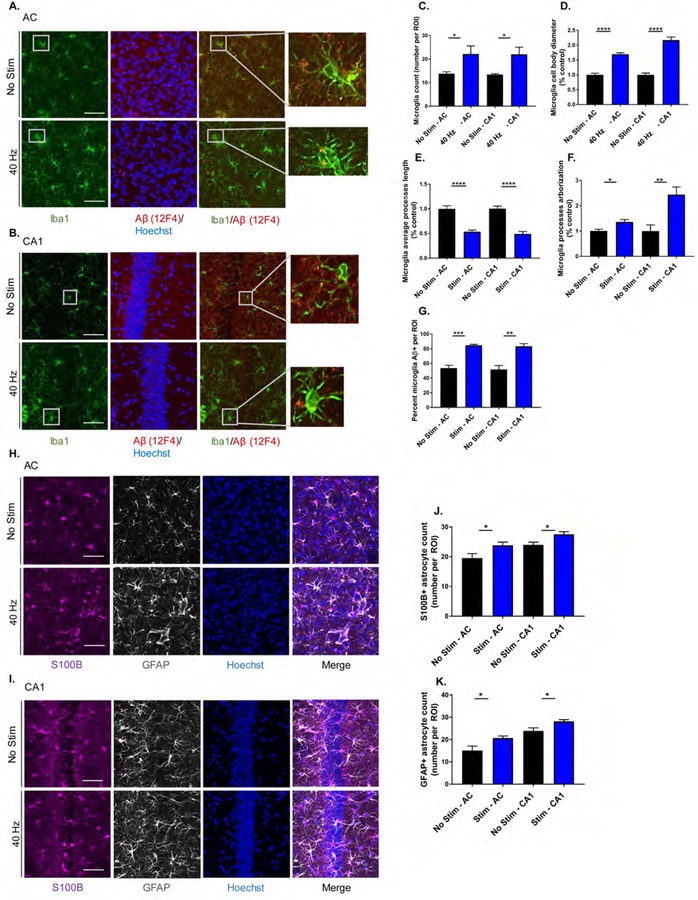
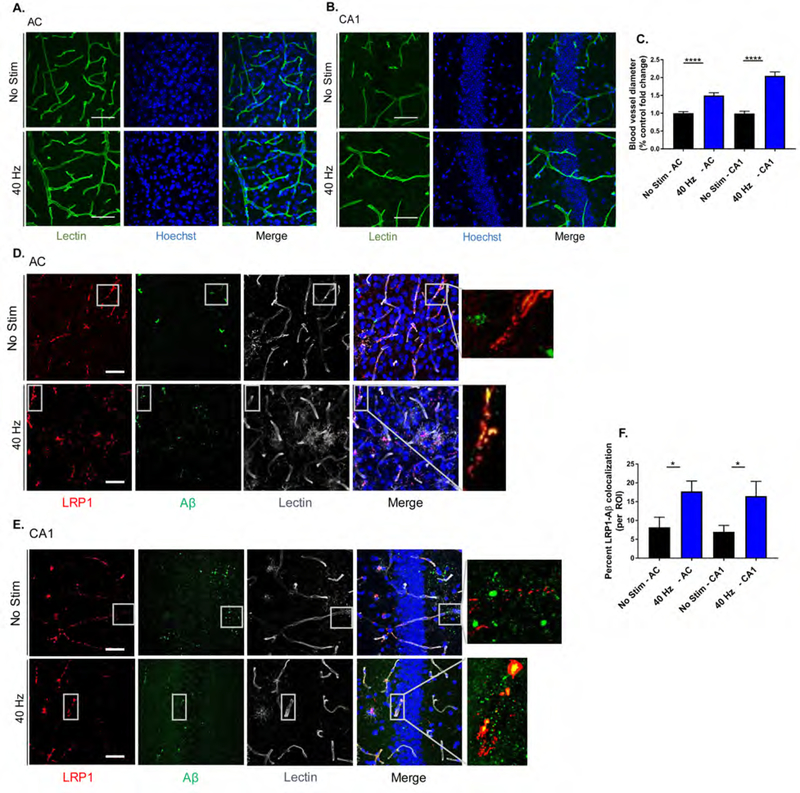
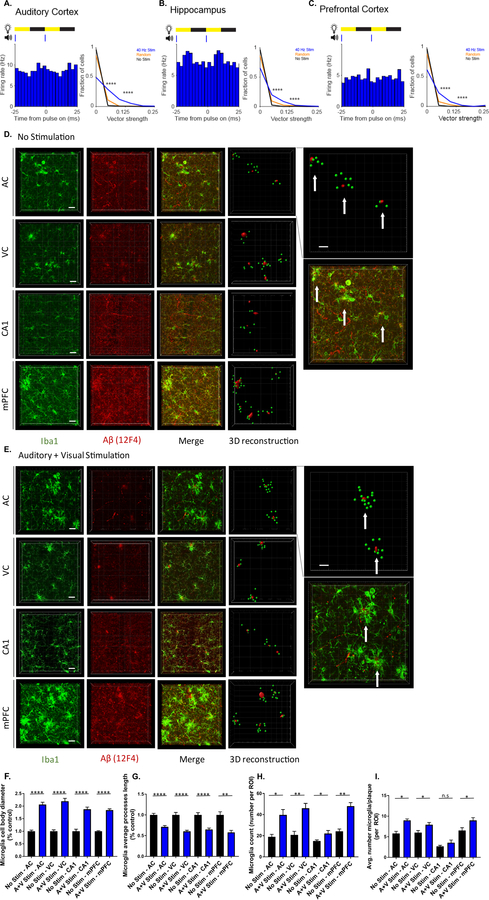
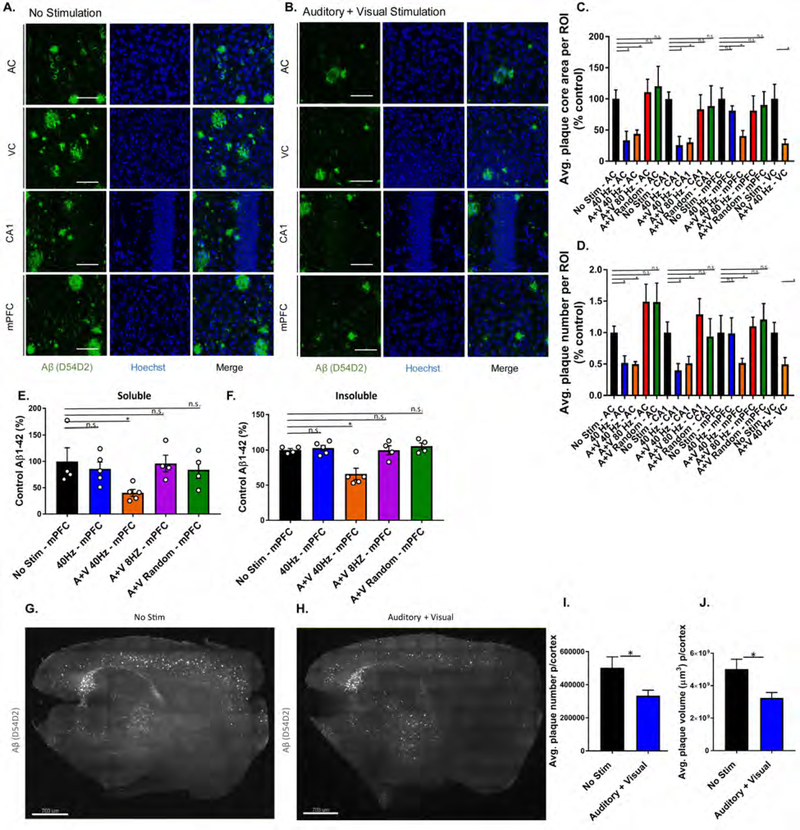
We previously reported that inducing gamma oscillations with a non-invasive light flicker (gamma entrainment using sensory stimulus or GENUS) impacted pathology in the visual cortex of Alzheimer's disease mouse models. Here, we designed auditory tone stimulation that drove gamma frequency neural activity in auditory cortex (AC) and hippocampal CA1. Seven days of auditory GENUS improved spatial and recognition memory and reduced amyloid in AC and hippocampus of 5XFAD mice. Changes in activation responses were evident in microglia, astrocytes, and vasculature. Auditory GENUS also reduced phosphorylated tau in the P301S tauopathy model. Furthermore, combined auditory and visual GENUS, but not either alone, produced microglial-clustering responses, and decreased amyloid in medial prefrontal cortex. Whole brain analysis using SHIELD revealed widespread reduction of amyloid plaques throughout neocortex after multi-sensory GENUS. Thus, GENUS can be achieved through multiple sensory modalities with wide-ranging effects across multiple brain areas to improve cognitive function.

Keywords: Alzheimer’s disease; acoustic stimulation; amyloid; astrocytes; cognition; gamma rhythms; memory; microglia; photic stimulation; vasculature.


Conflict of interest statement

Conflict of Interest

L.-H.T. and E.S.B are co-Scientific Founders and serve on the scientific advisory board of Cognito Therapeutics and A.C.S. owns shares of Cognito Therapeutics Inc.

Figures

Figure 1.
Figure 1.. 40 Hz auditory stimulation modulates spiking activity in AC, CA1, and mPFC
A. Example putative single unit spiking response to 40 Hz auditory stimulation with many 10 second stimulation blocks shown wrapped every 100 ms, left. Examples of spiking response to four consecutive pulses, right. B. Firing rate modulation of unit shown in A during 40 Hz auditory (blue) and random stimulation (orange) in AC. Blue ticks, auditory pulses; light blue bar, randomly distributed pulses. C. Intervals between peaks in firing rate in AC for no (grey, labeled no stim), random (orange, labeled random), and 40 Hz auditory stimulation (dark blue, labeled 40 Hz stim) conditions for all single units (n = 292 units in 9 recording sessions in 5 mice. Proportion of intervals around inter-stimulus interval: P = 0 40 Hz vs. No stim, P = 0 40 Hz vs. Random; z-Test for two proportions. For all statistics reported, results are significant after controlling for multiple comparisons using the Bonferroni correction unless otherwise stated). D. Example polar plot of firing rate modulation relative to stimulus onset during 40 Hz auditory stimulation (left, stimulus onset at 0), vector strengths of single unit firing rate modulation during 40 Hz auditory, random, and no stimulation (center, ****P<0.00005 40 Hz vs. No Stim, 40 Hz vs. Random; Kolmogorov-Smirnov test; 9 units had 40 Hz stim VS values greater than 0.25; 6 units had random stim VS values greater than 0.25), and Rayleigh statistic values of single unit firing rate modulation (right, ****P<0.00005 40 Hz vs. No Stim, 40 Hz vs. Random; Kolmogorov-Smirnov test; 40 units had 40 Hz stim RS values greater than 30; 2 units had random stim RS values greater than 30). E. Fraction of pulses with spiking response from single units in AC for 20 Hz, 40 Hz, and 80 Hz auditory stimulation. F. Mean firing rates between stimulation conditions in AC. G. Same as A for CA1. H. Same as B for CA1. I. Same as C for CA1 (n = 338 units in 10 recording sessions in 5 mice. P = 0 40 Hz vs. No stim, P = 0 40 Hz vs. Random; z-Test for two proportions). J. Same as D for CA1 (center, ****P<0.00005 40 Hz vs. No Stim, 40 Hz vs. Random; Kolmogorov-Smirnov test; 11 units and 2 units had VS values > 0.25 during 40 Hz or random, respectively; right, ****P<0.00005 40 Hz vs. No Stim, 40 Hz vs. Random; Kolmogorov-Smirnov test; 7 units had 40 Hz stim RS values > 30). K. Same as E for CA1. L. Same as F for CA1. M. Same as A for mPFC. N. Same as B for mPFC. O. Same as C for mPFC (n = 115 units in 7 recording sessions in 4 mice. P = 0 40 Hz vs. No stim, P = 0 40 Hz vs. Random; z-Test for two proportions). P. Same as D for mPFC (center, ****P<0.00005 40 Hz vs. No Stim, 40 Hz vs. Random; Kolmogorov-Smirnov test; right, ****P<0.00005 40 Hz vs. No Stim, 40 Hz vs. Random; Kolmogorov-Smirnov test; 2 units had 40 Hz stim RS values > 30). Q. Same as E for mPFC. R. Same as F for mPFC.
Figure 2.
Figure 2.. Auditory GENUS improves recognition and spatial memory tasks in 5XFAD mice
A. Timeline of behavior experiments. B. Recognition index of novel object recognition (NOR) test (n=20 mice no stim [black], n=20 mice 40 Hz [blue], n=9 random frequency [orange], ****P<0.0001, Kruskal-Wallis (KW) test with Dunn’s multiple comparison test). C. Average velocity (cm/s) during novel object recognition test (n=20 mice no stim, n=20 mice 40 Hz, n=9 random frequency, KW-test with Dunn’s multiple comparison test). D. Total distance (cm) traveled during novel object recognition test (n=20 mice no stim, n=20 mice 40 Hz, n=9 random frequency, KW-test with Dunn’s multiple comparison test). E. Recognition index of novel object location (NOL) test of 5XFAD auditory GENUS mice (n=20 mice no stim, n=20 mice 40 Hz, n=9 random frequency, ****P<0.0001, KW-test with Dunn’s multiple comparison test). F. Average velocity (cm/s) during novel object location test (n=20 mice no stim, n=20 mice 40 Hz, n=9 random frequency, KW-test with Dunn’s multiple comparison test). G. Total distance (cm) traveled during novel object location test (n=20 mice no stim, n=20 mice 40 Hz, n=9 random frequency, KW-test with Dunn’s multiple comparison test). H. Escape latencies (s) of 5XFAD mice in the Morris Water Maze (n=25 mice no stim, n=28 mice 40 Hz, n= 9 random frequency, ****P<0.0001, 2-way ANOVA with Tukey’s multiple comparison test). I. Time (s) spent swimming in the goal quadrant during the probe trial (n=25 mice no stim, n=28 mice 40 Hz, n= 9 random frequency, *P<0.05, KW-test with Dunn’s multiple comparison test). J. Number of platform crossings during probe trial (n=25 mice no stim, n=28 mice 40 Hz, n= 9 random frequency, **P<0.01, KW-test with Dunn’s multiple comparison test). Circles indicate ‘n’, mean +/− s.e.m. in bar graphs unless otherwise noted, n.s. = not significant.
Figure 3.
Figure 3.. Auditory GENUS reduces amyloid load in AC and HPC in 5XFAD mice
A. Relative soluble Aβ1–42 levels in AC and HPC in 6-month-old 5XFAD mice following 40 Hz, 8 Hz, 80 Hz, or random auditory stimulation for 1 hr/day for 7 days (1-week), normalized to non-stimulation control (n=19 mice no stim, n=19 mice 40 Hz, n=4 mice 8 Hz, n=7 80 Hz, n=6 random frequency, ****P<0.0001, KW-test with Dunn’s multiple comparison test). B. As in A for insoluble Aβ1–42. C. Immunohistochemistry with anti-Aβ (D54D2, green) antibody in 6-month-old AC of 5XFAD mice after auditory GENUS or no stimulation, for 1 week (n=7 mice/group, scale bar, 50 µm). D. As in C for CA1. E. Average number of Aβ-positive plaques in AC and CA1 (n=7 mice/group, *P<0.05, ****P<0.0001; unpaired Mann-Whitney Test). F. Average area of Aβ-positive plaques in AC and CA1 (n=7 mice/group, **P<0.01, ***P<0.001; unpaired Mann-Whitney Test). G. Immunohistochemistry with anti-Aβ (12F4, red) antibody in 6-month-old AC of 5XFAD mice after auditory GENUS or no stimulation, for 1 week (Inset, 20x, scale bar, 50 µm). H. As in G for CA1. I. Aβ (12F4) mean intensity value (12F4 antibody) normalized to non-stimulated controls (n=7 mice/ group, ****P<0.0001, unpaired Mann-Whitney Test). Circles indicate ‘n’, mean +/− s.e.m. in bar graphs unless otherwise noted, n.s. = not significant.
Figure 4.
Figure 4.. Auditory GENUS induces glial response in AC and CA1 in 5XFAD mice
A. Immunohistochemistry with anti-Iba1 (019–19741, green) and anti-Aβ (12F4, red) antibodies in AC of 5XFAD mice after 7 days of 1 hr/day (1-week) no stimulation or auditory GENUS (n=8 mice/ group, scale bar, 50 µm). B. As in A for CA1 C. Number of Iba1-positive microglia in AC and CA1 (n=8 mice/group, *P<0.05; unpaired Mann-Whitney (MW) Test). D. Diameter of Iba1-positive microglia cell bodies in AC and CA1 normalized to non-stimulated controls (n=8 mice/group, ****P<0.0001; unpaired MW-Test). E. Average length of Iba1-positive microglia primary processes in AC and CA1 normalized to non-stimulated controls (n=8 mice/group, ****P<0.0001; unpaired MW-Test). F. Average processes arborization of Iba1-positive microglia in AC and CA1 normalized to non-stimulated controls (n=8 mice/ group, *P<0.05, **P<0.01; unpaired MW-Test). G. Percentage of Iba1-positive microglia cell bodies that are also Aβ-positive in AC and CA1 (n=8 mice/group, **P<0.01, ***P<0.001; unpaired MW-Test). H. Immunohistochemistry with anti-S100B (ab868, purple) and anti-GFAP (ab4674, grey) antibodies in AC of 5XFAD mice after 1-week no stimulation or auditory GENUS (n=8 per group, scale bar, 50 µm). I. As in H for CA1. J. Number of S100B-positive astrocytes in AC and CA1 (n=8 mice/group, *P<0.05; unpaired MW-Test). K. As in J for GFAP-positive astrocytes. Circles indicate ‘n’, mean +/− s.e.m. in bar graphs unless otherwise noted, n.s. = not significant.
Figure 5.
Figure 5.. Auditory GENUS increases amyloid-vasculature associations.
A. Immunohistochemistry with lectin stain (DL-1174, green) in AC of 6-month-old 5XFAD mice after 7 days of 1 hr/day (1-week) no stimulation or auditory GENUS (scale bar, 50 µm). B. As in A for CA1. C. Percent fold change in blood vessel diameter in AC and CA1 of 6-month-old 5XFAD mice after 1-week no stimulation or auditory GENUS, normalized to no stimulation control (n=7 mice/group, ****P<0.0001; unpaired Mann-Whitney (MW) Test). D. Immunohistochemistry with anti-LRP1 (28320, red), anti-Aβ (AB9234, green), and lectin stain (DL-1174, gray) antibodies in AC of 6-month-old 5XFAD mice after 1-week no stimulation or auditory GENUS (n=8 mice/group, scale bar, 50 µm). E. As in D for CA1. F. Percentage of Aβ-LRP1 co-localization in AC and CA1 of 5XFAD mice after 1-week no stimulation or auditory GENUS (n=8 mice/group, *P<0.05; unpaired MW-test). Circles indicate ‘n’, mean +/−s.e.m. in bar graphs unless otherwise noted, n.s. = not significant.
Figure 6.
Figure 6.. Combined auditory and visual GENUS induces a clustering phenotype response by microglia
A. Firing rate modulation of a single unit during 40 Hz audio-visual stimulation (left). Vector strength of responses to 40 Hz A+V stimulation, random A+V stimulation, and no stimulation periods (right, ****P<0.00005 40 Hz vs. No Stim, 40 Hz vs. Random; Kolmogorov-Smirnov test; 9 units had 40 Hz stim VS values greater than 0.25; 3 units had random stim VS values greater than 0.25. In all statistical tests for panels A-C, results are significant after controlling for multiple comparisons using the Bonferroni correction unless otherwise stated). B. Same as A for CA1 (right, ****P<0.00005 40 Hz vs. No Stim, 40 Hz vs. Random; Kolmogorov-Smirnov test; 8 units and 3 units had VS values > 0.25 for 40 Hz or random stim, respectively). C. Same as A for mPFC (right, ****P<0.00005 40 Hz vs. No Stim, 40 Hz vs. Random; Kolmogorov-Smirnov test; 5 units had 40 Hz stim VS values > 0.25). D. Immunohistochemistry and 3D reconstruction using IMARIS (Methods) of anti-Iba1 (019–19741, green) and anti-Aβ (12F4, red) antibodies in AC, VC, CA1, and mPFC of 6-month-old 5XFAD mice after 7 days of 1 hr/day (1-week) of no stimulation (n=6 mice/group, top inset: example of using IMARIS to quantify the number of microglia surrounding a 25 µm radius around amyloid plaques. Plaques as red dots, microglia as green dots, and white arrows point to clusters. Bottom inset: enlarged merged image from AC. Scale bar, 20 µm). E. As in D for combined GENUS. F. Average microglia cell body diameter in AC, VC, CA1, and mPFC of 6-month-old 5XFAD mice after 1-week no stimulation or combined GENUS, normalized to no stimulation control (n=6 mice no stim, n=7 mice combined GENUS, ****P<0.0001; unpaired Mann-Whitney (MW) test). G. Average microglia process length in AC, VC, CA1, and mPFC of 6-month-old 5XFAD mice after 1-week no stimulation or combined GENUS, normalized to no stimulation control (n=6 mice no stim, n=7 mice combined GENUS, **P<0.01, ****P<0.0001; unpaired MW-test). H. Microglia count per region of interest in AC, VC, CA1, and mPFC of 6-month-old 5XFAD mice after 1-week no stimulation or combined GENUS (n=6 mice no stim, n=7 mice combined GENUS, *P<0.05, **P<0.01, unpaired MW-Test). I. Average number of microglia surrounding 25 µm radium of a plaque in AC, VC, CA1, and mPFC following no stimulation or combined GENUS (n=6 mice/group, *P<0.05; unpaired MW-Test). Circles indicate ‘n’, mean +/− s.e.m. in bar graphs unless otherwise noted, n.s. = not significant.
Figure 7.
Figure 7.. Combined auditory and visual GENUS reduces amyloid load in the mPFC and neocortex
A. Immunohistochemistry of anti-Aβ plaques (D54D2, green) antibodies in AC, VC, CA1, and mPFC of 6-month-old 5XFAD mice after 7 days of 1 hr/day (1-week) no stimulation (40x objective, scale bar, 50 µm). B. As in A for combined GENUS. C. Average plaque core area in AC, CA1, mPFC, and VC in 6-month old 5XFAD mice following 1-week no stimulation, 40 Hz auditory stimulation, combined GENUS, combined 80 Hz, and combined random frequency stimulation, normalized to no stimulation control (n=12 mice/group, *P<0.05, Kruskal-Wallis (KW) test with Dunn’s multiple comparison test) D. Average plaque number in AC, CA1, mPFC, and VC in 6-month old 5XFAD mice following 1-week no stimulation, 40 Hz auditory stimulation, combined GENUS, combined 80 Hz, and combined random frequency stimulation, normalized to no stimulation control (n=12 mice/group, *P<0.05, KW-test with Dunn’s multiple comparison test). E. Relative soluble Aβ1–42 levels in mPFC of 6-month-old 5XFAD mice following 1-week 40 Hz auditory stimulation, combined GENUS, combined 8 Hz, or combined random frequency stimulation, normalized to non-stimulation control (n=4–5 mice per group, *P<0.05, KW-test with Dunn’s multiple comparison test). F. As in E for insoluble Aβ1–42 (*P<0.05). G. Immunohistochemistry of SHIELD treated whole brain (sagittal plane of 25 µm section of brain) of anti-Aβ plaques (D54D2, white) antibodies of 6-month-old 5XFAD mice after 1-week no stimulation (light-sheet microscope, scale bar, 700 µm). H. As in G for combined GENUS. I. Average cortical plaque number following no stimulation or combined GENUS (n=6 mice/group, *P<0.05; unpaired MW-Test). G. Average cortical plaque volume (µm3) following combined GENUS (n=6 mice/group, *P<0.05; unpaired MW-Test). Circles indicate ‘n’, mean +/− s.e.m. in bar graphs unless otherwise noted, n.s. = not significant.

Comment in

  • A stimulating approach.
    Yates D. Yates D. Nat Rev Neurosci. 2019 May;20(5):249. doi: 10.1038/s41583-019-0167-8. Nat Rev Neurosci. 2019. PMID: 30940918 No abstract available.
  • Improving cognition.
    Stower H. Stower H. Nat Med. 2019 May;25(5):710. doi: 10.1038/s41591-019-0454-y. Nat Med. 2019. PMID: 31068706 No abstract available.

References

    1. Allen NJ, and Barres BA (2005). Signaling between glia and neurons: focus on synaptic plasticity. Curr Opin Neurobiol 15, 542–548. - PubMed
    1. Aronov D, Nevers R, and Tank DW (2017). Mapping of a non-spatial dimension by the hippocampal-entorhinal circuit. Nature 543, 719–722. - PMC - PubMed
    1. Attwell D, Buchan AM, Charpak S, Lauritzen M, Macvicar BA, and Newman EA (2010). Glial and neuronal control of brain blood flow. Nature 468, 232–243. - PMC - PubMed
    1. Berens P (2009). CircStat: A MATLAB Toolbox for Circular Statistics. Journal of Statistical Software Vol 31, 1–21.
    1. Bero AW, Yan P, Roh JH, Cirrito JR, Stewart FR, Raichle ME, Lee JM, and Holtzman DM (2011). Neuronal activity regulates the regional vulnerability to amyloid-β deposition. Nat Neurosci 14, 750–756. - PMC - PubMed

Publication types