

Cancer mutational burden is shaped by G4 DNA, replication stress and mitochondrial dysfunction
- PMID: 30880007
- PMCID: PMC6745008
- DOI: 10.1016/j.pbiomolbio.2019.03.004
Cancer mutational burden is shaped by G4 DNA, replication stress and mitochondrial dysfunction
Abstract
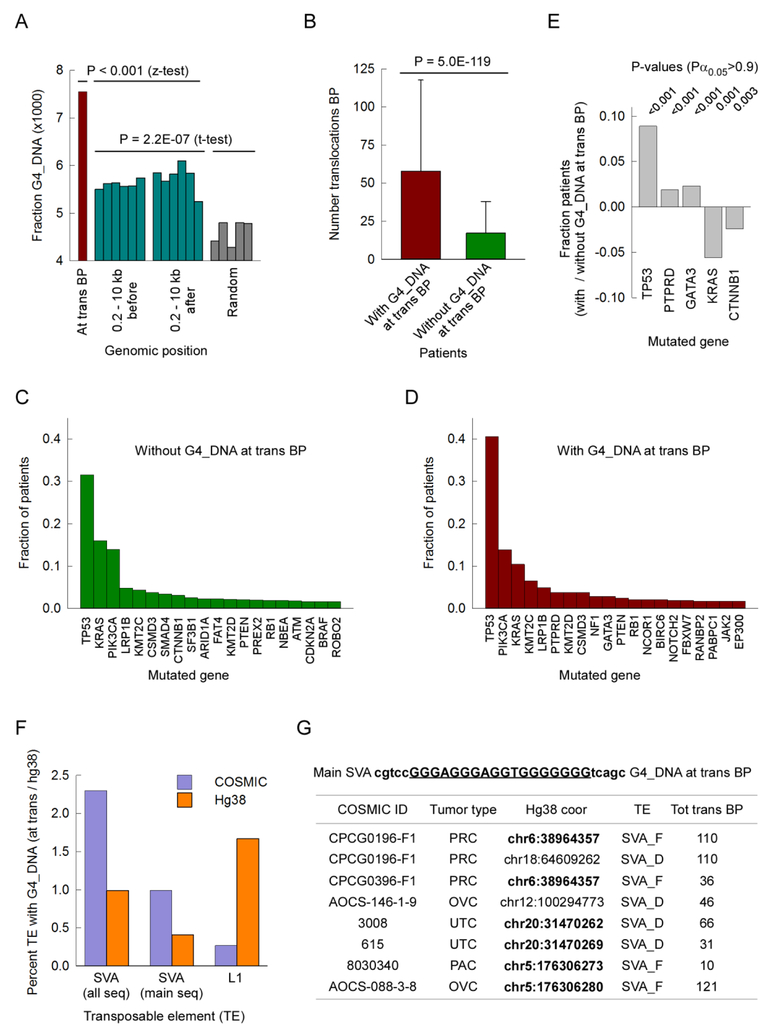
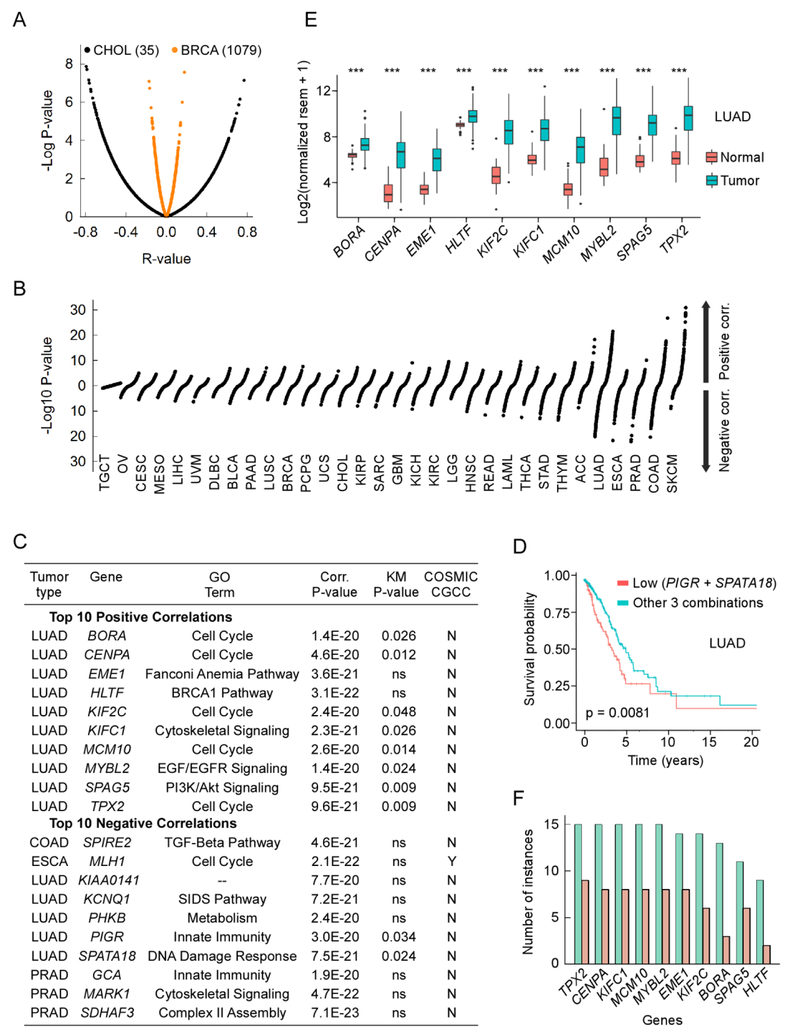
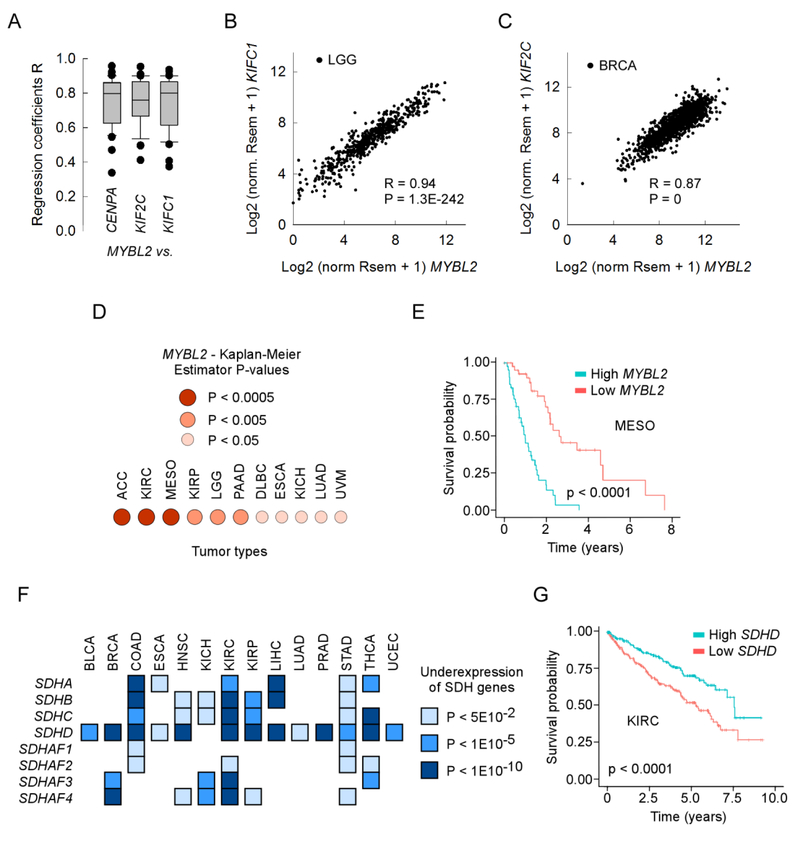
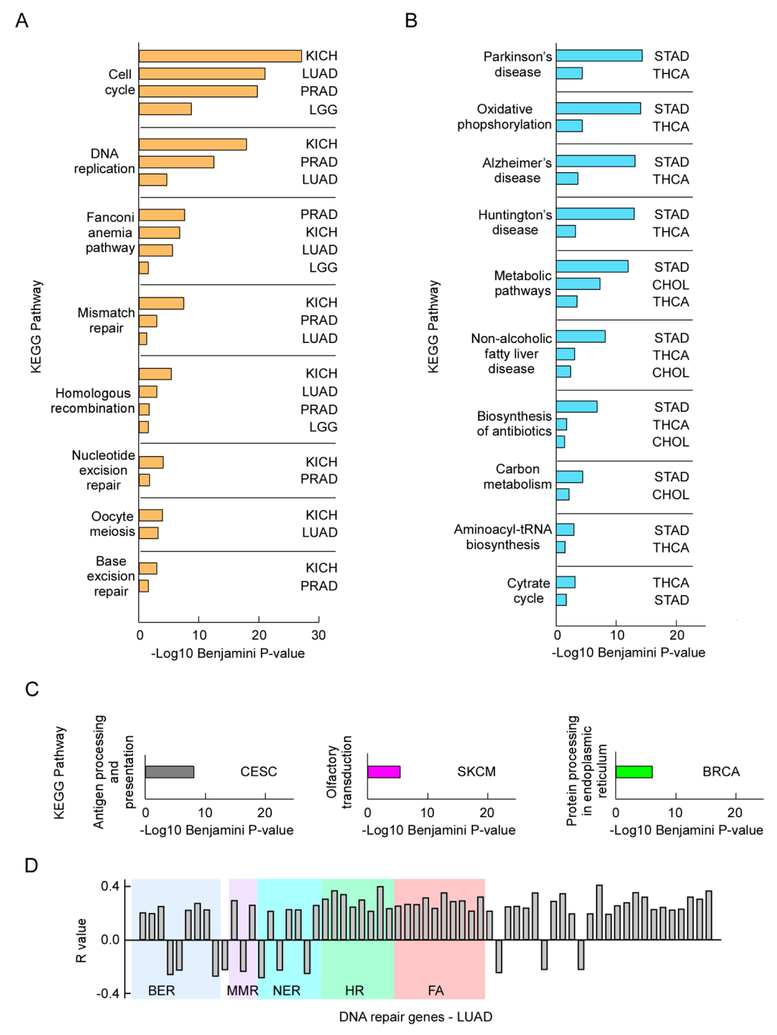
A hallmark of cancer is genomic instability, which can enable cancer cells to evade therapeutic strategies. Here we employed a computational approach to uncover mechanisms underlying cancer mutational burden by focusing upon relationships between 1) translocation breakpoints and the thousands of G4 DNA-forming sequences within retrotransposons impacting transcription and exemplifying probable non-B DNA structures and 2) transcriptome profiling and cancer mutations. We determined the location and number of G4 DNA-forming sequences in the Genome Reference Consortium Human Build 38 and found a total of 358,605 covering ∼13.4 million bases. By analyzing >97,000 unique translocation breakpoints from the Catalogue Of Somatic Mutations In Cancer (COSMIC), we found that breakpoints are overrepresented at G4 DNA-forming sequences within hominid-specific SVA retrotransposons, and generally occur in tumors with mutations in tumor suppressor genes, such as TP53. Furthermore, correlation analyses between mRNA levels and exome mutational loads from The Cancer Genome Atlas (TCGA) encompassing >450,000 gene-mutation regressions revealed strong positive and negative associations, which depended upon tissue of origin. The strongest positive correlations originated from genes not listed as cancer genes in COSMIC; yet, these show strong predictive power for survival in most tumor types by Kaplan-Meier estimation. Thus, correlation analyses of DNA structure and gene expression with mutation loads complement and extend more traditional approaches to elucidate processes shaping genomic instability in cancer. The combined results point to G4 DNA, activation of cell cycle/DNA repair pathways, and mitochondrial dysfunction as three major factors driving the accumulation of somatic mutations in cancer cells.
Keywords: Cancer mutations; G-quadruplexes; Genome instability; Mitochondrial dysfunction; Replication stress; Translocation breakpoints.
Copyright © 2019 The Authors. Published by Elsevier Ltd.. All rights reserved.
Figures
Similar articles
-
Impact of G-Quadruplexes on the Regulation of Genome Integrity, DNA Damage and Repair.Biomolecules. 2021 Aug 27;11(9):1284. doi: 10.3390/biom11091284. Biomolecules. 2021. PMID: 34572497 Free PMC article. Review.
-
ATRX promotes heterochromatin formation to protect cells from G-quadruplex DNA-mediated stress.Nat Commun. 2021 Jun 23;12(1):3887. doi: 10.1038/s41467-021-24206-5. Nat Commun. 2021. PMID: 34162889 Free PMC article.
-
DNA sequences proximal to human mitochondrial DNA deletion breakpoints prevalent in human disease form G-quadruplexes, a class of DNA structures inefficiently unwound by the mitochondrial replicative Twinkle helicase.J Biol Chem. 2014 Oct 24;289(43):29975-93. doi: 10.1074/jbc.M114.567073. Epub 2014 Sep 5. J Biol Chem. 2014. PMID: 25193669 Free PMC article.
-
The Relevance of G-Quadruplexes for DNA Repair.Int J Mol Sci. 2021 Nov 22;22(22):12599. doi: 10.3390/ijms222212599. Int J Mol Sci. 2021. PMID: 34830478 Free PMC article. Review.
-
G-Quadruplex Forming DNA Sequence Context Is Enriched around Points of Somatic Mutations in a Subset of Multiple Myeloma Patients.Int J Mol Sci. 2024 May 12;25(10):5269. doi: 10.3390/ijms25105269. Int J Mol Sci. 2024. PMID: 38791307 Free PMC article.
Cited by
-
Function and Molecular Mechanism of the DNA Damage Response in Immunity and Cancer Immunotherapy.Front Immunol. 2021 Dec 14;12:797880. doi: 10.3389/fimmu.2021.797880. eCollection 2021. Front Immunol. 2021. PMID: 34970273 Free PMC article. Review.
-
Monitoring Nuclease Activity by X-Ray Scattering Interferometry Using Gold Nanoparticle-Conjugated DNA.Methods Mol Biol. 2022;2444:183-205. doi: 10.1007/978-1-0716-2063-2_12. Methods Mol Biol. 2022. PMID: 35290639 Free PMC article.
-
EXO5-DNA structure and BLM interactions direct DNA resection critical for ATR-dependent replication restart.Mol Cell. 2021 Jul 15;81(14):2989-3006.e9. doi: 10.1016/j.molcel.2021.05.027. Epub 2021 Jun 30. Mol Cell. 2021. PMID: 34197737 Free PMC article.
-
A goldilocks computational protocol for inhibitor discovery targeting DNA damage responses including replication-repair functions.Front Mol Biosci. 2024 Nov 28;11:1442267. doi: 10.3389/fmolb.2024.1442267. eCollection 2024. Front Mol Biosci. 2024. PMID: 39669672 Free PMC article.
-
Replication-induced DNA secondary structures drive fork uncoupling and breakage.EMBO J. 2023 Nov 15;42(22):e114334. doi: 10.15252/embj.2023114334. Epub 2023 Oct 2. EMBO J. 2023. PMID: 37781931 Free PMC article.
References
-
- Aldera AP and Govender D, 2018. Gene of the month: SDH. J. Clin. Pathol 71, 95–97. - PubMed
-
- Alexandrov LB, Nik-Zainal S, Wedge DC, Aparicio SA, Behjati S, Biankin AV, Bignell GR, Bolli N, Borg A, Borresen-Dale AL, Boyault S, Burkhardt B, Butler AP, Caldas C, Davies HR, Desmedt C, Eils R, Eyfjord JE, Foekens JA, Greaves M, Hosoda F, Hutter B, Ilicic T, Imbeaud S, Imielinski M, Jager N, Jones DT, Jones D, Knappskog S, Kool M, Lakhani SR, Lopez-Otin C, Martin S, Munshi NC, Nakamura H, Northcott PA, Pajic M, Papaemmanuil E, Paradiso A, Pearson JV, Puente XS, Raine K, Ramakrishna M, Richardson AL, Richter J, Rosenstiel P, Schlesner M, Schumacher TN, Span PN, Teague JW, Totoki Y, Tutt AN, Valdes-Mas R, van Buuren MM, van ‘t Veer L, Vincent-Salomon A, Waddell N, Yates LR, Australian Pancreatic Cancer Genome, I., Consortium, I.B.C., Consortium, I.M.-S., PedBrain, I., Zucman-Rossi J, Futreal PA, McDermott U, Lichter P, Meyerson M, Grimmond SM, Siebert R, Campo E, Shibata T, Pfister SM, Campbell PJ and Stratton MR, 2013. Signatures of mutational processes in human cancer. Nature 500, 415–421. - PMC - PubMed
-
- Bailey MH, Tokheim C, Porta-Pardo E, Sengupta S, Bertrand D, Weerasinghe A, Colaprico A, Wendl MC, Kim J, Reardon B, Ng PK, Jeong KJ, Cao S, Wang Z, Gao J, Gao Q, Wang F, Liu EM, Mularoni L, Rubio-Perez C, Nagarajan N, Cortes-Ciriano I, Zhou DC, Liang WW, Hess JM, Yellapantula VD, Tamborero D, Gonzalez-Perez A, Suphavilai C, Ko JY, Khurana E, Park PJ, Van Allen EM, Liang H, Group MCW, Cancer Genome Atlas Research, N., Lawrence MS, Godzik A, Lopez-Bigas N, Stuart J, Wheeler D, Getz G, Chen K, Lazar AJ, Mills GB, Karchin R and Ding L, 2018. Comprehensive characterization of cancer driver genes and mutations. Cell 173, 371–385 e318. - PMC - PubMed
Publication types
MeSH terms
Substances
Grants and funding
LinkOut - more resources
Full Text Sources
Research Materials
Miscellaneous
