. 2019 May 2;24(5):812-820.e5.
doi: 10.1016/j.stem.2019.02.006. Epub 2019 Mar 14.

Single-Cell Proteomics Reveal that Quantitative Changes in Co-expressed Lineage-Specific Transcription Factors Determine Cell Fate

Affiliations

Single-Cell Proteomics Reveal that Quantitative Changes in Co-expressed Lineage-Specific Transcription Factors Determine Cell Fate

Carmen G Palii et al. Cell Stem Cell. .

Abstract

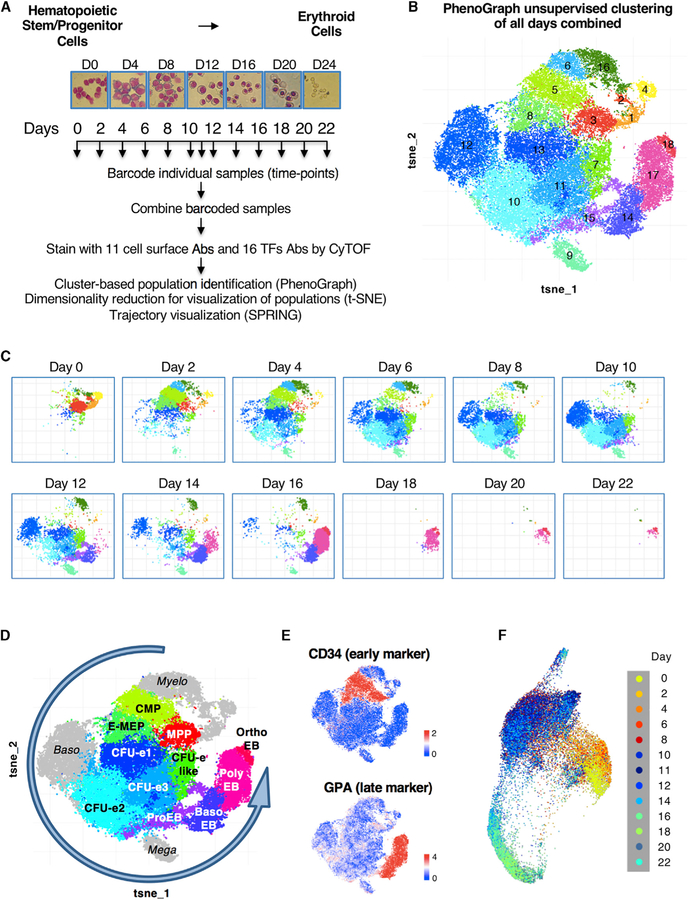
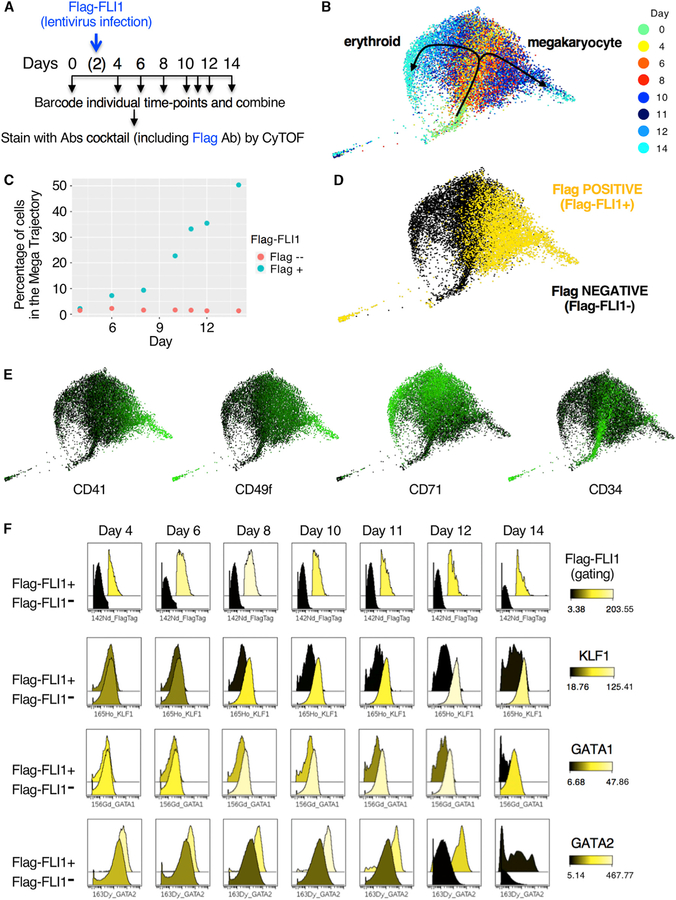
Hematopoiesis provides an accessible system for studying the principles underlying cell-fate decisions in stem cells. Proposed models of hematopoiesis suggest that quantitative changes in lineage-specific transcription factors (LS-TFs) underlie cell-fate decisions. However, evidence for such models is lacking as TF levels are typically measured via RNA expression rather than by analyzing temporal changes in protein abundance. Here, we used single-cell mass cytometry and absolute quantification by mass spectrometry to capture the temporal dynamics of TF protein expression in individual cells during human erythropoiesis. We found that LS-TFs from alternate lineages are co-expressed, as proteins, in individual early progenitor cells and quantitative changes of LS-TFs occur gradually rather than abruptly to direct cell-fate decisions. Importantly, upregulation of a megakaryocytic TF in early progenitors is sufficient to deviate cells from an erythroid to a megakaryocyte trajectory, showing that quantitative changes in protein abundance of LS-TFs in progenitors can determine alternate cell fates.

Keywords: CyTOF; FLI1; KLF1; cell fate; erythropoiesis; hematopoiesis; mass cytometry; proteomics; single cell; transcription.


Conflict of interest statement

DECLARATION OF INTERESTS

The authors declare no competing interests.

Figures

Figure 1.
Figure 1.. Time Course Analysis of Human Erythropoiesis by Mass Cytometry
(A) Schematic of sample collection, temporal barcoding, and mass cytometry analyses. CD34+ HSPCs were isolated from cord blood and differentiated ex vivo along the erythroid lineage. Cells stained with May-Grünwald-Giemsa are shown (magnification 40×). (B) Cell subset identification by unsupervised clustering with the PhenoGraph algorithm. Each dot represents a cell (48,076 cells total). t-stochastic neighbor embedding (t-SNE) plot of colored PhenoGraph clusters is shown. (C) Temporal deconvolution of PhenoGraph clusters. (D) Reconstitution of the human erythroid trajectory based on temporal appearance of PhenoGraph clusters (Figure S1B). MPP → CMP → E-MEP → CFU-e1 → CFU-e2 → ProEB → Baso_EB → Poly_EB → Ortho_EB. Non-erythroid clusters are shown in gray. (E) Expression level plots highlighting the hematopoietic early marker CD34 and the erythroid marker GPA. (F) Single-cell population trends over time visualized by the algorithm SPRING applied to mass cytometry data. Each dot represents a cell (20,314 cells total) and is color coded to indicate the day of identification. See also Figure S1 and Tables S1 and S2.
Figure 2.
Figure 2.. Co-expression of Lineage-Specific Transcription Factors in Individual Bipotential Progenitors
(A) Biaxial dot plots of mass cytometry data showing co-expression of KLF1 (erythroid) and FLI1 (megakaryocytic) proteins in E-MEPs. (B) 2D scatterplots showing gradual changes in KLF1 and FLI1 protein levels in individual cells across time and populations. (C) Ridge plots showing relative expression of KLF1 and FLI1 proteins in temporally ordered cell populations along the erythroid trajectory. (B) and (C) use PhenoGraph cell populations. (D) Biaxial dot plots of mass cytometry data showing co-expression of GATA1 and PU.1 proteins in CMPs. See also Figure S2.
Figure 3.
Figure 3.. KLF1 and FLI1 Protein Levels Change Gradually during Erythropoiesis
(A) Absolute quantification of KLF1 and FLI1 proteins across time by SID-SRM mass spectrometry. (B and C) Representative results showing quantification of the indicated KLF1 (B) and FLI1 (C) peptides. The main picture shows co-eluting peptides—the spiked-in “heavy” standard peptides in blue and the endogenous “light” peptides in red. Inset picture shows specific transitions measured for each light peptide. These transitions are summed to produce the red peak in the main graph.
Figure 4.
Figure 4.. Overexpression of FLI1 in Bipotential Progenitors Is Sufficient to Deviate the Erythroid Trajectory toward a Megakaryocytic Fate
(A) Schematic of sample collection, temporal barcoding, and mass cytometry analyses upon expression of a FLAG-tagged FLI1 protein in early progenitors. (B) Single-cell population trends over time visualized by SPRING applied to CyTOF data. Each dot represents a cell (9,000 cells total), and its color indicates the measured day. (C) Graph indicating the percentage of FLAG-negative and FLAG-positive cells that follows a megakaryocytic path (defined as CD41+) over time. (D) SPRING plot from (B) colored for FLAG expression (yellow for positive; black for negative). (E) SPRING plots from (B) colored for the indicated markers. Coloring scale from black (no expression) to green (high expression) is shown. (F) Cytobank histogram overlays of CyTOF data showing temporal variations in the relative level of each indicated marker in cells expressing FLAG-FLI1 (back histogram) versus FLAG-FLI1-negative cells (front histogram). Peaks are shaded using a color scale based on the raw values of medians for each x axis channel. See also Figures S3 and S4 and Table S3.

Comment in

Similar articles

Cited by

  • Linking GATA2 to myeloid dysplasia and complex cytogenetics in adult myelodysplastic neoplasm and acute myeloid leukemia.
    Robbins DJ, Pavletich TS, Patil AT, Pahopos D, Lasarev M, Polaki US, Gahvari ZJ, Bresnick EH, Matson DR. Robbins DJ, et al. Blood Adv. 2024 Jan 9;8(1):80-92. doi: 10.1182/bloodadvances.2023011554. Blood Adv. 2024. PMID: 38029365 Free PMC article.
  • Transcriptomics and Proteomics Methods for Xenopus Embryos and Tissues.
    Gilchrist MJ, Veenstra GJC, Cho KWY. Gilchrist MJ, et al. Cold Spring Harb Protoc. 2020 Feb 3;2020(2):098350. doi: 10.1101/pdb.top098350. Cold Spring Harb Protoc. 2020. PMID: 31772075 Free PMC article.
  • Coactivator condensation drives cardiovascular cell lineage specification.
    Gan P, Eppert M, De La Cruz N, Lyons H, Shah AM, Veettil RT, Chen K, Pradhan P, Bezprozvannaya S, Xu L, Liu N, Olson EN, Sabari BR. Gan P, et al. Sci Adv. 2024 Mar 15;10(11):eadk7160. doi: 10.1126/sciadv.adk7160. Epub 2024 Mar 15. Sci Adv. 2024. PMID: 38489358 Free PMC article.
  • Generative AI Models in Time-Varying Biomedical Data: Scoping Review.
    He R, Sarwal V, Qiu X, Zhuang Y, Zhang L, Liu Y, Chiang J. He R, et al. J Med Internet Res. 2025 Mar 10;27:e59792. doi: 10.2196/59792. J Med Internet Res. 2025. PMID: 40063929 Free PMC article.
  • A high-stringency blueprint of the human proteome.
    Adhikari S, Nice EC, Deutsch EW, Lane L, Omenn GS, Pennington SR, Paik YK, Overall CM, Corrales FJ, Cristea IM, Van Eyk JE, Uhlén M, Lindskog C, Chan DW, Bairoch A, Waddington JC, Justice JL, LaBaer J, Rodriguez H, He F, Kostrzewa M, Ping P, Gundry RL, Stewart P, Srivastava S, Srivastava S, Nogueira FCS, Domont GB, Vandenbrouck Y, Lam MPY, Wennersten S, Vizcaino JA, Wilkins M, Schwenk JM, Lundberg E, Bandeira N, Marko-Varga G, Weintraub ST, Pineau C, Kusebauch U, Moritz RL, Ahn SB, Palmblad M, Snyder MP, Aebersold R, Baker MS. Adhikari S, et al. Nat Commun. 2020 Oct 16;11(1):5301. doi: 10.1038/s41467-020-19045-9. Nat Commun. 2020. PMID: 33067450 Free PMC article. Review.

References

    1. An X, Schulz VP, Li J, Wu K, Liu J, Xue F, Hu J, Mohandas N, and Gallagher PG (2014). Global transcriptome analyses of human and murine terminal erythroid differentiation. Blood 123, 3466–3477. - PMC - PubMed
    1. Bodenmiller B, Zunder ER, Finck R, Chen TJ, Savig ES, Bruggner RV, Simonds EF, Bendall SC, Sachs K, Krutzik PO, and Nolan GP (2012). Multiplexed mass cytometry profiling of cellular states perturbed by small-molecule regulators. Nat. Biotechnol 30, 858–867. - PMC - PubMed
    1. Bouilloux F, Juban G, Cohet N, Buet D, Guyot B, Vainchenker W, Louache F, and Morlé F (2008). EKLF restricts megakaryocytic differentiation at the benefit of erythrocytic differentiation. Blood 112, 576–584. - PubMed
    1. Bresnick EH, Hewitt KJ, Mehta C, Keles S, Paulson RF, and Johnson KD (2018). Mechanisms of erythrocyte development and regeneration: implications for regenerative medicine and beyond. Development 145, dev151423. - PMC - PubMed
    1. Chen L, Kostadima M, Martens JHA, Canu G, Garcia SP, Turro E, Downes K, Macaulay IC, Bielczyk-Maczynska E, Coe S, et al. (2014). Transcriptional diversity during lineage commitment of human blood progenitors. Science 345, 1251033. - PMC - PubMed

Publication types