. 2019 Apr 9;12(4):728-742.
doi: 10.1016/j.stemcr.2019.02.005. Epub 2019 Mar 14.

Glycolysis Regulates Human Embryonic Stem Cell Self-Renewal under Hypoxia through HIF-2α and the Glycolytic Sensors CTBPs

Affiliations

Glycolysis Regulates Human Embryonic Stem Cell Self-Renewal under Hypoxia through HIF-2α and the Glycolytic Sensors CTBPs

Sophie A Arthur et al. Stem Cell Reports. .

Abstract

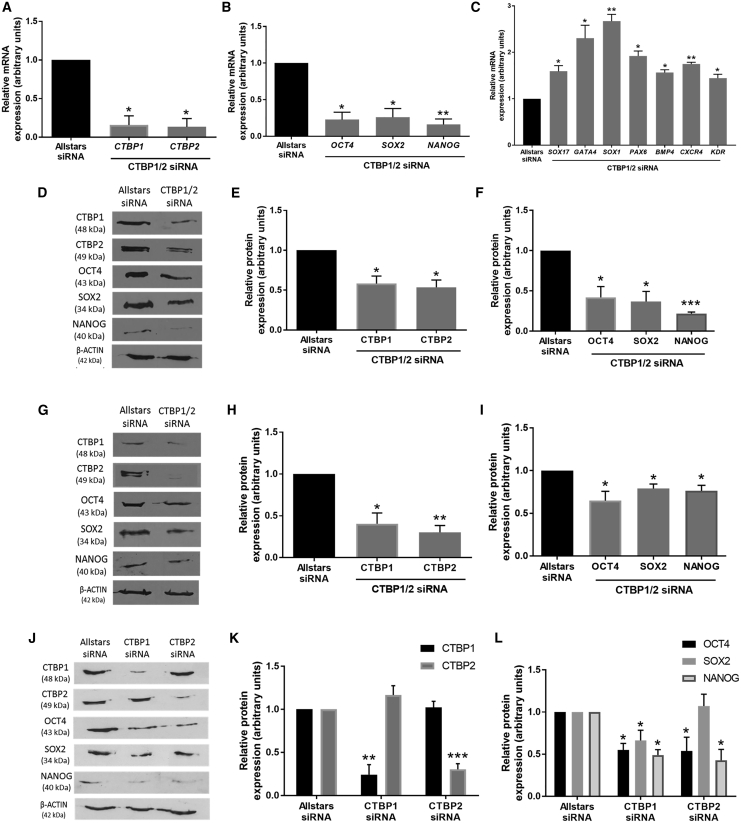
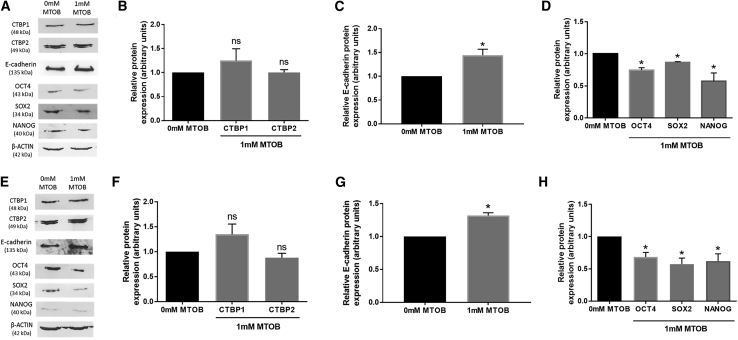
Glycolysis and hypoxia are key regulators of human embryonic stem cell (hESC) self-renewal, but how changes in metabolism affect gene expression is poorly understood. C-terminal binding proteins (CTBPs) are glycolytic sensors that through NADH binding link the metabolic state of the cell to its gene expression, by acting as transcriptional corepressors, or coactivators. However, the role of CTBPs in hESCs has not previously been investigated. A direct interaction between hypoxia-inducible factor 2α (HIF-2α) and the CTBP proximal promoters in hESCs cultured only under hypoxia was demonstrated. Decreasing the rate of flux through glycolysis in hESCs maintained under hypoxia resulted in a reduction of CTBPs, OCT4, SOX2, and NANOG, but also in the expression of HIF-2α. Silencing CTBP expression resulted in the loss of pluripotency marker expression demonstrating that CTBPs are involved in hESC maintenance. These data suggest that under hypoxia, glycolysis regulates self-renewal through HIF-2α and the induction of the metabolic sensors CTBPs.

Keywords: C-terminal binding proteins; NANOG; OCT4; SOX2; glycolysis; human embryonic stem cells; hypoxia-inducible factors; metabolism; self-renewal.


Figures

Figure 1
Figure 1
CTBP Expression Is Regulated by Environmental Oxygen Tension in hESCs (A) qRT-PCR analysis of CTBP1 and CTBP2 expression in Hues-7 hESCs cultured at either 5% or 20% oxygen (n = 3 for CTBP1; n = 4 for CTBP2). (B–E) Quantification of CTBP1 and CTBP2 expression using western blotting in Hues-7 (B and C) and Shef3 (D and E) cultured at 5% compared with 20% oxygen (n = 3 for Hues-7; n = 4 for Shef3). Bars represent mean ± SEM. p < 0.05, ∗∗p < 0.01 significantly different to 5% oxygen. (F and G) Representative immunocytochemistry images of CTBP1 and CTBP2 expression in Hues-7 (F) and Shef3 (G) hESCs cultured under either 5% or 20% oxygen. Nuclei were labeled using DAPI. Scale bars, 50 μm. FITC secondary antibodies alone were used as negative controls. See also Figure S1.
Figure 2
Figure 2
HIF-2α Directly Regulates CTBP Expression in hESCs Maintained under Hypoxic Conditions (A) Phase contrast images demonstrating the morphology of Hues-7 hESCs cultured at 5% oxygen after transfection with either Allstars control or HIF-2α siRNA for 48 h. Scale bars, 200 μm. (B–D) qRT-PCR analysis of HIF-2α (B), OCT4 (C), CTBP1, and CTBP2 (D) expression in Hues-7 hESCs transfected with either Allstars control or HIF-2α siRNA for 48 h (n = 4). (E–G) Quantification of HIF-2α (F), and CTBP1 and CTBP2 (G) expression using western blotting (E) in Hues-7 hESCs transfected with either the Allstars control or HIF-2α siRNA for 48 h (n = 3). Bars represent mean ± SEM. p < 0.05 significantly different to Allstars control siRNA. (H and I) ChIP analysis of HIF-2α binding to predicted HRE sites in the proximal promoters of CTBP1 (H) and CTBP2 (I) on chromatin isolated from Hues-7 hESCs cultured at either 5% or 20% oxygen. DNA enrichment is expressed as a percentage of the Input (n = 3; ns, no significant difference, p < 0.05). Bars represent mean ± SEM. See also Figure S2.
Figure 3
Figure 3
Glycolysis Regulates hESC Pluripotency and CTBP Expression by Regulating HIF-2α under Hypoxic Conditions (A) Phase contrast images demonstrating the morphology of Hues-7 hESCs cultured at 5% oxygen in the presence or absence of 0.2, 1, or 10 mM 2-DG or 25 μM 3-BrP for 48 h. Scale bars, 200 μm. (B and C) Enzyme-linked assays were used to measure lactate production. Hues-7 hESCs were cultured with either 0, 0.2, 1, or 10 mM 2-DG (B) or in the presence or absence 3-BrP (C) for 48 h prior to collecting media samples for use in the enzyme-linked assays (n = 12–15 wells from at least 3 independent experiments). (D–F) qRT-PCR analysis of OCT4, SOX2, NANOG, LIN28B, and SALL4 (D), a panel of differentiation markers from the three developmental germ layers (E), and CTBP1 and CTBP2 (F) in Hues-7 hESCs treated with 10 mM 2-DG for 48 h compared with control cells (n = 3–5). See also Figure S3. (G–L) Quantification of OCT4, SOX2, NANOG, CTBP1, and CTBP2 expression using western blotting in Hues-7 (G–I) and Shef3 (J–L) hESCs treated with 10 mM 2-DG for 48 h compared with 0 mM 2-DG (n = 3 for Hues-7; n = 4 for Shef3). (M–O) Quantification of OCT4, SOX2, NANOG (M and N), CTBP1, and CTBP2 (M and O) expression using western blotting in Hues-7 hESCs cultured in the presence or absence of 25 μM 3-BrP for 48 h (n = 3–4). (P–S) Quantification of HIF-2α expression using western blotting in Hues-7 (P and Q) and Shef3 (R and S) hESCs treated with or without 10 mM 2-DG for 48 h (n = 4 for Hues-7; n = 3 for Shef3). (T and U) Quantification of HIF-2α expression using western blotting in Hues-7 hESCs cultured in the presence or absence of 25 μM 3-BrP for 48 h (n = 4). Bars represent mean ± SEM. p < 0.05, ∗∗p < 0.01, ∗∗∗p < 0.001 significantly different to no treatment control; ns, no significant difference.
Figure 4
Figure 4
CTBPs Mediate the Activation of Pluripotency Markers in hESCs Maintained under Hypoxic Conditions (A–C) mRNA expression of CTBP1, CTBP2 (A), OCT4, SOX2, and NANOG (B) and a panel of differentiation markers (C) in Hues-7 hESCs cultured at 5% oxygen 48 h post-transfection with either Allstars control or CTBP1/2 siRNA (n = 3). (D–I) Quantification of CTBP1, CTBP2, OCT4, SOX2, and NANOG expression using western blotting in Hues-7 (D–F) and Shef3 (G–I) hESCs maintained at 5% oxygen and transfected with either Allstars control or CTBP1/2 siRNA for 48 h (n = 3 for Hues-7; n = 4 for Shef3). (J–L) Quantification of CTBP1, CTBP2 (J and K), OCT4, SOX2, and NANOG (J and L) expression in Hues-7 hESCs transfected with either CTBP1 siRNA or CTBP2 siRNA compared with those transfected with Allstars control siRNA for 48 h (n = 3–5). Bars represent mean ± SEM. p < 0.05, ∗∗p < 0.01, ∗∗∗p < 0.001 significantly different to Allstars control siRNA. See also Figure S4.
Figure 5
Figure 5
CTBP Dimerization Enhances the Self-Renewal of hESCs Cultured under Hypoxia Quantification of CTBP1, CTBP2, E-cadherin, OCT4, SOX2, and NANOG expression using western blotting in Hues-7 (A–D) and Shef3 (E–H) hESCs cultured at 5% oxygen and treated with either 0 or 1 mM MTOB for 48 h (n = 3–4). Bars represent mean ± SEM. p < 0.05 significantly different to no treatment control; ns, no significant difference.
Figure 6
Figure 6
Proposed Mechanism of the Glycolytic Regulation of CTBP and Pluripotency Marker Expression via HIF-2α in hESCs Cultured under Hypoxia Under hypoxic conditions, hESCs display an increase in the rate of flux through glycolysis which promotes HIF-2α protein expression, and thus the activity of HIF-2α-regulated genes, including OCT4, SOX2, NANOG, and the glycolytic sensors CTBPs. HIF-2α can also enhance glycolysis through the upregulation of glycolytic enzyme and glucose transporter expression. HIF-2α directly binds to putative HRE sites in the proximal promoters of pluripotency markers and CTBPs, resulting in their increased protein expression. An increased rate of flux through glycolysis results in higher levels of free NADH; which is required for CTBPs to form functional dimers. CTBP dimers bind to transcription factors containing a PXDLS-binding motif and form a scaffold for a CTBP coactivator complex containing chromatin modifiers and a series of unknown cofactors to enhance the expression of OCT4, SOX2, and NANOG.

Similar articles

Cited by

References

    1. Bergman L.M., Morris L., Darley M., Mirnezami A.H., Gunatilake S.C., Blaydes J.P. Role of the unique N-terminal domain of CtBP2 in determining the subcellular localisation of CtBP family proteins. BMC Cell Biol. 2006;7:35. - PMC - PubMed
    1. Birts C.N., Harding R., Soosaipillai G., Halder T., Azim-Araghi A., Darley M., Cutress R.I., Bateman A.C., Blaydes J.P. Expression of CtBP family protein isoforms in breast cancer and their role in chemoresistance. Biol. Cell. 2010;103:1–19. - PMC - PubMed
    1. Boyd J.M., Subramanian T., Schaeper U., La Regina M., Bayley S., Chinnadurai G. A region in the C-terminus of adenovirus 2/5 E1a protein is required for association with a cellular phosphoprotein and important for the negative modulation of T24-ras mediated transformation, tumorigenesis and metastasis. EMBO J. 1993;12:469–478. - PMC - PubMed
    1. Bradford M.M. A rapid and sensitive method for the quantitation of microgram quantities of protein utilizing the principle of protein-dye binding. Anal. Biochem. 1976;72:248–254. - PubMed
    1. Chen H.F., Kuo H.C., Lin S.P., Chien C.L., Chiang M.S., Ho H.N. Hypoxic culture maintains self-renewal and enhances embryoid body formation of human embryonic stem cells. Tissue Eng. Part A. 2010;16:2901–2913. - PubMed

Publication types

MeSH terms

Substances