

Dichloroacetic acid upregulates apoptosis of ovarian cancer cells by regulating mitochondrial function
- PMID: 30881027
- PMCID: PMC6419601
- DOI: 10.2147/OTT.S194329
Dichloroacetic acid upregulates apoptosis of ovarian cancer cells by regulating mitochondrial function
Abstract
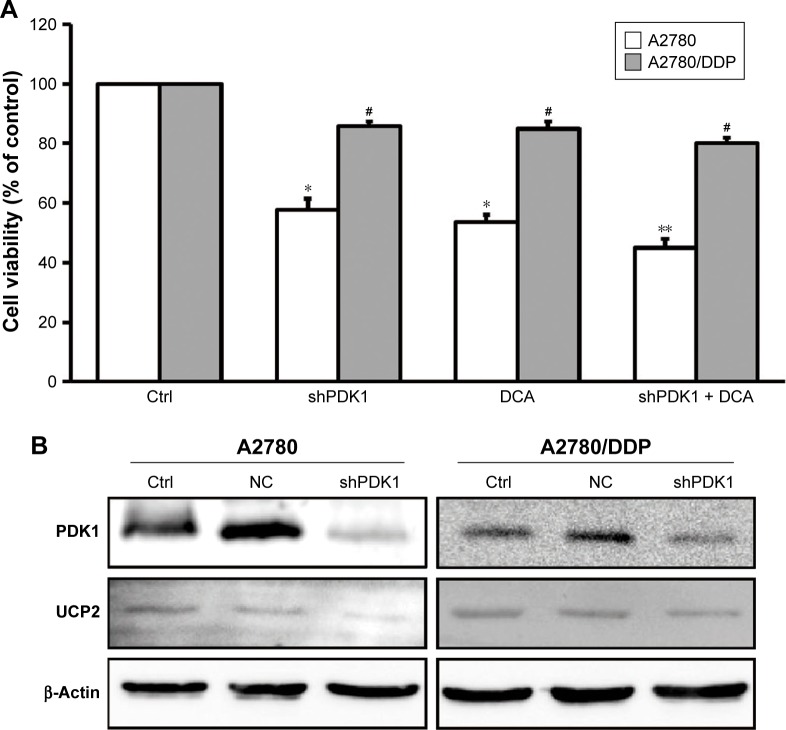
Background: Metabolic reprogramming is a characteristic of tumor cells and is considered a potential therapeutic target. Even under aerobic conditions, tumor cells use glycolysis to produce energy, a phenomenon called the "Warburg effect". Pyruvate dehydrogenase kinase 1 (PDK1) is a key factor linking glycolysis and the tricarboxylic acid cycle. Dichloroacetic acid (DCA) reverses the Warburg effect by inhibition of PDK1 to switch cytoplasmic glucose metabolism to mitochondrial oxidative phosphorylation (OXPHOS).
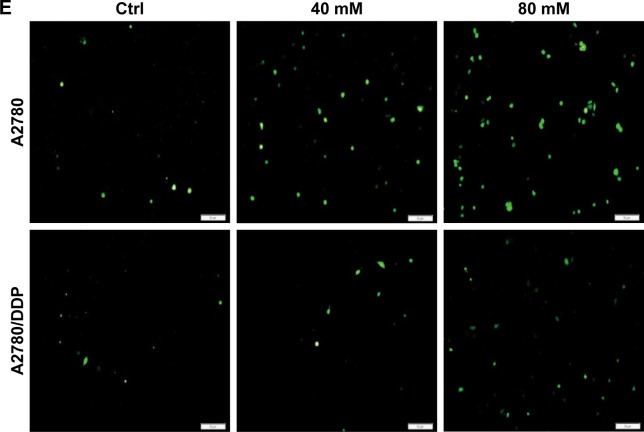
Methods: Cell viability was examined using a standard MTT assay. Glucose consumption and l-lactate production were measured using commercial colorimetric kits, and intracellular lactate dehydrogenase (LDH) activity was evaluated using cell lysates and an LDH Quantification Kit. Real-time PCR was used to detect the expression of related genes. The production of total ROS was evaluated by staining with dichlorofluorescin diacetate.
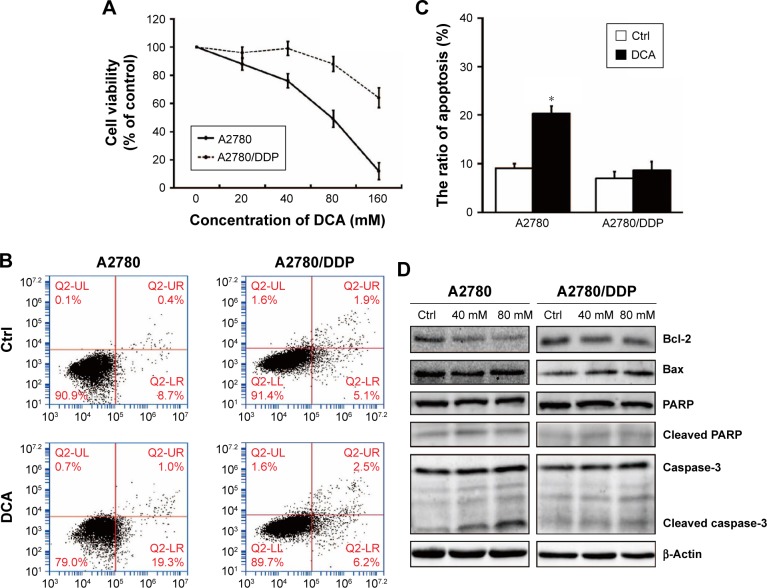
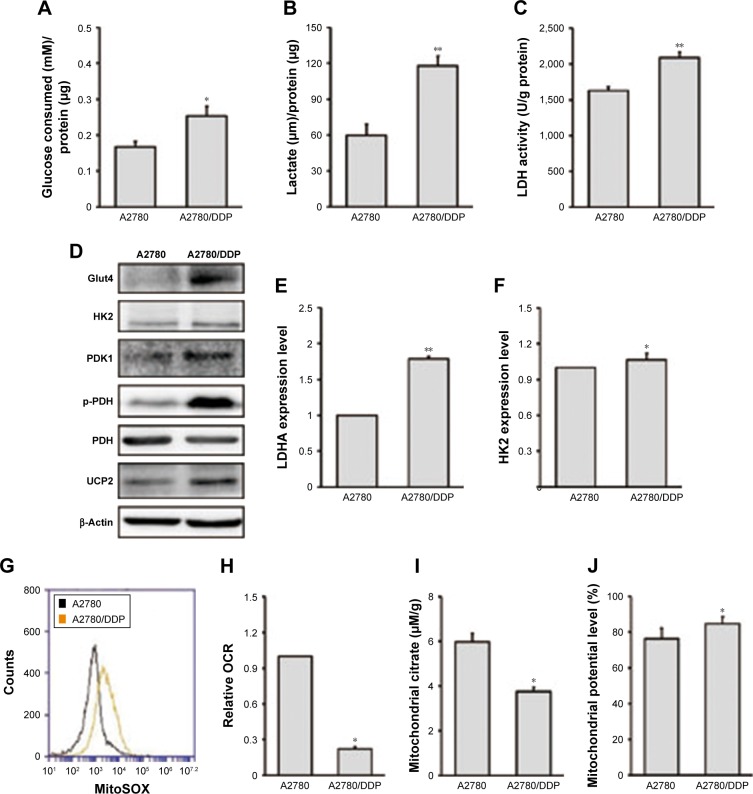
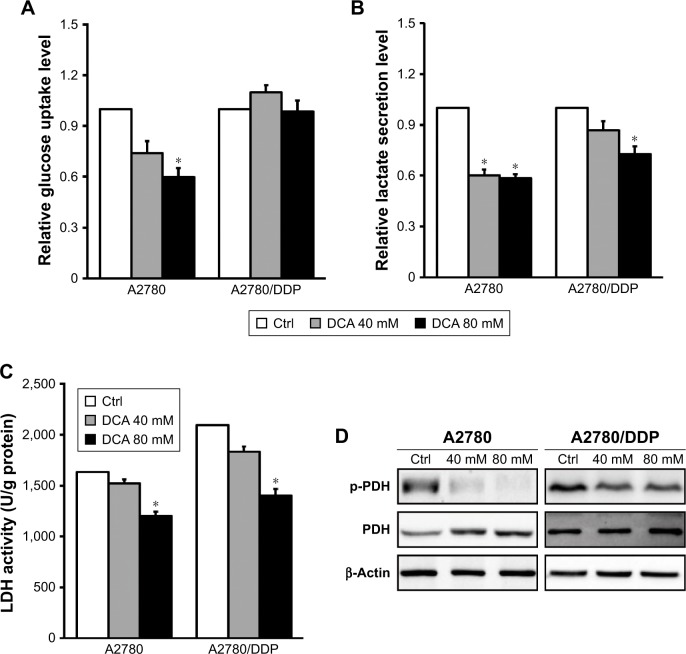
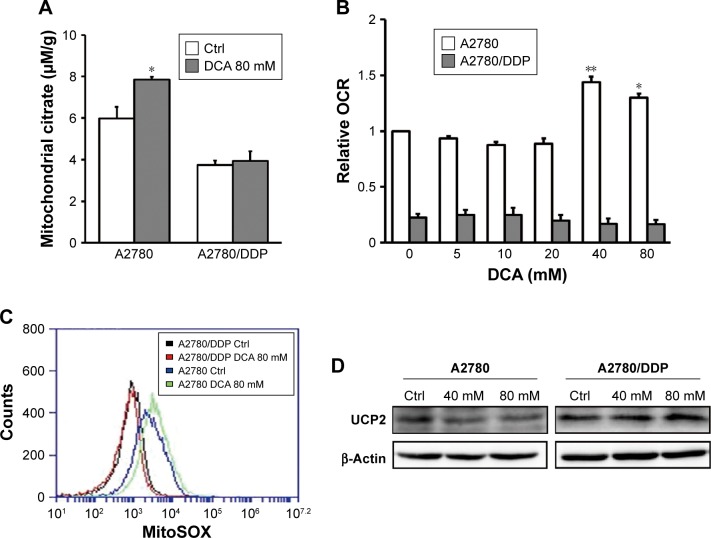
Results: Comparison of various aspects of glucose metabolism, such as expression of key enzymes in glycolysis, lactate production, glucose consumption, mitochondrial oxygen consumption rate, and citric acid production, revealed that A2780/DDP cells were primarily dependent on glycolysis whereas A2780 cells were primarily dependent on mitochondrial OXPHOS. Mitochondrial uncoupling protein 2 (UCP2) protects against mitochondrial ROS while allowing energy metabolism to switch to glycolysis. Treatment of A2780 cells with various concentrations of DCA resulted in decreased expression of UCP2, a metabolic switch from glycolysis to mitochondrial OXPHOS, and an increase in oxidative stress induced by ROS. These effects were not observed in A2780/DDP cells with higher UCP2 expression suggesting that UCP2 might induce changes in mitochondrial functions that result in different sensitivities to DCA.
Conclusion: Our results show that a drug targeting tumor metabolic changes affects almost the entire process of glucose metabolism. Thus, it is necessary to comprehensively determine tumor metabolic functions to facilitate individualized antitumor therapy.
Keywords: DCA; glucose; glycolysis; metabolism; mitochondrial function.
Conflict of interest statement
Disclosure The authors report no conflicts of interest in this work.
Figures
Similar articles
-
Mitochondria-targeting natural product rhein conjugated with dichloroacetate as the dual inhibitor of glycolysis and oxidative phosphorylation to off energize cancer cells and induce ROS storm.Theranostics. 2025 Mar 31;15(11):4909-4929. doi: 10.7150/thno.107812. eCollection 2025. Theranostics. 2025. PMID: 40303329 Free PMC article.
-
Nonhormonal therapy for endometriosis based on energy metabolism regulation.Reprod Fertil. 2021 Nov 25;2(4):C42-C57. doi: 10.1530/RAF-21-0053. eCollection 2021 Dec. Reprod Fertil. 2021. PMID: 35118411 Free PMC article. Review.
-
Pyruvate dehydrogenase kinase 1 interferes with glucose metabolism reprogramming and mitochondrial quality control to aggravate stress damage in cancer.J Cancer. 2020 Jan 1;11(4):962-973. doi: 10.7150/jca.34330. eCollection 2020. J Cancer. 2020. PMID: 31949499 Free PMC article.
-
The Warburg effect in tumor progression: mitochondrial oxidative metabolism as an anti-metastasis mechanism.Cancer Lett. 2015 Jan 28;356(2 Pt A):156-64. doi: 10.1016/j.canlet.2014.04.001. Epub 2014 Apr 13. Cancer Lett. 2015. PMID: 24732809 Free PMC article. Review.
-
PDK1 inhibition is a novel therapeutic target in multiple myeloma.Br J Cancer. 2013 Jan 15;108(1):170-8. doi: 10.1038/bjc.2012.527. Epub 2012 Nov 29. Br J Cancer. 2013. PMID: 23321518 Free PMC article.
Cited by
-
Recent advances in understanding the metabolic plasticity of ovarian cancer: A systematic review.Heliyon. 2022 Nov 11;8(11):e11487. doi: 10.1016/j.heliyon.2022.e11487. eCollection 2022 Nov. Heliyon. 2022. PMID: 36406733 Free PMC article.
-
Dichloroacetate for Cancer Treatment: Some Facts and Many Doubts.Pharmaceuticals (Basel). 2024 Jun 6;17(6):744. doi: 10.3390/ph17060744. Pharmaceuticals (Basel). 2024. PMID: 38931411 Free PMC article. Review.
-
Glucose metabolism reprogramming in gynecologic malignant tumors.J Cancer. 2024 Mar 17;15(9):2627-2645. doi: 10.7150/jca.91131. eCollection 2024. J Cancer. 2024. PMID: 38577616 Free PMC article. Review.
-
A comprehensive overview of recent developments on the mechanisms and pathways of ferroptosis in cancer: the potential implications for therapeutic strategies in ovarian cancer.Cancer Drug Resist. 2023 Aug 11;6(3):547-566. doi: 10.20517/cdr.2023.49. eCollection 2023. Cancer Drug Resist. 2023. PMID: 37842240 Free PMC article. Review.
-
Alteration of glucose metabolism and expression of glucose transporters in ovarian cancer.Explor Target Antitumor Ther. 2024;5(2):384-399. doi: 10.37349/etat.2024.00224. Epub 2024 Apr 24. Explor Target Antitumor Ther. 2024. PMID: 38745772 Free PMC article. Review.
References
-
- Roder F. An analysis of Warburg’s view on the origin of cancer cells. Philos Sci. 1956;23(4):343–347.
-
- Kroemer G, Pouyssegur J. Tumor cell metabolism: cancer’s Achilles’ heel. Cancer Cell. 2008;13(6):472–482. - PubMed
-
- Morandi A, Indraccolo S. Linking metabolic reprogramming to therapy resistance in cancer. Biochim Biophys Acta Rev Cancer. 1868;2017(1):1–6. - PubMed
-
- Kim JW, Dang CV. Cancer’s molecular sweet tooth and the Warburg effect. Cancer Res. 2006;66(18):8927–8930. - PubMed
LinkOut - more resources
Full Text Sources
Miscellaneous
