

In vivo Calcium Imaging Reveals That Cortisol Treatment Reduces the Number of Place Cells in Thy1-GCaMP6f Transgenic Mice
- PMID: 30881283
- PMCID: PMC6405689
- DOI: 10.3389/fnins.2019.00176
In vivo Calcium Imaging Reveals That Cortisol Treatment Reduces the Number of Place Cells in Thy1-GCaMP6f Transgenic Mice
Abstract
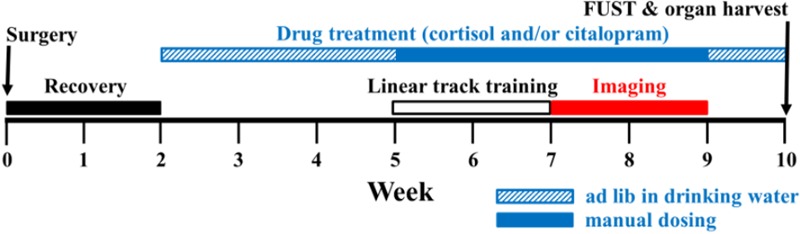
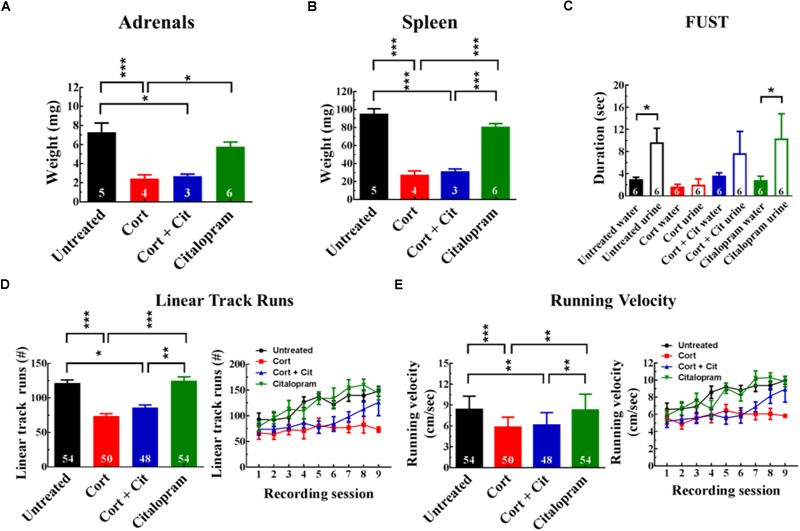
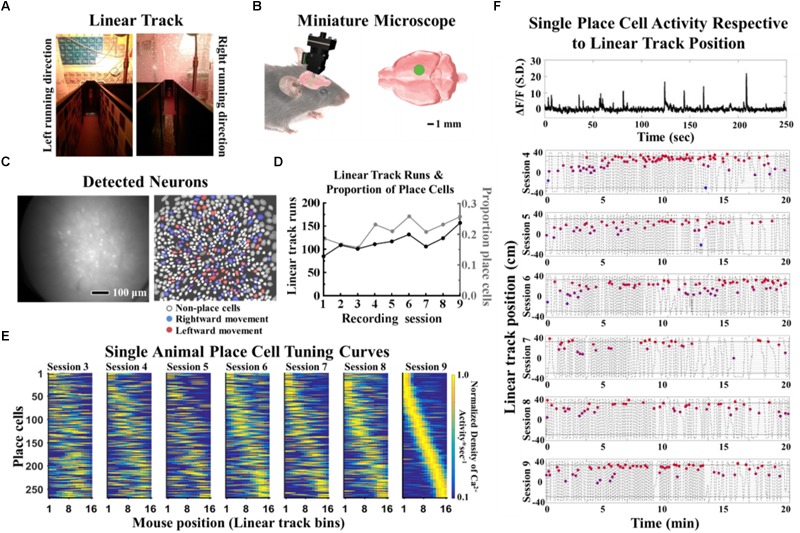
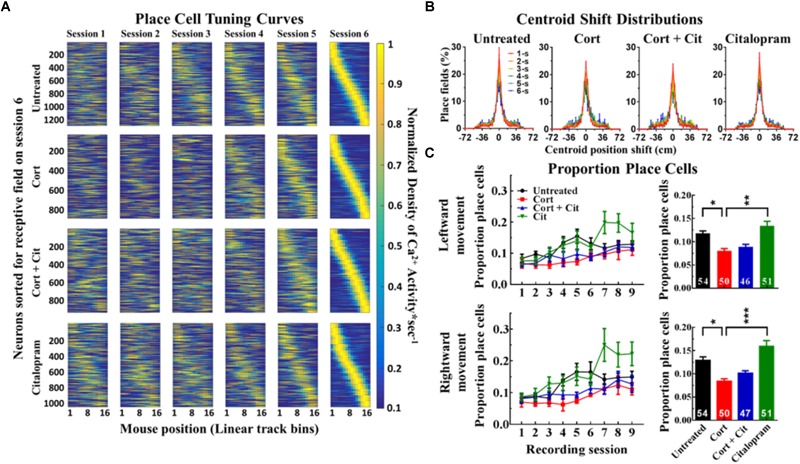
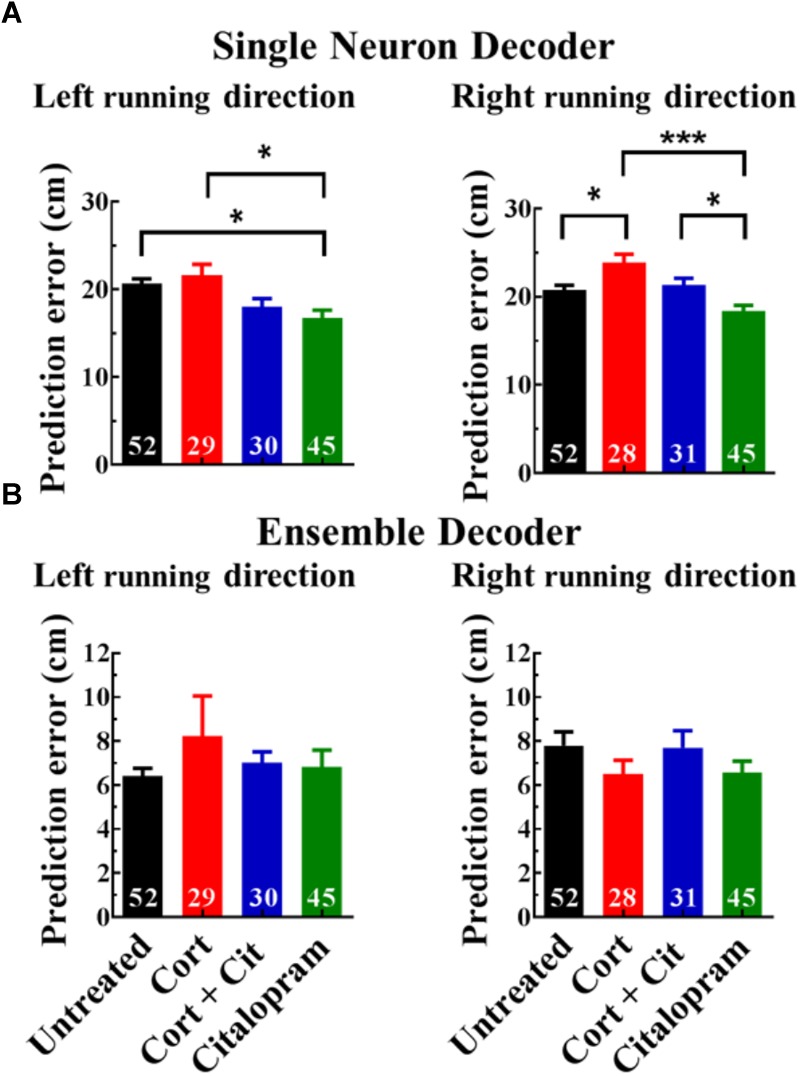
The hippocampus, a structure essential for spatial navigation and memory undergoes anatomical and functional changes during chronic stress. Here, we investigate the effects of chronic stress on the ability of place cells to encode the neural representation of a linear track. To model physiological conditions of chronic stress on hippocampal function, transgenic mice expressing the genetically encoded calcium indicator GCaMP6f in CA1 pyramidal neurons were chronically administered with 40 μg/ml of cortisol for 8 weeks. Cortisol-treated mice exhibited symptoms typically observed during chronic stress, including diminished reward seeking behavior and reduced adrenal gland and spleen weights. In vivo imaging of hippocampal cellular activity during linear track running behavior revealed a reduced number of cells that could be recruited to encode spatial position, despite an unchanged overall number of active cells, in cortisol-treated mice. The properties of the remaining place cells that could be recruited to encode spatial information, however, was unperturbed. Bayesian decoders trained to estimate the mouse's position on the track using single neuron activity data demonstrated reduced performance in a cue richness-dependent fashion in cortisol-treated animals. The performance of decoders utilizing data from the entire neuronal ensemble was unaffected by cortisol treatment. Finally, to test the hypothesis that an antidepressant drug could prevent the effects of cortisol, we orally administered a group of mice with 10 mg/kg citalopram during cortisol administration. Citalopram prevented the cortisol-induced decrease in single-neuron decoder performance but failed to significantly prevent anhedonia and the cortisol-induced reduction in the proportion place cells. The dysfunction observed at the single-neuron level indicates that chronic stress may impair the ability of the hippocampus to encode individual neural representations of the mouse's spatial position, a function pivotal to forming an accurate navigational map of the mouse's external environment; however, the hippocampal ensemble as a whole is resilient to any cortisol-induced insults to single neuronal place cell function on the linear track.
Keywords: GCaMP6f; calcium imaging; citalopram; cortisol; miniature microscopes; place cells; transgenic mice.
Figures
Similar articles
-
Utilizing Miniature Fluorescence Microscopy to Image Hippocampal Place Cell Ensemble Function in Thy1.GCaMP6f Transgenic Mice.Curr Protoc Pharmacol. 2018 Sep;82(1):e42. doi: 10.1002/cpph.42. Epub 2018 Aug 20. Curr Protoc Pharmacol. 2018. PMID: 30129249
-
Scopolamine Impairs Spatial Information Recorded With "Miniscope" Calcium Imaging in Hippocampal Place Cells.Front Neurosci. 2021 Mar 19;15:640350. doi: 10.3389/fnins.2021.640350. eCollection 2021. Front Neurosci. 2021. PMID: 33815044 Free PMC article.
-
Sparse orthogonal population representation of spatial context in the retrosplenial cortex.Nat Commun. 2017 Aug 15;8(1):243. doi: 10.1038/s41467-017-00180-9. Nat Commun. 2017. PMID: 28811461 Free PMC article.
-
The Hippocampal Ensemble Code for Spatial Navigation and Episodic Memory.Adv Neurobiol. 2018;21:49-70. doi: 10.1007/978-3-319-94593-4_3. Adv Neurobiol. 2018. PMID: 30334219 Review.
-
Plasticity, hippocampal place cells, and cognitive maps.Arch Neurol. 2001 Jun;58(6):874-81. doi: 10.1001/archneur.58.6.874. Arch Neurol. 2001. PMID: 11405801 Review.
Cited by
-
Repeated stress exposure leads to structural synaptic instability prior to disorganization of hippocampal coding and impairments in learning.Transl Psychiatry. 2022 Sep 12;12(1):381. doi: 10.1038/s41398-022-02107-5. Transl Psychiatry. 2022. PMID: 36096987 Free PMC article.
-
Distinct Disruptions in CA1 and CA3 Place Cell Function in Alzheimer's Disease Mice.bioRxiv [Preprint]. 2024 Sep 24:2024.09.23.614631. doi: 10.1101/2024.09.23.614631. bioRxiv. 2024. Update in: iScience. 2025 Jan 10;28(2):111631. doi: 10.1016/j.isci.2024.111631. PMID: 39386433 Free PMC article. Updated. Preprint.
-
Distinct disruptions in CA1 and CA3 place cell function in Alzheimer's disease mice.iScience. 2025 Jan 10;28(2):111631. doi: 10.1016/j.isci.2024.111631. eCollection 2025 Feb 21. iScience. 2025. PMID: 39911347 Free PMC article.
-
Heterogeneous subpopulations of GABAAR-responding neurons coexist across neuronal network scales and developmental stages in health and disease.iScience. 2024 Mar 8;27(4):109438. doi: 10.1016/j.isci.2024.109438. eCollection 2024 Apr 19. iScience. 2024. PMID: 38544574 Free PMC article.
-
Neuregulin signaling mediates the acute and sustained antidepressant effects of subanesthetic ketamine.Transl Psychiatry. 2021 Feb 24;11(1):144. doi: 10.1038/s41398-021-01255-4. Transl Psychiatry. 2021. PMID: 33627623 Free PMC article.
References
-
- American Psychiatric Association (2013). Diagnostic and Statistical Manual of Mental Disorders (DSM–5) 5 Edn ed. Jeste D. V. (San Francisco, CA: American Psychiatric Association; ). 10.1176/appi.books.9780890425596 - DOI
-
- Bates D., Maechler M., Bolker B., Walker S. (2015). Fitting linear mixed-effects models using lme4. J. Stat. Softw. 67 1–48. 10.18637/jss.v067.i01 - DOI
LinkOut - more resources
Full Text Sources
Miscellaneous