. 2019 Mar 1:13:67.
doi: 10.3389/fncel.2019.00067. eCollection 2019.

Neuroglial Involvement in Abnormal Glutamate Transport in the Cochlear Nuclei of the Igf1 -/- Mouse

Affiliations

Neuroglial Involvement in Abnormal Glutamate Transport in the Cochlear Nuclei of the Igf1 -/- Mouse

Veronica Fuentes-Santamaría et al. Front Cell Neurosci. .

Abstract

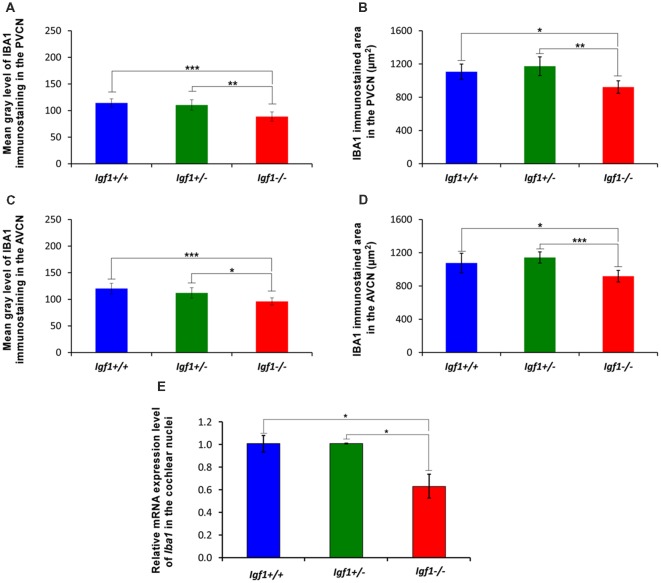
Insulin-like growth factor 1 (IGF-1) is a powerful regulator of synaptic activity and a deficit in this protein has a profound impact on neurotransmission, mostly on excitatory synapses in both the developing and mature auditory system. Adult Igf1 -/- mice are animal models for the study of human syndromic deafness; they show altered cochlear projection patterns into abnormally developed auditory neurons along with impaired glutamate uptake in the cochlear nuclei, phenomena that probably reflect disruptions in neuronal circuits. To determine the cellular mechanisms that might be involved in regulating excitatory synaptic plasticity in 4-month-old Igf1 -/- mice, modifications to neuroglia, astroglial glutamate transporters (GLTs) and metabotropic glutamate receptors (mGluRs) were assessed in the cochlear nuclei. The Igf1 -/- mice show significant decreases in IBA1 (an ionized calcium-binding adapter) and glial fibrillary acidic protein (GFAP) mRNA expression and protein accumulation, as well as dampened mGluR expression in conjunction with enhanced glutamate transporter 1 (GLT1) expression. By contrast, no differences were observed in the expression of glutamate aspartate transporter (GLAST) between these Igf1 -/- mice and their heterozygous or wildtype littermates. These observations suggest that congenital IGF-1 deficiency may lead to alterations in microglia and astrocytes, an upregulation of GLT1, and the downregulation of groups I, II and III mGluRs. Understanding the molecular, biochemical and morphological mechanisms underlying neuronal plasticity in a mouse model of hearing deficits will give us insight into new therapeutic strategies that could help to maintain or even improve residual hearing when human deafness is related to IGF-1 deficiency.

Keywords: IGF-1; astrocytes; cochlear nucleus; glutamate receptors; hearing loss; microglia.


Figures

Figure 1
Figure 1
Morphometric analysis of microglial branching. For the skeleton analysis, digital images of IBA1 immunostained cells were captured with a 40× objective (A,E), converted into binary images (B,F) and then skeletonized (C,G). To evaluate microglial morphology parameters, skeletonized images were processed using the Analyze Skeleton plugin for Image J. Each glial cell is identified with a different color. The representative glia is shown in purple, and part of the skeleton of the other glial cells is shown in yellow, blue and white (D,H).
Figure 2
Figure 2
IBA1 immunostaining in the DCN of Igf1−/− mice. (A) Coronal section of a wild-type mouse brain taken from the Franklin and Paxinos (2013) mouse brain atlas, to show the location of the DCN (red) and PVCN. (B) Representative coronal section of the cochlear nuclei in the wild-type genotype immunostained with IBA1. In Igf1−/− mice, cells with multipolar or bipolar morphology were stained more weakly, and they had shorter processes than in Igf1+/+ and Igf1+/− mice (arrows in C–E). The maximum intensity projections of confocal images of the DCN illustrate a reduction in microglial branching in Igf1−/− mice (arrow in H) when compared to the other genotypes (arrows in F,G). Quantification of the immunostaining showed the significant decrease in the mean gray levels (I) and the immunostained areas (J) in the Igf1−/− mouse when compared to the other genotypes. Arrows point to IBA1 immunostained cells. Cell nuclei in (F–H) are stained with DAPI (blue). The error bars indicate the standard deviations of the mean. Statistically significant differences among the animal groups were evaluated by one-factor analyses of variance (ANOVA; *p < 0.05; **p < 0.01). Abbreviations: Cb, Cerebellum; cr, central region of the dorsal cochlear nucleus (DCN); grl, granule/fusiform layer; IBA1, ionized-calcium-binding adaptor; icp, inferior cerebellar peduncle; IRt, intermediate reticular nucleus; ml, molecular layer; NeuN, neuronal marker; PVCN, posteroventral cochlear nucleus; sp5, spinal trigeminal nucleus; sp5OVL, spinal trigeminal nucleus, oral part, ventrolateral division; 4V, 4th ventricle; 7N, facial nucleus. Scale bars: 250 μm in (B); 50 μm in (C; it also applies to C,D); 20 μm in (H; it also applies to F,G).
Figure 3
Figure 3
IBA1 immunostaining in the PVCN and AVCN of Igf1−/− mice. (A,C) Coronal sections of a wild-type mouse brain, taken from Franklin and Paxinos (2013) mouse brain atlas, showing the location of the PVCN (green) and AVCN (blue). (B,D) Representative coronal sections of the ventral cochlear nucleus in the wild-type genotype immunostained with IBA1. In the PVCN and AVCN of Igf1−/− mice, there was less staining (G,J,M,P,Q) relative to the Igf1+/+ (E,H,K,N) and Igf1+/− mice (F,I,L,O). Maximum intensity projections of confocal images from the PVCN and AVCN show the reduced microglial arborization in Igf1−/− mice as compared to the other genotypes (H–J,N–Q for the PVCN and AVCN; respectively). Arrows point to IBA1 immunostained cells. Cell nuclei are stained with DAPI (blue). Abbreviations: AVCN, anteroventral cochlear nucleus; Cb, Cerebellum; IBA1, ionized-calcium-binding adaptor; icp, inferior cerebellar peduncle; IRt, intermediate reticular nucleus; NeuN, neuronal marker; PnC, pontine reticular nucleus, caudal part; PVCN, posteroventral cochlear nucleus; sp5, spinal trigeminal nucleus; sp5OVL, spinal trigeminal nucleus, oral part, ventrolateral division; 4V, 4th ventricle; 7n, facial nerve; 7N, facial nucleus; 8n, vestibulocochlear nerve. Scale bars: 250 μm in (D; it also applies to B); 50 μm in (F,J; it also applies to E,G,H,I); 20 μm in (L,O; it also applies to K,M,N,P,Q).
Figure 4
Figure 4
Insulin-like growth factor 1 (IGF-1) deficiency leads to Iba1 downregulation in Igf1−/− mice. Bar graphs showing decreases in the mean gray levels (A,B) and immunostained areas (C,D) in the Igf1−/− mouse cochlear nuclei when compared to Igf1+/+ and Igf1+/− mice. Similar reductions in Iba1 expression were also detected by RT-quantitative PCR (qPCR; E). Error bars indicate the standard deviations of the mean. Statistically significant differences among the animal groups were evaluated by one-factor ANOVA (*p < 0.05; **p < 0.01, ***p < 0.001). Abbreviations: AVCN, anteroventral cochlear nucleus; PVCN, posteroventral cochlear nucleus.
Figure 5
Figure 5
GFAP immunostaining in the DCN and PVCN of Igf1−/− mice. GFAP immunostaining was distributed throughout the different DCN layers in all the genotypes analyzed (A–F). GFAP-immunostained astrocytes were strongly stained in the molecular layer while only a few astrocytes were observed in the intermediate layer and central region of the DCN (A–C). Note that some of these astrocytes group together forming patches of immunostaining (arrows in A,B). In the Igf1−/− mice, GFAP immunostaining was apparently weaker in the deeper layers (grl and cr) of the DCN and in the PVCN than in Igf1+/+ and Igf1+/− mice (A–C,G–I). The spatial relationship between neurons and astrocytes in all genotypes is shown in Z-stack confocal microscopy images of the DCN (D–F) and PVCN (J–L). Quantification of the mean gray levels (M,O) and stained areas (N,P) in these nuclei corroborated the decreases in the immunostaining. Asterisks in (A–C) indicate GFAP immunostaining in the granule cell domain. Statistically significant differences among the mouse genotypes were evaluated by one-factor ANOVA (*p < 0.05, **p < 0.01, ***p < 0.001). Cell nuclei in (D–F) and (J–L) are stained with DAPI (blue). The square boxes in (A–C) indicate the location of the higher magnification images shown in (A–C; insets). Abbreviations: cr, central region of the dorsal cochlear nucleus (DCN); GFAP, glial fibrillary acidic protein; grl, granule/fusiform layer; ml, molecular layer; NeuN, neuronal marker; PVCN, posteroventral cochlear nucleus; sp5, spinal trigeminal nucleus. Scale bars: 500 μm in (C; it also applies to A,B); 100 μm in the inset in (C; it also applies to insets in A,B); 20 μm in (F,I; it also applies to D,E,G,H) and 50 μm in (L; it also applies to J,K).
Figure 6
Figure 6
GFAP immunostaining in the AVCN of Igf1−/− mice. Analysis of GFAP immunostaining in the Igf1−/− mice showed that there were fewer astrocytes and they were less intensely stained (C,F) when compared to Igf1+/+ (A,D) and Igf1+/− mice (B,E). Z-stack confocal microscopy images of GFAP and NeuN double-labeling are shown for all genotypes (D–F). The apparent decrease in GFAP immunostaining in the Igf1−/− mouse was corroborated by quantifying the mean gray levels (G) and the stained areas (H). The qualitative and quantitative data were confirmed when RT-qPCR data showed decreased Gfap expression in the Igf1−/− mouse cochlear nuclei (I). The error bars indicate the standard deviations of the mean. Statistically significant differences among the animal groups were evaluated by one-factor ANOVA (**p < 0.01, ***p < 0.001). Cell nuclei are stained with DAPI (blue). The square boxes in a-c indicate the location of the higher magnification images shown in (A–C; insets). Abbreviations: AVCN, anteroventral cochlear nucleus; GFAP, glial fibrillary acidic protein; NeuN, neuronal marker; sp5, spinal trigeminal nucleus. Scale bars: 500 μm in (C; it also applies to A,B); 100 μm in the inset in (C; it also applies to insets in A,B) and 20 μm in (F; it also applies to D,E).
Figure 7
Figure 7
Upregulation of GLT1 in the DCN of Igf1−/− mice. In the Igf1−/− mouse, the strongly GLT1 immunostained puncta (red) were found in all layers of the nucleus and presumptively occupied a larger area (C) than in the other genotypes (A,B). These qualitative observations were corroborated by significant increases in the mean gray levels and the immunostained areas (D,E). Similar increases in the IGF-1 deficient DCN were also detected by quantifying Glt1 mRNA expression (F). The inset in (A; pseudo-colored green for higher contrast) indicates the approximate location of the fields shown in (A–C). Error bars indicate the standard deviations of the mean. Statistically significant differences among the animal groups were evaluated by one-factor ANOVA (**p < 0.01, ***p < 0.001). Cell nuclei are stained with DAPI (blue). Abbreviations: cr, central region of the dorsal cochlear nucleus (DCN); GLT1, glutamate transporter 1; grl, granule/fusiform layer; ml, molecular layer. Scale bar: 20 μm in (C; it also applies to A,B).
Figure 8
Figure 8
Upregulation of GLT1 in the ventral cochlear nuclei of Igf1−/− mice. Z-stack confocal microscopy images show enhanced GLT1 immunostaining (red) in the IGF-1 deficient ventral cochlear nucleus (C,H) relative to the Igf1+/+ (A,F) and Igf1+/− mice (B,G). Quantification of the immunostaining confirmed this upregulation in both the PVCN (D,E) and AVCN (I,J). The inset in (A,F; pseudo-colored green for higher contrast) indicates the approximate location of the fields shown in (A–C,F–H); for the PVCN and AVCN, respectively. The error bars indicate the standard deviations of the mean. Statistically significant differences among the animal groups were evaluated by one-factor ANOVA (**p < 0.01, ***p < 0.001). Cell nuclei are stained with DAPI (blue). Abbreviations: AVCN, anteroventral cochlear nucleus; GLT1, glutamate transporter 1; PVCN, posteroventral cochlear nucleus. Scale bar: 20 μm in (C,H; it also applies to A,B,F,G).
Figure 9
Figure 9
Glutamate aspartate transporter (GLAST) immunostaining in the Igf1−/− mice cochlear nuclei. In all genotypes, GLAST stained puncta (green) were densely distributed throughout the neuropil and on the soma of DCN (A–C), PVCN (D–F) and AVCN (G–I) neurons immunostained with CR (red). No differences were observed in the distribution of the immunostaining among the three groups. The analysis of Glast expression levels by RT-qPCR confirmed these immunohistochemical results (J). The error bars indicate the standard deviations of the mean. Arrows point to CR-immunostained cells. Cell nuclei are stained with DAPI (blue). Abbreviations: AVCN, anteroventral cochlear nucleus; cr, central region of the DCN (dorsal cochlear nucleus); CR, calretinin; GLAST, glutamate aspartate transporter; grl, granule/fusiform layer; ml, molecular layer; PVCN, posteroventral cochlear nucleus. Scale bar: 20 μm in (I; it also applies to A–H).
Figure 10
Figure 10
Histograms showing the mean gray levels of GLAST immunostaining and the immunostained areas in the cochlear nuclei of Igf1−/−, Igf1+/− and Igf1+/+ mice. Analysis of the immunostaining indicated that there were no significant differences among the genotypes in either the mean gray levels of immunostaining (A–C) or in the immunostained areas (D–F) in the DCN, PVCN and AVCN. The error bars indicate the standard deviations of the mean. Abbreviations: DCN, dorsal cochlear nucleus; PVCN, posteroventral cochlear nucleus; AVCN, anteroventral cochlear nucleus.
Figure 11
Figure 11
Downregulation of mGluR1α in the cochlear nuclei of Igf1−/− mice. In the Igf1−/− mice, there was less mGluR1α staining (green) in the molecular and granule layers of the DCN than in the other genotypes (A–C). Similar decreases were also detected in Igf1−/− mouse PVCN (D–F) and AVCN (G–I). Quantification confirmed these qualitative decreases in the Igf1−/− mouse relative to the Igf1+/+ and Igf1+/− mice (J–O). The error bars indicate the standard deviations of the mean. Statistically significant differences among the animal groups were evaluated by one-factor ANOVA (**p < 0.01, ***p < 0.001). Neurons are stained with NeuN antibody (red) and cell nuclei are stained with DAPI (blue). Abbreviations: AVCN, anteroventral cochlear nucleus; cr, central region of the dorsal cochlear nucleus (DCN); grl, granule/fusiform layer; ml, molecular layer; mGluR1, metabotropic glutamate receptor 1; NeuN, neuronal marker; PVCN, posteroventral cochlear nucleus. Scale bar: 20 μm in (I; it also applies to A–H).
Figure 12
Figure 12
The loss of IGF-1 leads to mGluR1α, mGluR2α, mGluR4α and mGluR7α downregulation. The mGluR1α, mGluR2α, mGluR4α and mGluR7α mRNA expression was determined by RT-qPCR in 4-month-old Igf1−/−, Igf1+/− and Igf1+/+ mice. The results demonstrate a decline in mGluR1α (A), mGluR2α (B), mGluR4α (C) and mGluR7α (D) expression in the Igf1−/− mouse when compared with Igf1+/− and Igf1+/+ mice. Note that the decrease in mgluR7α expression in the Igf1−/− mice was not statistically significant. Also, they show a significant downregulation of mGluR1α (A), mGluR2α (B) and mGluR4α in heterozygous mice compared with their age-matched control mice. The error bars indicate the standard deviations of the mean. Statistically significant differences among the animal groups were evaluated by one-factor ANOVA (*p < 0.05; **p < 0.01, ***p < 0.001).

Similar articles

Cited by

References

    1. Adams M. M., Shi L., Linville M. C., Forbes M. E., Long A. B., Bennett C., et al. . (2008). Caloric restriction and age affect synaptic proteins in hippocampal CA3 and spatial learning ability. Exp. Neurol. 211, 141–149. 10.1016/j.expneurol.2008.01.016 - DOI - PMC - PubMed
    1. Alvarado J. C., Fuentes-Santamaría V., Franklin S. R., Brunso-Bechtold J. K., Henkel C. K. (2007a). Synaptophysin and insulin-like growth factor-1 immunostaining in the central nucleus of the inferior colliculus in adult ferrets following unilateral cochlear removal: a densitometric analysis. Synapse 61, 288–302. 10.1002/syn.20373 - DOI - PubMed
    1. Alvarado J. C., Stanford T. R., Vaughan J. W., Stein B. E. (2007b). Cortex mediates multisensory but not unisensory integration in superior colliculus. J. Neurosci. 27, 12775–12786. 10.1523/jneurosci.3524-07.2007 - DOI - PMC - PubMed
    1. Alvarado J. C., Fuentes-Santamaría V., Gabaldón-Ull M. C., Blanco J. L., Juiz J. M. (2014). Wistar rats: a forgotten model of age-related hearing loss. Front. Aging Neurosci. 6:29. 10.3389/fnagi.2014.00029 - DOI - PMC - PubMed
    1. Alvarado J. C., Fuentes-Santamaría V., Henkel C. K., Brunso-Bechtold J. K. (2004). Alterations in calretinin immunostaining in the ferret superior olivary complex after cochlear ablation. J. Comp. Neurol. 470, 63–79. 10.1002/cne.11038 - DOI - PubMed