. 2019 Mar 1:13:80.
doi: 10.3389/fncel.2019.00080. eCollection 2019.

Perampanel Affects Up-Stream Regulatory Signaling Pathways of GluA1 Phosphorylation in Normal and Epileptic Rats

Affiliations

Perampanel Affects Up-Stream Regulatory Signaling Pathways of GluA1 Phosphorylation in Normal and Epileptic Rats

Ji-Eun Kim et al. Front Cell Neurosci. .

Abstract

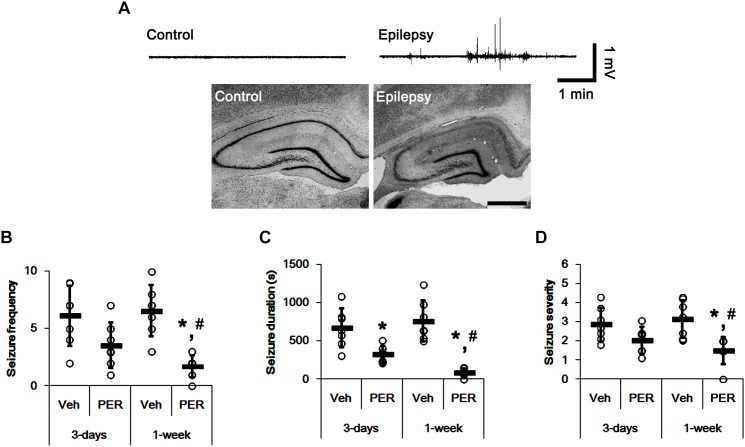
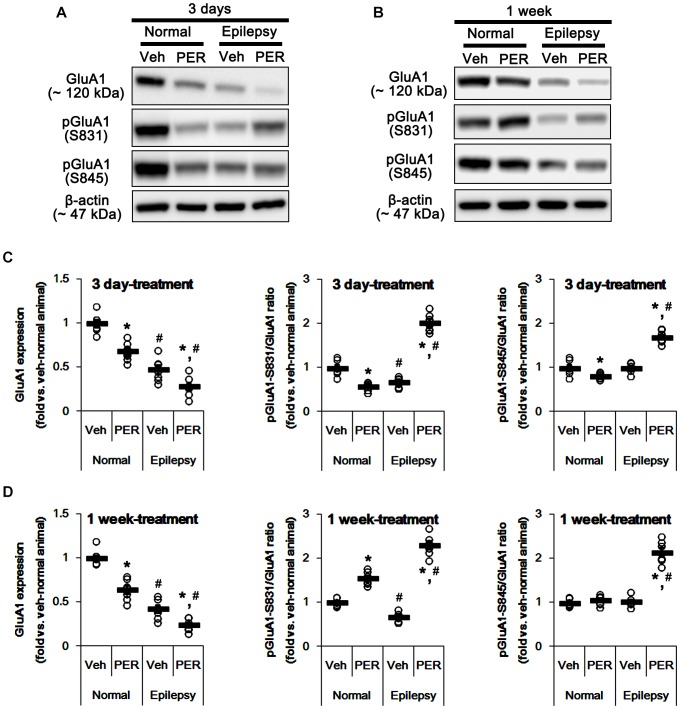
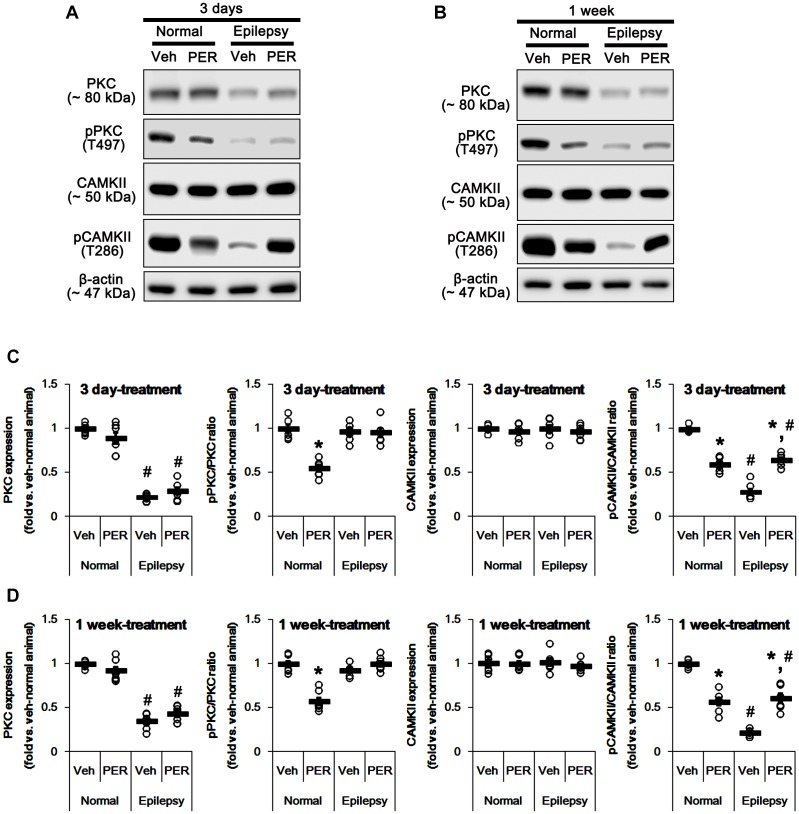
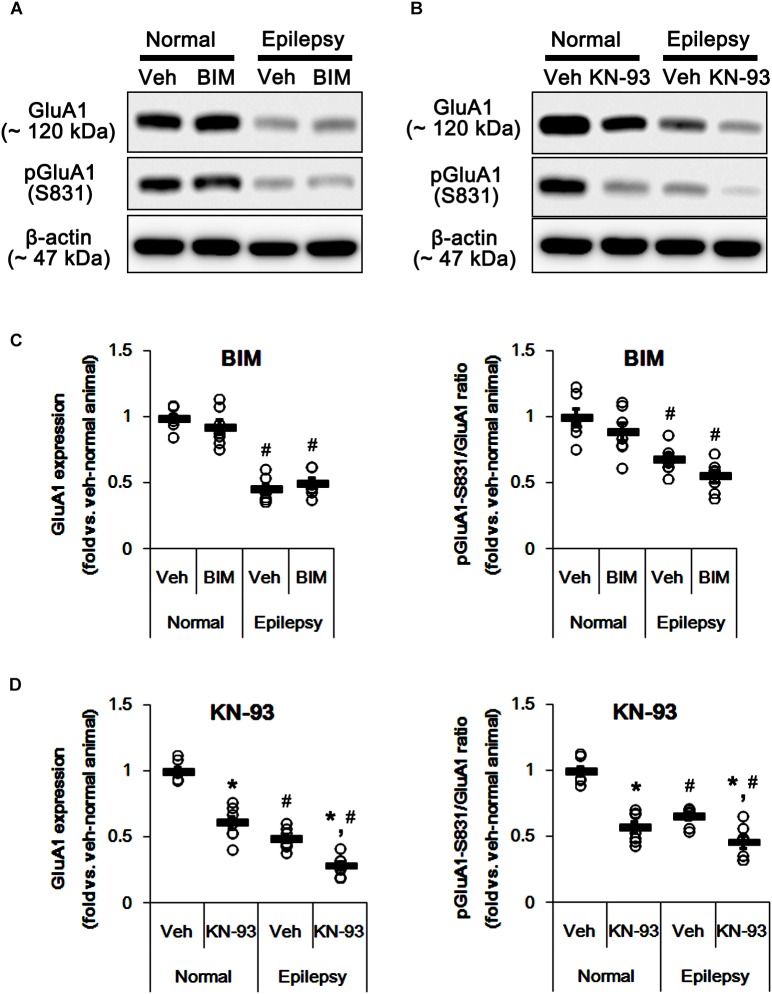
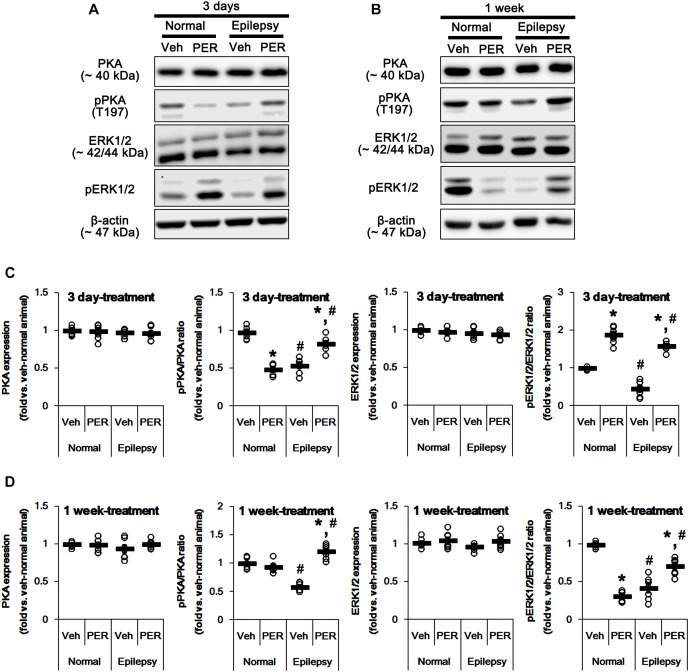
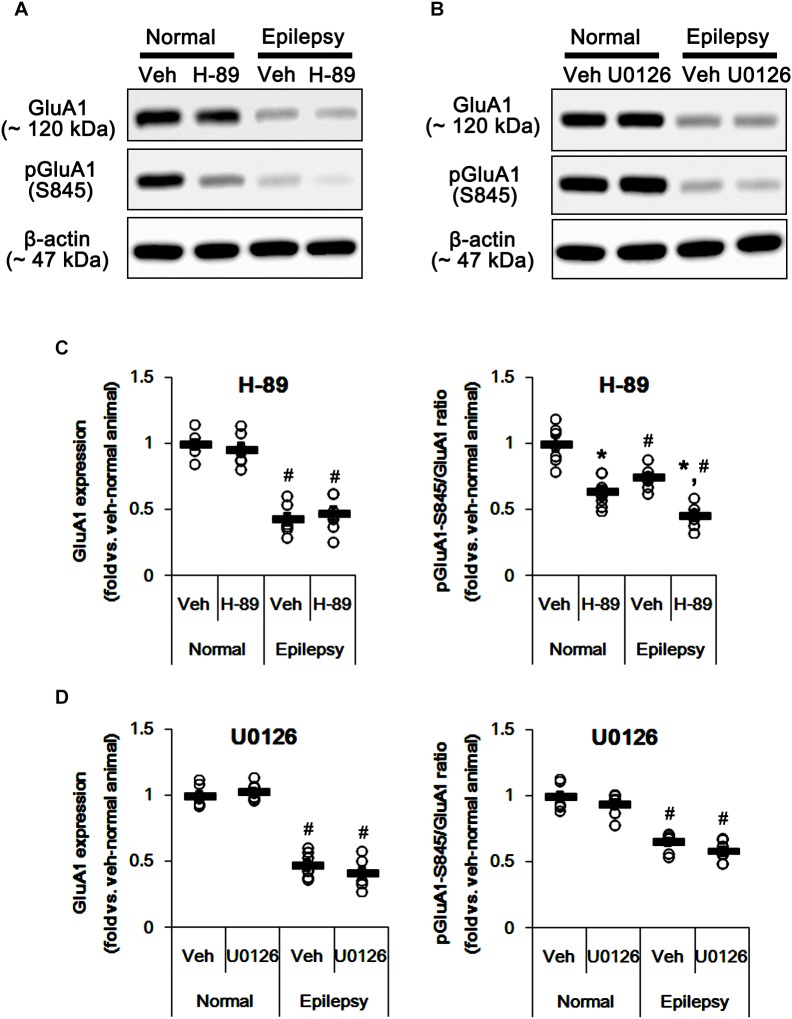
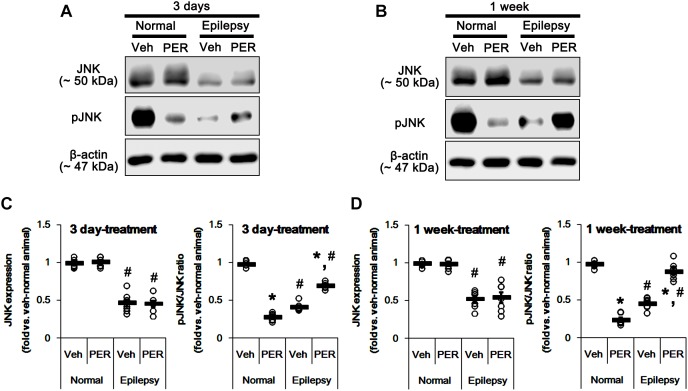
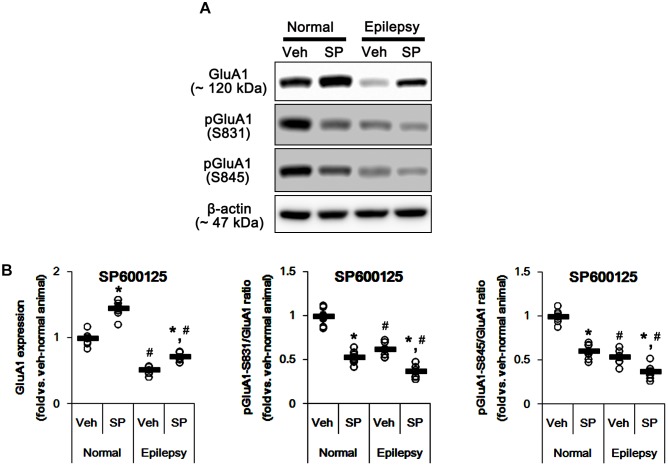
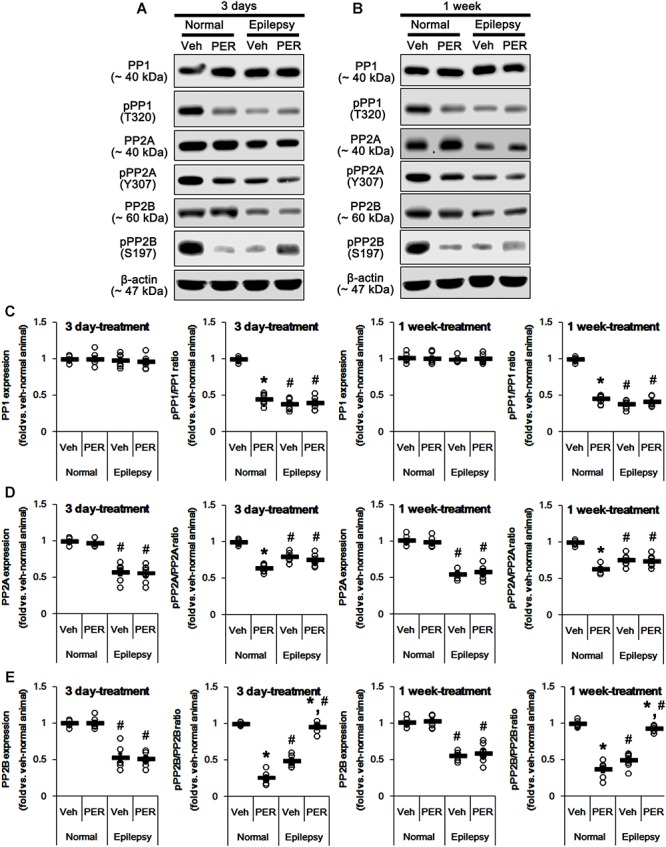
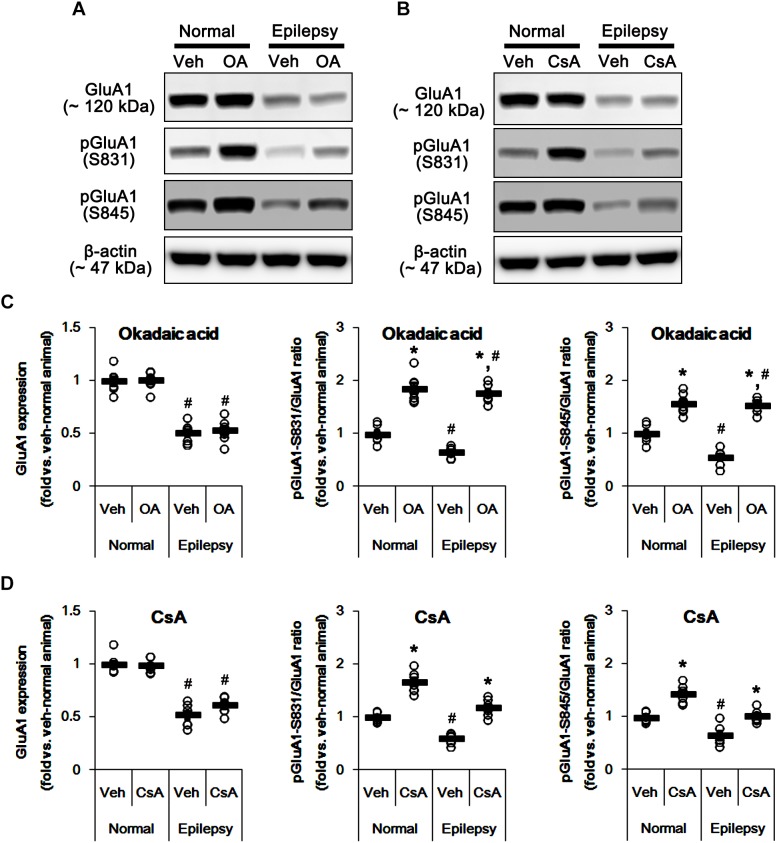
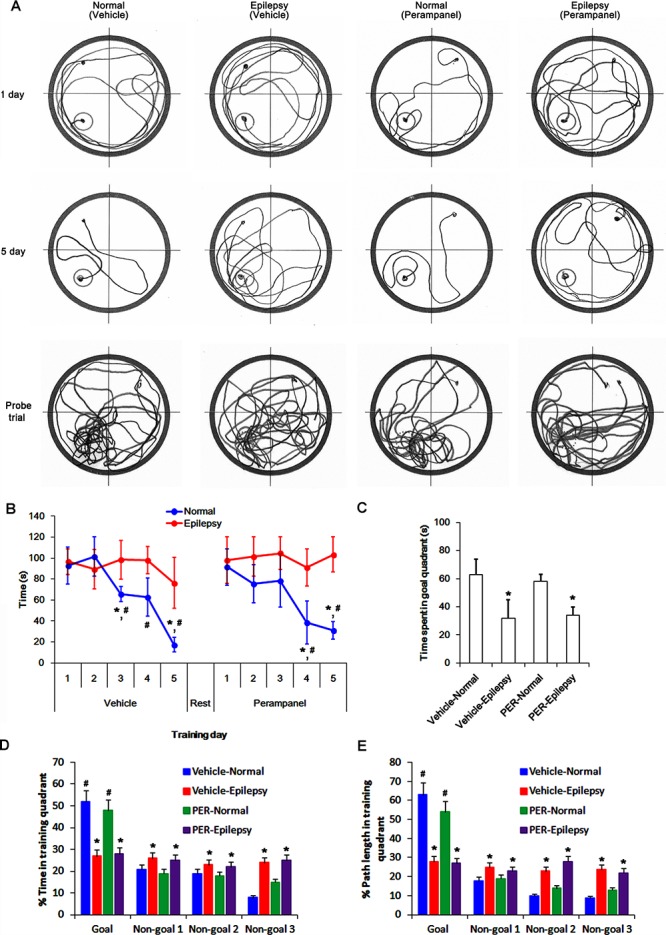
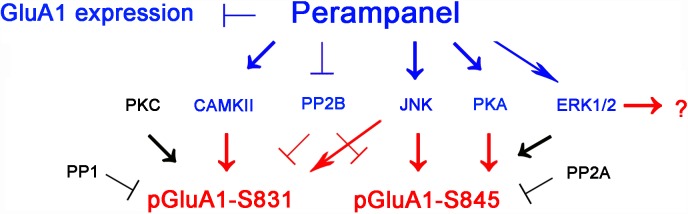
To elucidate the pharmacological properties of perampanel [2-(2-oxo-1-phenyl-5-pyridin-2-yl-1,2-dihydropyridin-3-yl)benzonitrile, a novel non-competitive antagonist of AMPA receptor], we investigated its effects on the up-stream regulatory pathways of GluA1 phosphorylation including protein kinase C (PKC), Ca2+-calmodulin-dependent protein kinase II (CAMKII), protein kinase A (PKA), extracellular signal-regulated kinase 1/2 (ERK1/2), c-Jun N-terminal kinase (JNK), protein phosphatase (PP) 1, PP2A, and PP2B in normal and pilocarpine-induced epileptic rat model using Western blot analysis. In normal animals, perampanel affected GluA1 expression/phosphorylation, PKC, CAMKII, PKA, ERK1/2, JNK, and PPs activities. In epileptic rats, perampanel effectively inhibited spontaneous seizure activities. Perampanel enhanced phospho (p)-GluA1-S831 and -S845 ratios (phosphoprotein/total protein), while it reduced GluA1 expression. Perampanel also increased pCAMKII and pPKA ratios, which phosphorylate GluA1-S831 and -S845 site, respectively. Perampanel elevated pJNK and pPP2B ratios, which phosphorylates and dephosphorylates both GluA1-S831 and -S845 sits. Perampanel also increased pERK1/2 ratio in epileptic animals, while U0126 (an ERK1/2 inhibitor) did not affect pGluA1 ratios. Perampanel did not influence PKC, PP1, and PP2A expression levels and their phosphorylation ratios. In addition, perampanel did not have a detrimental impact on cognitive abilities of epileptic and normal rats in Morris water maze test. These findings suggest that perampanel may regulate AMPA receptor functionality via not only blockade of AMPA receptor but also the regulations of multiple molecules (CAMKII, PKA, JNK, and pPP2B)-mediated GluA1 phosphorylations without negative effects on cognition, although the effects of perampanel on PKC, PP1, and PP2A activities were different between normal and epileptic rats.

Keywords: BIM; CAMKII; ERK1/2; H-89; JNK; KN-93; cyclosporin A; okadaic acid.


Figures

FIGURE 1
FIGURE 1
Scheme of the experimental designs in the present study. (A) Studies for evaluation of the effects of perampanel on expressions/phosphorylations of GluA1, kinases and PPs in normal and epileptic rats. (B) Studies for validation of the effects of kinase and PP inhibitors on GluA1 expression and phosphorylations in normal and epileptic rats. (C) Protocols for measurement of cognitive effects of perampanel by water maze test.
FIGURE 2
FIGURE 2
The effect of perampanel on spontaneous seizure activity in epileptic rats. (A) Representative EEG traces and hippocampal images obtained from normal and epileptic rats. Bar = 400 μm. (B–D) Quantitative values of seizure frequency (B), total seizure duration (C), and seizure severity (D) during 2 h of recording a day. Open circles indicate each individual value. Horizontal bars indicate mean value. Error bars indicate SD (∗,#p < 0.05 vs. vehicle and 3-days perampanel treatment, respectively; n = 7, respectively).
FIGURE 3
FIGURE 3
Effects of perampanel on GluA1 expression and its phosphorylations. (A,B) Representative images for western blot of GluA1, phospho (p)-GluA1-S831, and pGluA1-S845 in the hippocampal tissues obtained from 3-days (A) and 1-week treated groups (B). (C,D) Quantifications of GluA1, pGluA1-S831, and pGluA1-S845 levels in 3-days (C) and 1-week treated groups (D). Open circles indicate each individual value. Horizontal bars indicate mean value. Error bars indicate SEM (∗,#p < 0.05 vs. vehicle-treated animals and normal animals, respectively; n = 7, respectively).
FIGURE 4
FIGURE 4
Effects of perampanel on PKC and CAMKII expressions and their phosphorylations. (A,B) Representative images for western blot of PKC, phospho (p)-PKC, CAMKII, and pCAMKII in the hippocampal tissues obtained from 3-days (A) and 1-week treated groups (B). (C,D) Quantifications of PKC, pPKC, CAMKII, and pCAMKII levels in 3-days (C) and 1-week treated groups (D). Open circles indicate each individual value. Horizontal bars indicate mean value. Error bars indicate SEM (∗,#p < 0.05 vs. vehicle-treated animals and normal animals, respectively; n = 7, respectively).
FIGURE 5
FIGURE 5
Effects of BIM and KN-93 on GluA expressions and their phosphorylations. (A,B) Representative images for western blot of GluA1, phospho (p)-GluA1-S831, and pGluA1-S845 in the hippocampal tissues obtained from 3-days infused groups (B). (C,D) Quantifications of GluA1, pGluA1-S831, and pGluA1-S845 levels in BIM- (C) and KN-93 infused groups (D). Open circles indicate each individual value. Horizontal bars indicate mean value. Error bars indicate SEM (∗,#p < 0.05 vs. vehicle-treated animals and normal animals, respectively; n = 7, respectively).
FIGURE 6
FIGURE 6
Effects of perampanel on PKA and ERK1/2 expressions and their phosphorylations. (A,B) Representative images for western blot of PKA, phospho (p)-PKA, ERK1/2, and pERK1/2 in the hippocampal tissues obtained from 3-days (A) and 1-week treated groups (B). Both ERK1/2 and pERK1/2 antibodies clearly show two (p42 and p44) bands. (C,D) Quantifications of PKA, pPKA, ERK1/2, and pERK1/2 levels in 3-days (C) and 1-week treated groups (D). Open circles indicate each individual value. Horizontal bars indicate mean value. Error bars indicate SEM (∗,#p < 0.05 vs. vehicle-treated animals and normal animals, respectively; n = 7, respectively).
FIGURE 7
FIGURE 7
Effects of H-89 and U0126 on GluA expressions and their phosphorylations. (A,B) Representative images for western blot of GluA1, phospho (p)-GluA1-S831, and pGluA1-S845 in the hippocampal tissues obtained from 3-days infused groups (B). (C,D) Quantifications of GluA1, pGluA1-S831, and pGluA1-S845 levels in H-89- (C) and U0126-infused groups (D). Open circles indicate each individual value. Horizontal bars indicate mean value. Error bars indicate SEM (∗,#p < 0.05 vs. vehicle-treated animals and normal animals, respectively; n = 7, respectively).
FIGURE 8
FIGURE 8
Effects of perampanel on JNK expression and its phosphorylation. (A,B) Representative images for western blot of JNK and phospho (p)-JNK in the hippocampal tissues obtained from 3-days (A) and 1-week treated groups (B). (C,D) Quantifications of JNK and pJNK levels in 3-days (C) and 1-week treated groups (D). Open circles indicate each individual value. Horizontal bars indicate mean value. Error bars indicate SEM (∗,#p < 0.05 vs. vehicle-treated animals and normal animals, respectively; n = 7, respectively).
FIGURE 9
FIGURE 9
Effects of SP600125 (SP) on GluA expressions and their phosphorylations. (A) Representative images for western blot of GluA1, phospho (p)-GluA1-S831, and pGluA1-S845 in the hippocampal tissues obtained from 3-days infused groups. (B) Quantifications of GluA1, pGluA1-S831, and pGluA1-S845 levels in SP600125-infused groups. Open circles indicate each individual value. Horizontal bars indicate mean value. Error bars indicate SEM (∗,#p < 0.05 vs. vehicle-treated animals and normal animals, respectively; n = 7, respectively).
FIGURE 10
FIGURE 10
Effects of perampanel on PP1, PP2A, and PP2B expressions and their phosphorylations. (A,B) Representative images for western blot of PP1, phospho (p)-PP1, PP2A, pPP2A, PP2B, and pPP2B in the hippocampal tissues obtained from 3-days (A) and 1-week treated groups (B). (C–E) Quantifications of PP1, pPP1 (C), PP2A, pPP2A (D), PP2B, and pPP2B (E) levels in 3-days and 1-week treated groups. Open circles indicate each individual value. Horizontal bars indicate mean value. Error bars indicate SEM (∗,#p < 0.05 vs. vehicle-treated animals and normal animals, respectively; n = 7, respectively).
FIGURE 11
FIGURE 11
Effects of okadaic acid (OA) and CsA on GluA expressions and their phosphorylations. (A,B) Representative images for western blot of GluA1, phospho (p)-GluA1-S831, and pGluA1-S845 in the hippocampal tissues obtained from 3-days infused groups (B). (C,D) Quantifications of GluA1, pGluA1-S831, and pGluA1-S845 levels in okadaic acid- (C) and CsA-infused groups (D). Open circles indicate each individual value. Horizontal bars indicate mean value. Error bars indicate SEM (∗,#p < 0.05 vs. vehicle-treated animals and normal animals, respectively; n = 7, respectively).
FIGURE 12
FIGURE 12
Profiles of behavioral test by Morris water maze. (A) Representative traces of swimming plot in Morris water maze test. (B) The quantitative analyses of the Morris water maze. Over 5 days of training, normal rats improve their ability to find the submerged platform, which exhibits decreasing escape time, while epileptic rats do not. Perampanel (PER) does not affect escape duration in normal and epileptic rats. ∗,#p < 0.05 vs. first day and epileptic rats, respectively; n = 5, respectively. Error bars in graphs indicates SEM. (C–E) The quantitative analyses of the probe trials. Perampanel (PER) does not affect the time spent in goal quadrant (C) and the percentage of the time spent (D) and the path length (E) in goal quadrant in normal and epileptic rats. ∗,#p < 0.05 vs. normal animals and non-goal quadrants, respectively; n = 5, respectively. Error bars in graphs indicates SEM.
FIGURE 13
FIGURE 13
Summary of the effects of perampanel on GluA1 phosphorylations in epileptic rats. Perampanel reduces GluA1 expression. In addition, perampanel increases CAMKII, JNK, PKA, PP2B, and ERK1/2 phosphorylations (blue), which regulate GluA1 phosphorylation (red) except ERK1/2. Perampanel does not affect PKC, PP1, and PP2A phosphorylations (black), which are reported to modulate GluA1 phosphorylations.

Similar articles

Cited by

References

    1. Ahn J. H., McAvoy T., Rakhilin S. V., Nishi A., Greengard P., Nairn A. C. (2007). Protein kinase A activates protein phosphatase 2A by phosphorylation of the B56delta subunit. Proc. Natl. Acad. Sci. U.S.A. 104 2979–2984. 10.1073/pnas.0611532104 - DOI - PMC - PubMed
    1. Ahn S. M., Choe E. S. (2009). Activation of group I metabotropic glutamate receptors increases serine phosphorylation of GluR1 alpha-amino-3-hydroxy-5-methylisoxazole-4-propionic acid receptors in the rat dorsal striatum. J. Pharmacol. Exp. Ther. 329 1117–1126. 10.1124/jpet.108.149542 - DOI - PubMed
    1. Banke T. G., Bowie D., Lee H., Huganir R. L., Schousboe A., Traynelis S. F. (2000). Control of GluR1 AMPA receptor function by cAMP-dependent protein kinase. J. Neurosci. 20 89–102. 10.1523/JNEUROSCI.20-01-00089.2000 - DOI - PMC - PubMed
    1. Borges K., Dingledine R. (1998). AMPA receptors: molecular and functional diversity. Prog. Brain Res. 116 153–170. 10.1016/S0079-6123(08)60436-7 - DOI - PubMed
    1. Ceolin L., Bortolotto Z. A., Bannister N., Collingridge G. L., Lodge D., Volianskis A. (2012). A novel anti-epileptic agent, perampanel, selectively inhibits AMPA receptor-mediated synaptic transmission in the hippocampus. Neurochem. Int. 61 517–522. 10.1016/j.neuint.2012.02.035 - DOI - PubMed